Randomized Controlled Trial
. 2022 May 11;12(1):7733.
doi: 10.1038/s41598-022-11306-5.

Minimal handgrip force is needed for transcutaneous electrical stimulation to improve hand functions of patients with severe spinal cord injury

Affiliations
Randomized Controlled Trial

Minimal handgrip force is needed for transcutaneous electrical stimulation to improve hand functions of patients with severe spinal cord injury

Ruyi Huang et al. Sci Rep. .

Abstract

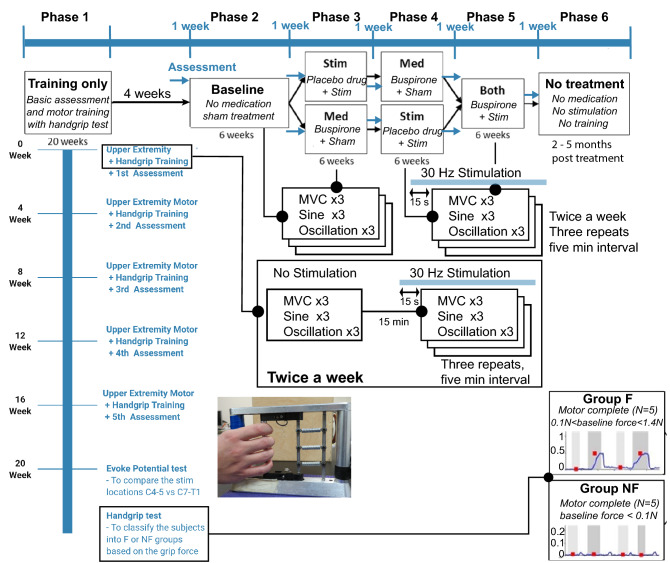
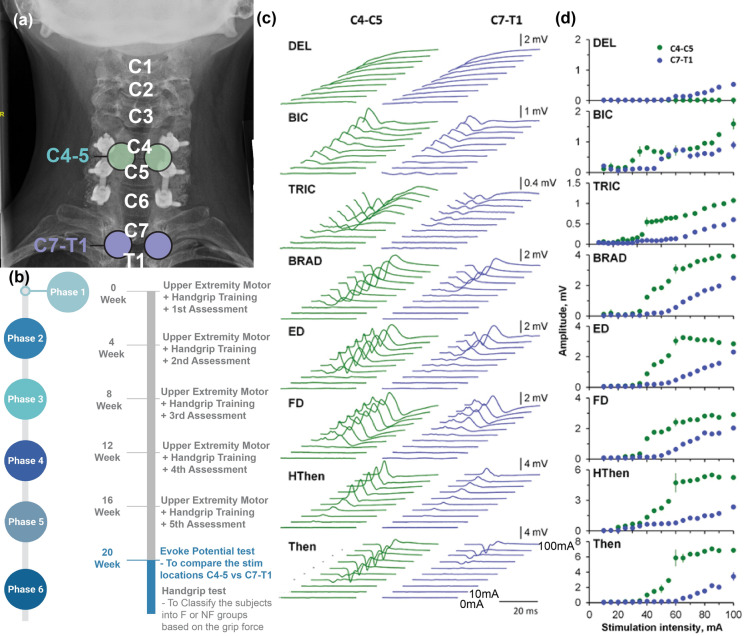
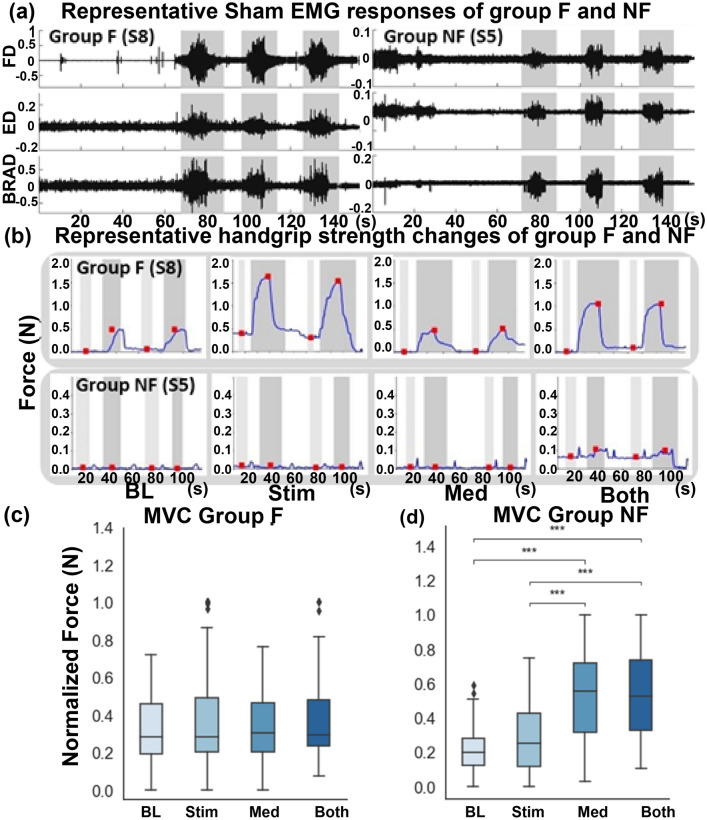
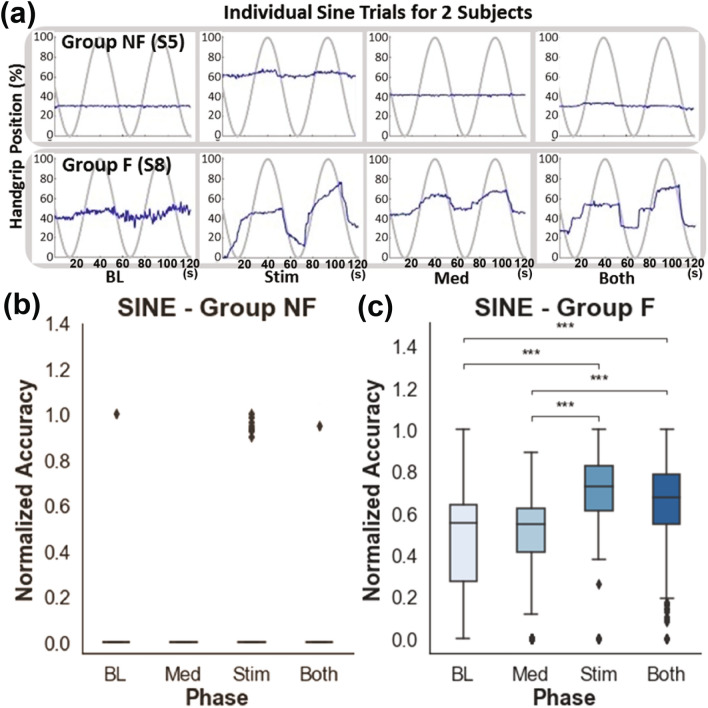
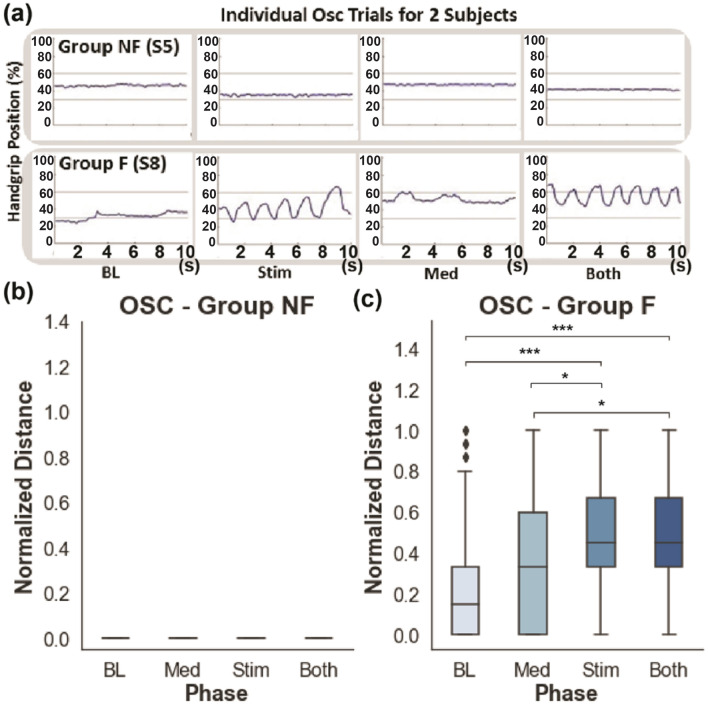
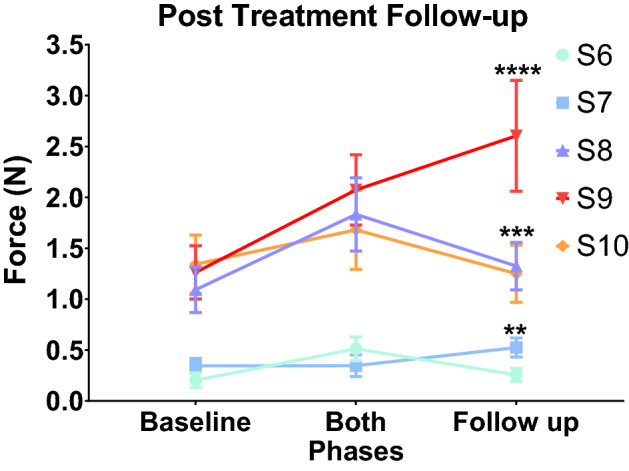
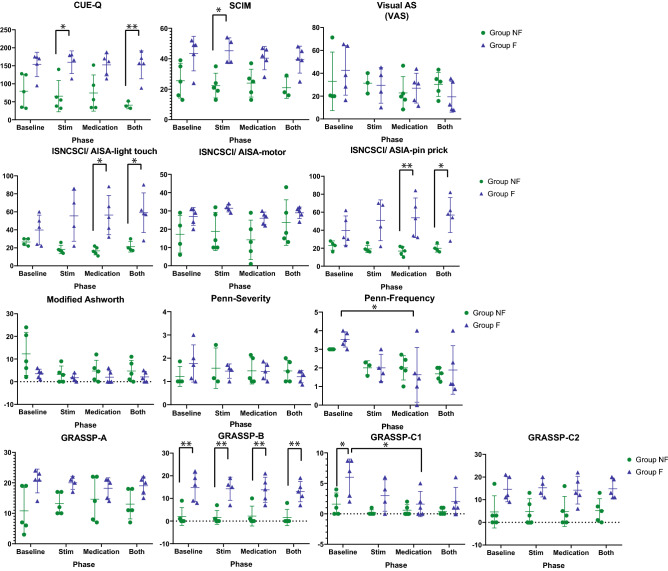
Spinal cord stimulation enhanced restoration of motor function following spinal cord injury (SCI) in unblinded studies. To determine whether training combined with transcutaneous electrical spinal cord stimulation (tSCS), with or without systemic serotonergic treatment with buspirone (busp), could improve hand function in individuals with severe hand paralysis following SCI, we assessed ten subjects in a double-blind, sham-controlled, crossover study. All treatments-busp, tSCS, and the busp plus tSCS-reduced muscle tone and spasm frequency. Buspirone did not have any discernible impact on grip force or manual dexterity when administered alone or in combination with tSCS. In contrast, grip force, sinusoidal force generation and grip-release rate improved significantly after 6 weeks of tSCS in 5 out of 10 subjects who had residual grip force within the range of 0.1-1.5 N at the baseline evaluation. Improved hand function was sustained in subjects with residual grip force 2-5 months after the tSCS and buspirone treatment. We conclude that tSCS combined with training improves hand strength and manual dexterity in subjects with SCI who have residual grip strength greater than 0.1 N. Buspirone did not significantly improve the hand function nor add to the effect of stimulation.


Conflict of interest statement

D.C.L has shareholder interest in Onward and Restore Technologies. V.R.E. has shareholder interest in Onward and SpineX. PG has shareholder interest in SpineX. After ending affiliation with UCLA, L.M. gained employment at Boston Scientific Corporation and later became a stakeholder in Boston Scientific Corporation. The content of this publication is under the sole responsibility of its author/publisher and does not represent the views or opinions of Boston Scientific Corporation. All the other authors have no competing-interest (R.H., A.A.N., S.Z., E.M., T.S., D.S., T.L., T.H., M.M., M.A., M.A., Y.Z., M.R.N., M.S., and J.C.L.).

Figures

Figure 1
Figure 1
Overview of study design and tasks performed. A single population of subjects was recruited from a prior study that assessed the effect of handgrip training alone,. Within the recruited population, two groups were defined: one group of subjects had no hand strength (Group NF; < 0.1 N grip force) and the other population had minimal (> 0.1 N and < 1.4 N) grip force (Group F). The study was broken into six phases as shown above. At the time of enrollment, all subjects underwent baseline physiological assessments to map evoked responses from the spinal cord. The blue arrow indicates the 1-week functional assessment between the four treatment phases as well as before the Baseline (Sham only) and after the Both (buspirone + Stim) phase.
Figure 2
Figure 2
The procedure of determining the stimulation location was based on evoked potential testing. The evoked potential stimulation with 1 Hz was performed after all the hand function training to select the optimal stimulation intensity for each individual subject. (a) Two candidate stimulation locations, C4-C5 (Cyan) and C7-T1 (Blue), were tested. (b) The evoked potential test was performed during the last week of the 20-week Phase 1 period. (c) Representative evoked responses from one participant (S2, AISA A, C4) during tSCS at C4 and C7. The time windows between 5 and 45 ms following the stimulus are shown. (d) The recruitment curves of the right arm muscles of S2 at each location of spinal stimulation are shown. DEL, deltoid; BIC, biceps brachii, TRIC, triceps brachii; BRAD, brachioradialis; ED, extensor digitorum; FD, flexor digitorum; HThen, hypothenar; Then, thenar muscles. (a) is licensed under Shutterstock (Stock photography company).
Figure 3
Figure 3
The performance of MVC test in Group F and NF. (a) Representative forelimb muscle EMG responses of one subject of each group (Group F: S8 and Group NF S5) during initial baseline testing. (b) Representative MVC results of the same subjects in the panel (a). Light gray bars indicate baseline measurement and dark gray bars indicate the time during the attempted pull. Red squares mark the baseline and the maximum values recorded (MVC: F, NF, n = 5 for each group). (c, d) Normalized MVC results from Group NF and Group F, respectively. The number of asterisks indicates the threshold significance level detected by three-way ANOVA; *: P < 0.05, **: P < 0.01, and ***: P < 0.001. Black diamonds indicate outlier values. Baseline (BL), stimulation only (Stim), medication only (Med) and combined stimulation and medication (Both). The means and the standard deviation (SD) are shown.
Figure 4
Figure 4
The performance of the SINE test in Group F and NF. (a) Representative results of SINE testing from two subjects, one from each group (Group F: S8 and Group NF S5). (b, c) Normalized sine scores for Group NF and Group F, respectively (n = 5 for each group). The number of asterisks indicates the threshold significance level detected by the three-way ANOVA; *: P < 0.05, **: P < 0.01, and ***: P < 0.001. The means and the standard deviation (SD) are shown.
Figure 5
Figure 5
The performance of the OSC test in Group F and NF. (a) Representative results of OSC testing from two subjects, one from each group (Group F: S8 and Group NF S5). (b, c) Normalized oscillation scores for Group NF and Group F, respectively (n = 5 for each group). The number of asterisks indicates the threshold significance level detected by the two-way ANOVA; *: P < 0.05, **: P < 0.01, and ***: P < 0.001. The means and the standard deviation (SD) are shown.
Figure 6
Figure 6
Follow-up MVC values when there was no stimulation or buspirone given to the patients in Group F 5 months after the last session of treatment. The MVC values of pre-treatment baseline (Baseline), the Both-phase (patients received both the stimulation and buspirone, Stim + Busp), and the follow-up washout sessions (Follow-up No Stim or Busp) were recorded from at least three different visits during each phase for subjects in Group F (**: P < 0.01 S7, ***: P < 0.05 S8, and ****: P < 0.0001 S9 when compared to the Baseline, detected by two-way ANOVA and Tukey’s test). The means and the standard deviation (SD) are shown.
Figure 7
Figure 7
Results of the functional assessments. Standardized functional measures recorded at the end of each phase including baseline (BL), stimulation only (Stim), medication only (Med), and combined stimulation and medication (Both) for major functional test including AIS measurement for motor and sensory function, the Modified Ashworth scale of muscle tone, the self-assessed Penn spasm scale for frequency and severity of spasticity, and the self-assessed VAS as measure of spasticity. Treatment order is listed in the same order for each subject and does not reflect the actual order of treatment that each subject received. The number of asterisks indicates the threshold significance level detected by the two-way ANOVA; *: P < 0.05, **: P < 0.01, and ***: P < 0.001. The means and the standard deviation (SD) are shown.

Similar articles

Cited by

References

    1. Harvey LA, Batty J, Jones R, Crosbie J. Hand function of C6 and C7 tetraplegics 1–16 years following injury. Spinal Cord. 2001;39:37–43. doi: 10.1038/sj.sc.3101101. - DOI - PubMed
    1. Marino RJ, Shea JA, Stineman MG. The capabilities of upper extremity instrument: Reliability and validity of a measure of functional limitation in tetraplegia. Arch. Phys. Med. Rehabil. 1998;79:1512–1521. doi: 10.1016/S0003-9993(98)90412-9. - DOI - PubMed
    1. Murphy CP, Chuinard RG. Management of the upper extremity in traumatic tetraplegia. Hand Clin. 1988;4:201–209. doi: 10.1016/S0749-0712(21)01138-0. - DOI - PubMed
    1. de los Reyes-Guzmán A, et al. Kinematic analysis of the daily activity of drinking from a glass in a population with cervical spinal cord injury. J. Neuroeng. Rehabil. 2010;7:41. doi: 10.1186/1743-0003-7-41. - DOI - PMC - PubMed
    1. Freehafer AA. Care of the hand in cervical spinal cord injuries. Paraplegia. 1969;7:118–130. - PubMed

Publication types