. 2022 Jul;19(7):791-804.
doi: 10.1038/s41423-022-00871-4. Epub 2022 May 11.

Bacteroides ovatus-mediated CD27- MAIT cell activation is associated with obesity-related T2D progression

Affiliations

Bacteroides ovatus-mediated CD27- MAIT cell activation is associated with obesity-related T2D progression

Yue Li et al. Cell Mol Immunol. 2022 Jul.

Abstract

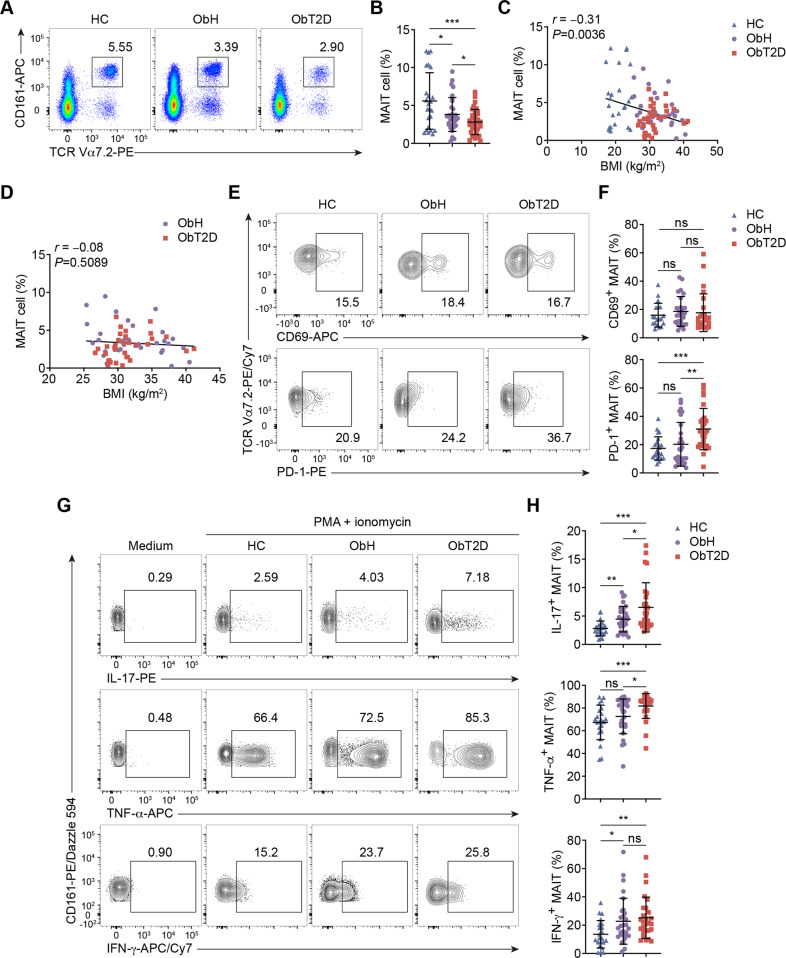
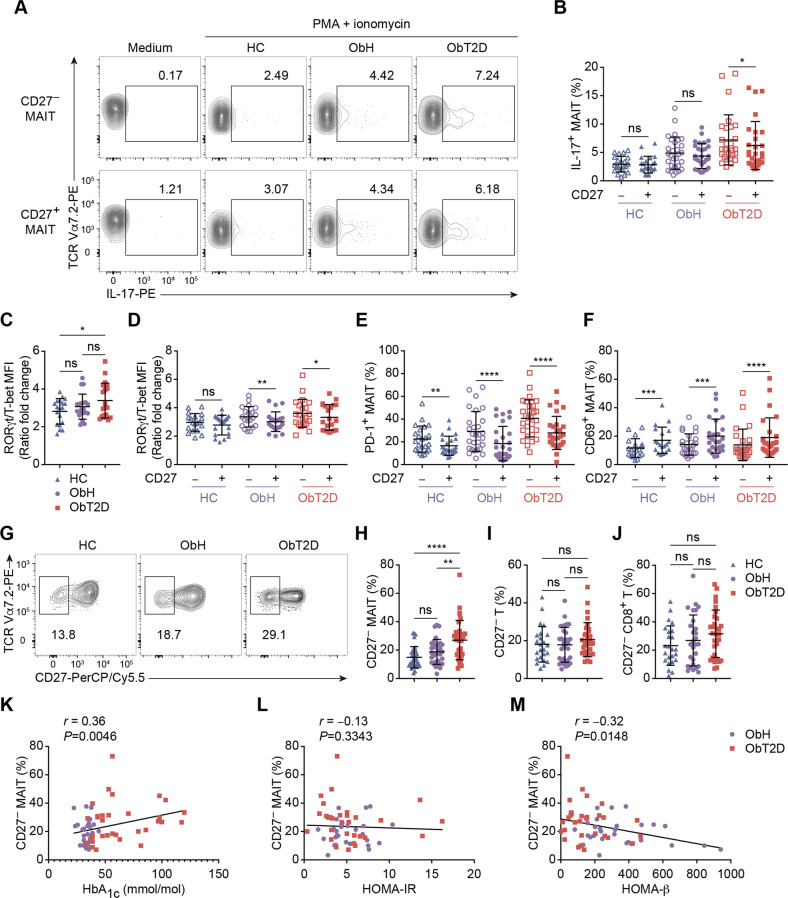
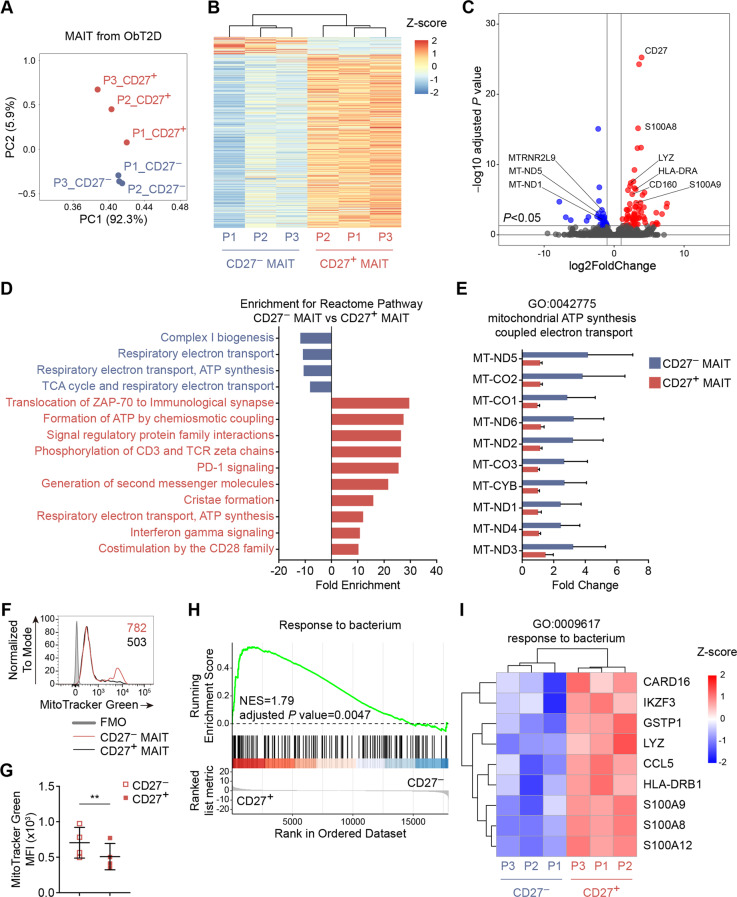
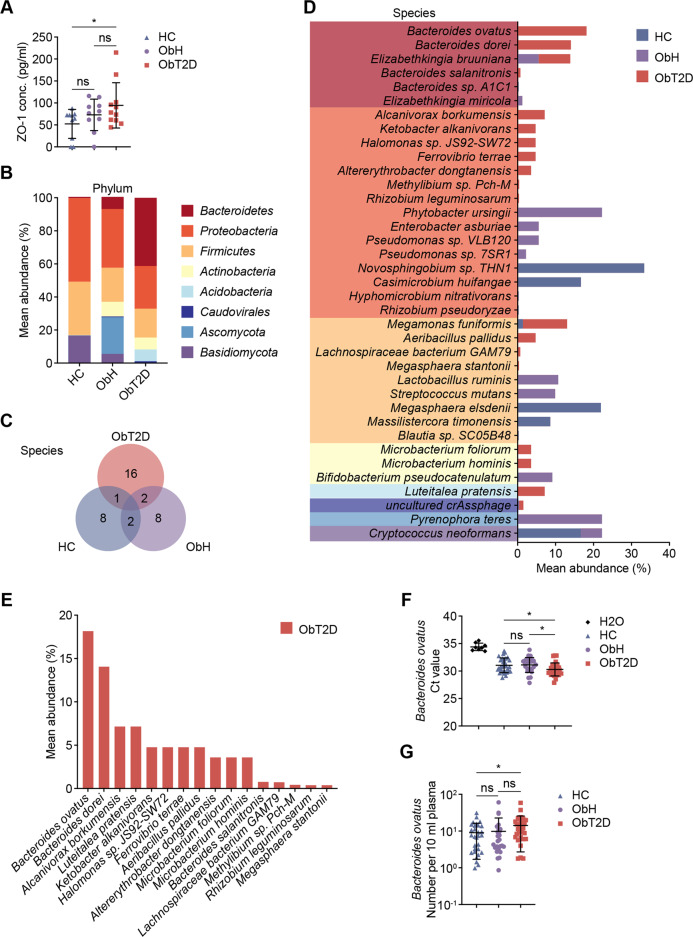
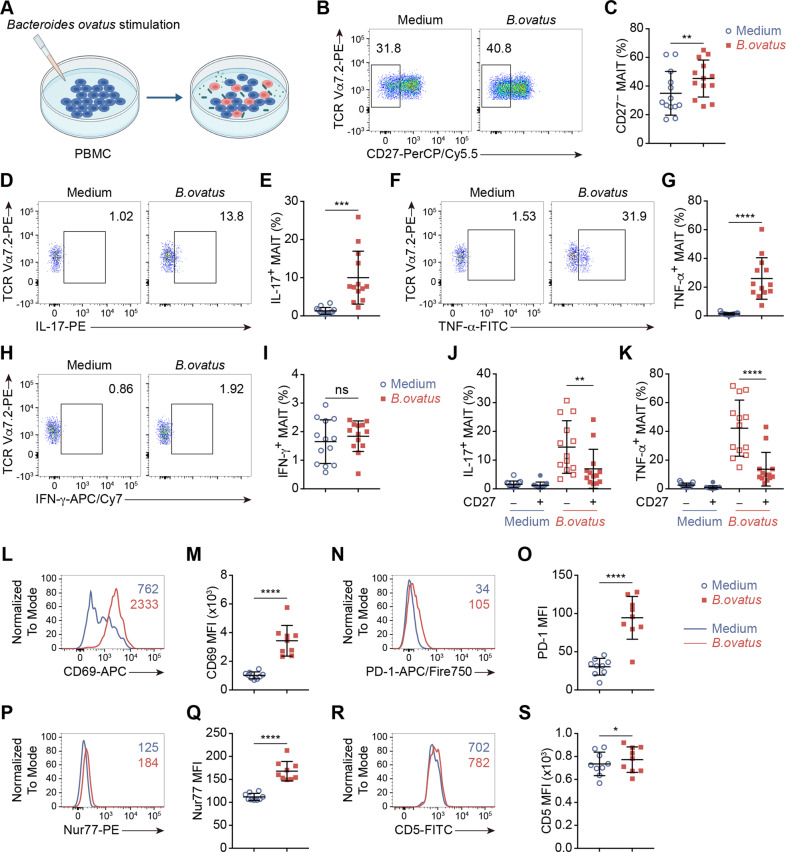
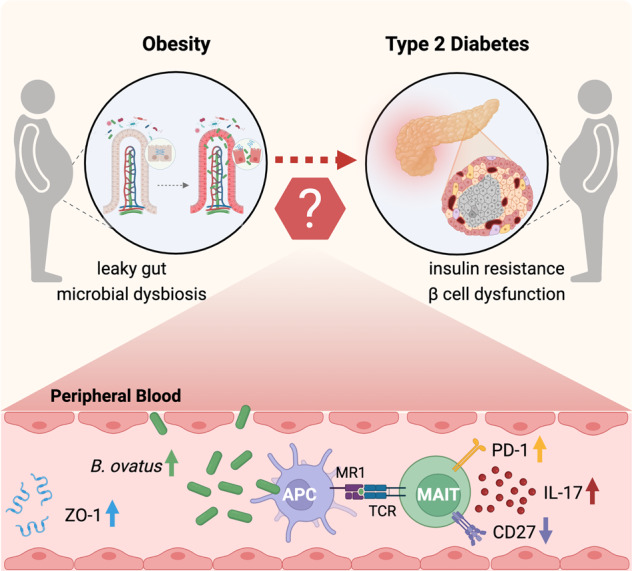
Type 2 diabetes (T2D) is highly associated with obesity. However, the factors that drive the transition from excessive weight gain to glucose metabolism disruption are still uncertain and seem to revolve around systemic immune disorder. Mucosal-associated invariant T (MAIT) cells, which are innate-like T cells that recognize bacterial metabolites, have been reported to be altered in obese people and to lead to metabolic dysfunction during obesity. By studying the immunophenotypes of blood MAIT cells from a cross-sectional cohort of obese participants with/without T2D, we found an elevation in CD27-negative (CD27-) MAIT cells producing a high level of IL-17 under T2D obese conditions, which could be positively correlated with impaired glucose metabolism in obese people. We further explored microbial translocation caused by gut barrier dysfunction in obese people as a triggering factor of MAIT cell abnormalities. Specifically, accumulation of the bacterial strain Bacteroides ovatus in the peripheral blood drove IL-17-producing CD27- MAIT cell expansion and could be associated with T2D risk in obese individuals. Overall, these results suggest that an aberrant gut microbiota-immune axis in obese people may drive or exacerbate T2D. Importantly, CD27- MAIT cell subsets and Bacteroides ovatus could represent targets for novel interventional strategies. Our findings extend current knowledge regarding the clinical relevance of body mass index (BMI)-associated variation in circulating MAIT cells to reveal the role of these cells in obesity-related T2D progression and the underlying cellular mechanisms.

Keywords: Bacteroides ovatus; MAIT cells; bacterial translocation; obesity; type 2 diabetes.


Conflict of interest statement

The authors declare no competing interests.

Figures

Fig. 1
Fig. 1
Frequency and functional alterations of circulating MAIT cells in overweight/obese patients without or with T2D. PBMCs were collected from healthy donors (HC, n = 24) and overweight/obese adults without T2D (ObH, n = 31) or with T2D (ObT2D, n = 33) and were analyzed by flow cytometry. A, B Frequencies of circulating MAIT cells (CD3+ CD161+ TCR Vα7.2+). Correlations between the frequency of circulating MAIT cells and BMI of adults in the HC, ObH, and ObT2D groups (C) or the ObH and ObT2D groups (D). Frequencies of CD69+ (E) and PD-1+ (F) MAIT cells among the total MAIT cells in the HC (n = 23 and 19 for (E) and (F), respectively), ObH (n = 28 and 26 for E and F, respectively) and ObT2D (n = 28 and 26 for (E) and (F), respectively) groups. G, H Flow cytometry analysis of IL-17+, TNF-α+ and IFN-γ+ MAIT cells among the total MAIT cells after PMA and ionomycin stimulation in the HC (n = 22), ObH (n = 29), and ObT2D (n = 27) groups. Each symbol represents a single individual (BD, F and H), and error bars indicate the mean with the SD (B, F and H). ns P > 0.05, *P < 0.05, **P < 0.01 and ***P < 0.001; two-tailed unpaired Student’s t test (B, F and H). Pearson’s correlation test (C, D).
Fig. 2
Fig. 2
The CD27-negative MAIT cell subset is associated with T2D progression in overweight/obese patients. A, B Flow cytometry analysis of IL-17+ MAIT cells among CD27 or CD27+ MAIT cells after PMA and ionomycin stimulation in the HC (n = 22), ObH (n = 29) and ObT2D (n = 27) groups or without stimulation (medium). Mean fluorescence intensity (MFI) ratio of RORγt to T-bet in total MAIT cells (C) and CD27 and CD27+ MAIT cell subsets (D) in the HC (n = 19), ObH (n = 20) and ObT2D (n = 21) groups. Frequencies of CD69+ (E) and PD-1+ (F) MAIT cells among the CD27 or CD27+ MAIT cell subsets in the HC (n = 23 and 19 for E and F, respectively), ObH (n = 28 and 26 for (E) and (F), respectively) and ObT2D (n = 28 and 26 for (E) and (F), respectively) groups. G, H Frequency of the CD27 MAIT cell subset in the HC (n = 24), ObH (n = 31) and ObT2D (n = 33) groups. Frequencies of CD27 T (I) and CD27 CD8+ T (J) cells in the HC (n = 24 and 24 for (I) and (J), respectively), ObH (n = 31 and 28 for (I) and (J), respectively) and ObT2D (n = 33 and 30 for (I) and (J), respectively) groups. Correlations between the frequency of circulating CD27 MAIT cells and the HbA1c level (K), HOMA-IR score (L) and HOMA-β score (M) in adults in the ObH (n = 30, 27, and 27 for K, L, and M, respectively) and ObT2D (n = 32, 30, and 30 for (K), (L), and (M), respectively) groups. Each symbol represents a single individual (BF, HM), and error bars indicate the mean with the SD (BF and HJ). ns P > 0.05, *P < 0.05, **P < 0.01, ***P < 0.001 and ****P < 0.0001; two-tailed paired Student’s t test (B, DF), two-tailed unpaired Student’s t test (C, HJ). Spearman’s correlation test (KM).
Fig. 3
Fig. 3
CD27-negative MAIT cells exhibit an increased mitochondrial mass and decreased response to bacterial transcriptional patterns. Circulating CD27 and CD27+ MAIT cells were isolated from 3 obese adults with T2D by fluorescence-activated cell sorting (FACS) and were subjected to RNA-seq analysis. A Principal component analysis (PCA) showed that the gene expression pattern of CD27 MAIT cells was different from that of CD27+ MAIT cells. B Heatmap revealing the clustering of differentially expressed genes between CD27 and CD27+ MAIT cells. C Volcano plot showing the differentially expressed genes (adjusted P value of RNA-seq < 0.05) between CD27 and CD27+ MAIT cells. Significantly differentially expressed genes (DEGs, adjusted P value < 0.05) are highlighted in red (upregulated, log2FoldChange ≥ 1) and blue (downregulated, log2FoldChange ≤ −1). Selected genes related to mitochondria and the response to bacteria are indicated. D Reactome pathways enriched among the genes upregulated in CD27 (blue) and CD27+ MAIT cells (red). E Bar plots showing the corresponding expression profiles of genes related to mitochondrial function (GO: 0042775) between CD27 and CD27+ MAIT cells. F, G MitoTracker Green staining of circulating CD27 and CD27+ MAIT cells from the ObT2D group was quantified by flow cytometry. The gray line in F shows the fluorescence minus one (FMO) control staining. The numbers in F represent the MFI for each group. H Gene set enrichment analysis (GSEA) showing the response to bacterial signatures depleted in CD27 MAIT cells. I Heatmap depicting the corresponding expression profiles of genes involved in the response to bacteria (GO: 0009617) between CD27 and CD27+ MAIT cells. Each symbol represents a single individual, and error bars indicate the mean with the SD (G). **P < 0.01; two-tailed paired Student’s t test (G)
Fig. 4
Fig. 4
Unique microbial signature in peripheral blood of obese patients with T2D. A Enzyme-linked immunosorbent assay (ELISA) was used to analyze the tight junction protein ZO-1 level in plasma from the HC (n = 10), ObH (n = 10) and ObT2D (n = 11) groups. BE Comparative metagenomic analysis was performed for peripheral blood specimens from 6 HC donors and 13 ObH and 7 ObT2D participants. B Relative abundance of the major phyla of microbes in the metagenomes of blood samples from the HC, ObH, and ObT2D groups. C Number of unique or common microbial species among the HC, ObH, and ObT2D groups. D Relative abundance of the microbial species in the metagenomes of blood samples from the HC, ObH, and ObT2D groups. Species within the same color column belong to the corresponding phylum in (B). E Relative abundance of the unique microbial species in the ObT2D group. F, G Comparisons of Bacteroides ovatus Endo-1,4-beta-xylanase Z precursor (xynZ) gene detection using qPCR. Cycle threshold (Ct) values (F) and B. ovatus number per 10 ml of plasma determined by absolute quantification using diluted B. ovatus as a standard curve (G) are shown for each sample from the HC (n = 30, including six newly recruited lean healthy donors), ObH (n = 26) and ObT2D (n = 30) groups. Water served as a negative control (n = 8). Each symbol represents a single individual, and error bars indicate the mean with SD (A, FG). ns P > 0.05, *P < 0.05; two-tailed unpaired Student’s t test.
Fig. 5
Fig. 5
The immune response of circulating MAIT cells to Bacteroides ovatus stimulation in vitro reproduces the alteration of MAIT cells in diabetic obese patients in vivo. A A schematic representation showing the B. ovatus stimulation protocol. PBMCs from the ObT2D group were stimulated with heat-killed B. ovatus (100 bacteria per cell) or were cultured in growth medium (medium) for 1 day in 96-well plates. BK Flow cytometry analysis showing the frequencies of CD27 MAIT cells (B, C) and IL-17- (D, E), TNF-α- (F, G), and IFN-γ-producing (H, I) MAIT cells after B. ovatus stimulation compared to no stimulation. Frequencies of IL-17+ (J) and TNF-α+ (K) MAIT cells among CD27 or CD27+ MAIT cell subsets without or with bacterial stimulation (n = 13 for C, E, G, I and K) Flow cytometry analysis showing the expression of CD69 (L, M), PD-1 (N, O), Nur77 (P, Q) and CD5 (R, S) on MAIT cells after B. ovatus stimulation compared to no stimulation (n = 9 for M, O, Q and S). The numbers in L, N, P, and R represent the MFI for each group. Each symbol represents a single individual, and error bars indicate the mean with the SD (C, E, G, I, K, M, O, Q, and S). ns P > 0.05, *P < 0.05, **P < 0.01, ***P < 0.001 and ****P < 0.0001; two-tailed paired Student’s t test.
Fig. 6
Fig. 6
Aberrant gut microbiota–immune system–glucose metabolism axis is associated with the risk of T2D in overweight/obese people. Disturbed gut barrier function caused by excessive weight leads to translocation of the gut microbiota, which facilitates leakage of a specific enteric bacterial strain, namely, Bacteroides ovatus, into the periphery and serves as a triggering factor of IL-17-producing CD27 MAIT cell expansion, which is positively correlated with impaired glucose metabolism.

Similar articles

Cited by

References

    1. Pillon NJ, Loos RJF, Marshall SM, Zierath JR. Metabolic consequences of obesity and type 2 diabetes: Balancing genes and environment for personalized care. Cell. 2021;184:1530–44. doi: 10.1016/j.cell.2021.02.012. - DOI - PMC - PubMed
    1. Bramante CT, Lee CJ, Gudzune KA. Treatment of obesity in patients with diabetes. Diabetes Spectr. 2017;30:237–43. doi: 10.2337/ds17-0030. - DOI - PMC - PubMed
    1. Wondmkun YT. Obesity, insulin resistance, and type 2 diabetes: associations and therapeutic implications. Diabetes Metab Syndr Obes. 2020;13:3611–6. doi: 10.2147/DMSO.S275898. - DOI - PMC - PubMed
    1. Ying W, Lee YS, Dong Y, Seidman JS, Yang M, Isaac R, et al. Expansion of ISLET-resident macrophages leads to inflammation affecting beta cell proliferation and function in obesity. Cell Metab. 2019;29:457–74 e455. doi: 10.1016/j.cmet.2018.12.003. - DOI - PMC - PubMed
    1. McLaughlin T, Ackerman SE, Shen L, Engleman E. Role of innate and adaptive immunity in obesity-associated metabolic disease. J Clin Investig. 2017;127:5–13. doi: 10.1172/JCI88876. - DOI - PMC - PubMed

Publication types

Substances

Supplementary concepts