. 2022 May;605(7910):503-508.
doi: 10.1038/s41586-022-04712-2. Epub 2022 May 11.

Genetic and chemotherapeutic influences on germline hypermutation

Collaborators, Affiliations

Genetic and chemotherapeutic influences on germline hypermutation

Joanna Kaplanis et al. Nature. 2022 May.

Abstract

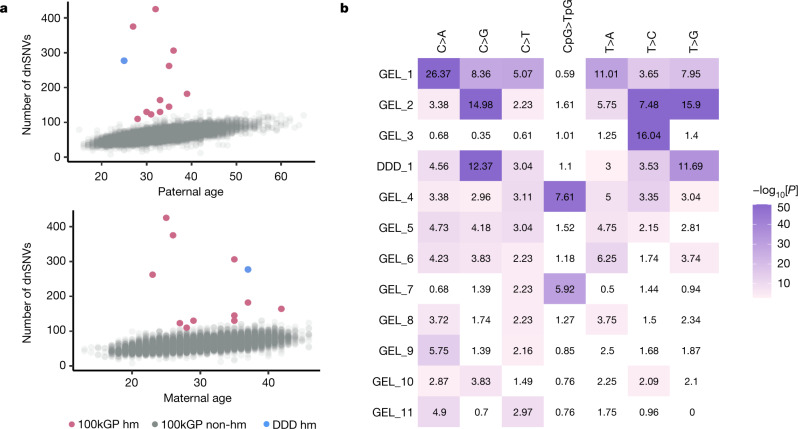
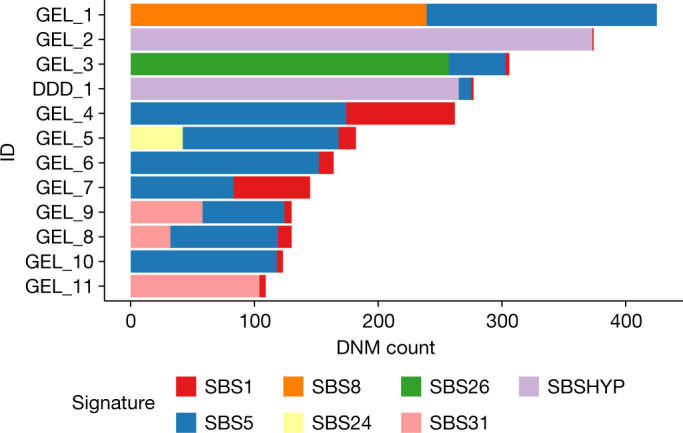
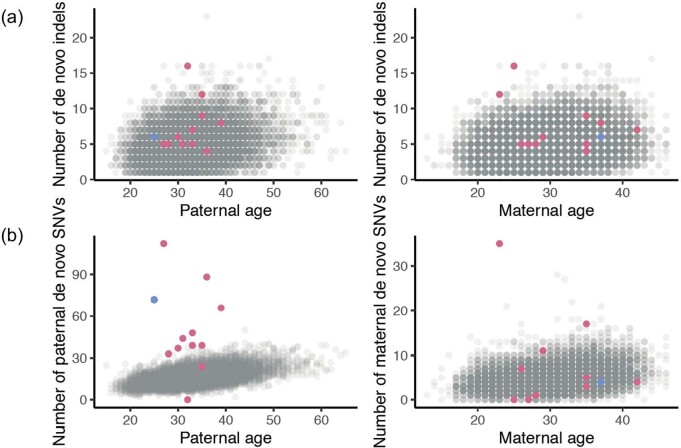
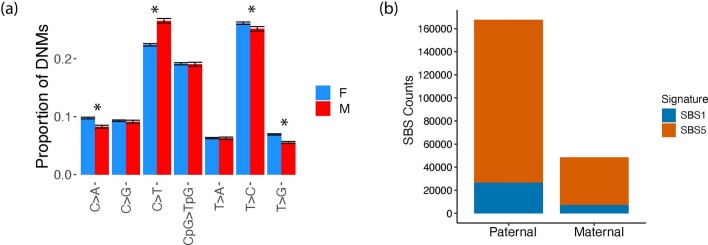
Mutations in the germline generates all evolutionary genetic variation and is a cause of genetic disease. Parental age is the primary determinant of the number of new germline mutations in an individual's genome1,2. Here we analysed the genome-wide sequences of 21,879 families with rare genetic diseases and identified 12 individuals with a hypermutated genome with between two and seven times more de novo single-nucleotide variants than expected. In most families (9 out of 12), the excess mutations came from the father. Two families had genetic drivers of germline hypermutation, with fathers carrying damaging genetic variation in DNA-repair genes. For five of the families, paternal exposure to chemotherapeutic agents before conception was probably a key driver of hypermutation. Our results suggest that the germline is well protected from mutagenic effects, hypermutation is rare, the number of excess mutations is relatively modest and most individuals with a hypermutated genome will not have a genetic disease.


Conflict of interest statement

M.H. is a co-founder of, consultant to and holds shares in Congenica, a genetics diagnostic company. L.M. and C.O. are employees of Genomics England Ltd.

Figures

Fig. 1
Fig. 1. Identification of individuals with germline hypermutation.
a, Paternal and maternal age versus the number of dnSNVs. Individuals with hypermutation (hm) from the 100kGP cohort (pink) and individuals with hypermutation from the DDD cohort (blue) are highlighted. b, Enrichment (observed/expected) of mutation type for individuals with hypermutation. Sample names are shown on the y axis, and mutation type is shown on the x axis. The enrichment is coloured by the −log10[enrichment P value], determined using two-sided Poisson tests comparing the average number of mutations in each type across all individuals in the 100kGP cohort. White colouring indicates no statistically significant enrichment after multiple-testing correction (P < 0.05/12 × 7 tests). Exact P values are provided in Supplementary Table 2.
Fig. 2
Fig. 2. Mutational signatures in individuals with germline hypermutation.
Contributions of mutational signatures extracted using SigProfiler and decomposed onto known somatic mutational signatures as well as the signature SBSHYP that we identified in both DDD_1 and GEL_2.
Fig. 3
Fig. 3. A135T substitution alters the DNA glycosylase activity of MPG.
a, Active-site view of MPG bound to εA-DNA from Protein Data Bank 1EWN. Ala135 and His136 form the binding pocket for the flipped-out base lesion, which is bracketed by Tyr127 on the opposing face. b, Single-turnover excision of εA from εA•T is twofold faster for A135T (red) than for wild-type (blue) MPG. c, Single-turnover excision of Hx from Hx•T is slower for A135T (red) compared with wild-type (blue) MPG. The arrows indicate the N-glycosidic bond that is cleaved by MPG. Data are mean ± s.d. for glycosylase reactions with 10 nM DNA substrate and either 100 nM enzyme for εA excision (n = 6) or 40 nM enzyme for Hx excision (n = 3) (Extended Data Fig. 9).
Extended Data Fig. 1
Extended Data Fig. 1. Parental age and number of DNMs.
(a) Paternal and maternal age against the number of dnInDels. (b) Paternal age against number of paternally phased dnSNVs and maternal age against number of maternally phased dnSNVs. Hypermutated individuals are highlighted in pink (11 individuals in 100kGP) and blue (DDD individuals).
Extended Data Fig. 2
Extended Data Fig. 2. Mutational spectra and signatures for maternal vs paternal DNMs across 100kGP cohort.
(a) Mutational spectra for maternal vs paternal DNMs across 100kGP cohort (48,381 maternal DNMs and 167,558 paternal DNMs). Significant differences (chi-squared test, two sided, Bonferroni corrected threshold of P < 0.05/7) are marked with * (p-values: C > A 4.6310-23,C > G 0.20, C > T 3.2510-80, CpG>TpG 0.75, T > A 0.98, T > C1.6210-5,T > G 6.8110-28). The 95% confidence intervals are shown. (b) Mutational signature decomposition for DNMs in maternally and paternally derived DNMs. Signatures extracted with SigProfiler. Colours correspond to COSMIC signatures.
Extended Data Fig. 3
Extended Data Fig. 3. Mutational spectra for the DNMs of hypermutated individuals part 1.
(a–f correspond to individual GEL_1, GEL_2, DDD_1, GEL_3, GEL_4, and GEL_5 respectively). Each row is a hypermutated individual showing the mutational spectra according to count of mutations per each single base change (with CpG>TpG mutations separated from other C>T mutations) and the second plot is the mutation count for all 96 mutations in their trinucleotide context. The x-axis demonstrates the reference trinucleotide sequence with the mutated base highlighted. The colour and label on the bar above indicates the mutation type.
Extended Data Fig. 4
Extended Data Fig. 4. Mutational spectra for the DNMs hypermutated individuals part 2.
(a–f correspond to individual GEL_6, GEL_7, GEL_8, GEL_9, GEL_10 and GEL_11 respectively). Each row is a hypermutated individual showing the mutational spectra according to count of mutations per each single base change (with CpG>TpG mutations separated from other C>T mutations) and the second plot is the mutation count for all 96 mutations in their trinucleotide context. The x-axis demonstrates the reference trinucleotide sequence with the mutated base highlighted. The colour and label on the bar above indicates the mutation type.
Extended Data Fig. 5
Extended Data Fig. 5. Novel mutational signature SBSHYP.
Trinucleotide context mutational profile of novel extracted mutational signature SBSHYP.
Extended Data Fig. 6
Extended Data Fig. 6. Transcriptional strand bias for DNMs in hypermutated individuals.
Plot shows the count of each mutation type on the transcribed and untranscribed strand for each individual. P-values of transcriptional strand bias tests are given in Extended Data Table 1.
Extended Data Fig. 7
Extended Data Fig. 7. Distribution of VAF for DNMs in hypermutated individuals.
The vertical line indicates 0.5 VAF. The two plots highlighted in pink are those where the DNMs appear post-zygotic. P-values of VAF tests are given in Extended Data Table 1.
Extended Data Fig. 8
Extended Data Fig. 8. Determination of active concentration of MPG.
(a) Representative native gel electrophoresis with 20 nM pyrolidine-DNA (Y•T) and varying concentration of WT or A135T MPG (25 mM NaHEPES pH 7.5, 100 mM NaCl, 5% v/v glycerol, 1 mM EDTA, 1 mM DTT). Agarose gels (2% w/v) were run in 0.5X TBE buffer at 10 V/cm at 4 °C. (b) Independent dilutions were fit to a binding titration to yield an active fraction of 0.57 for both WT and A135T (n = 3). This demonstrates that equal concentrations of WT and A135T were tested in the glycosylase assays. The concentrations listed are not corrected by this factor. The points shown are the mean and error bars show 1 standard deviation.
Extended Data Fig. 9
Extended Data Fig. 9. In vitro glycosylase activity of WT and A135T MPG.
(a) Glycosylase assay for recombinant protein and 25mer lesion-containing oligonucleotides (O’Brien 2003). MPG excises lesion X from X•Y duplex to create an abasic site, which is subsequently hydrolysed by NaOH to create a 12mer product. (b) Representative denaturing gel scanned for fluorescein fluorescence. (c-d) Concentration independent excision of εA from opposing T and C shows increased rate of N-glycosidic bond cleavage by A135T. (panel c, n = 6; panel d, n = 4) (e-f) Concentration dependence for single-turnover excision of Hx from opposing T and C contexts shows decreased catalytic efficiency for A135T as compared to WT MPG. These single turnover rate constants were fit to the equation kobs = kmax [MPG]/ (K1/2 + [MPG]). (g-h) Steady state concentration dependence for excision of εA was performed in order to measure the catalytic efficiency (kcat/KM) for A135T and WT MPG using 5 nM enzyme and the indicated concentration of substrate. To circumvent the tight binding by MPG, 800 mM NaCl was added to the standard buffer as previously described, using the equation V/E = kcat/KM[S] (panel e-h, n = 3). Mean ± SD is shown for at least 3 independent experiments.

Similar articles

Cited by

References

    1. Kong A, et al. Rate of de novo mutations and the importance of father’s age to disease risk. Nature. 2012;488:471–475. doi: 10.1038/nature11396. - DOI - PMC - PubMed
    1. Jónsson H, et al. Parental influence on human germline de novo mutations in 1,548 trios from Iceland. Nature. 2017;549:519–522. doi: 10.1038/nature24018. - DOI - PubMed
    1. Conrad DF, et al. Variation in genome-wide mutation rates within and between human families. Nat. Genet. 2011;43:712–714. doi: 10.1038/ng.862. - DOI - PMC - PubMed
    1. Roach JC, et al. Analysis of genetic inheritance in a family quartet by whole-genome sequencing. Science. 2010;328,:636–639. doi: 10.1126/science.1186802. - DOI - PMC - PubMed
    1. Sasani TA, et al. Large, three-generation human families reveal post-zygotic mosaicism and variability in germline mutation accumulation. eLife. 2019;8:e46922. doi: 10.7554/eLife.46922. - DOI - PMC - PubMed