. 2022 May;605(7910):509-515.
doi: 10.1038/s41586-022-04722-0. Epub 2022 May 11.

Young CSF restores oligodendrogenesis and memory in aged mice via Fgf17

Affiliations

Young CSF restores oligodendrogenesis and memory in aged mice via Fgf17

Tal Iram et al. Nature. 2022 May.

Erratum in

Abstract

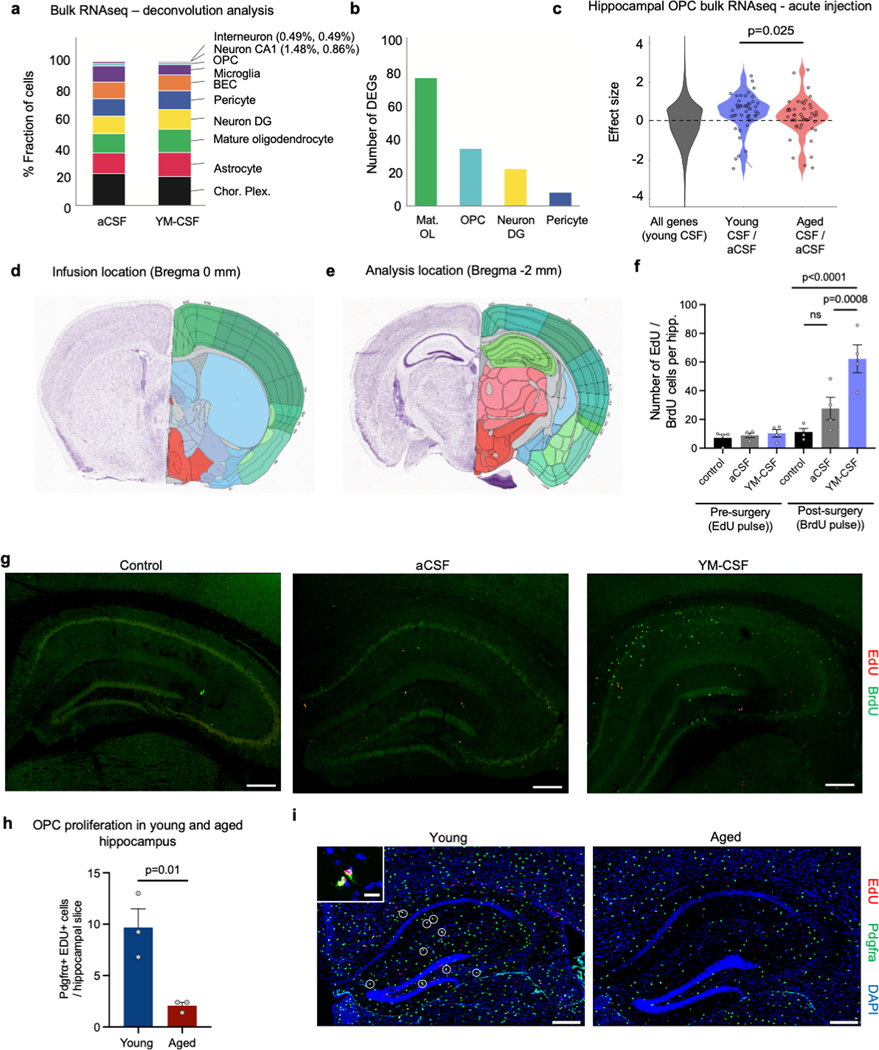
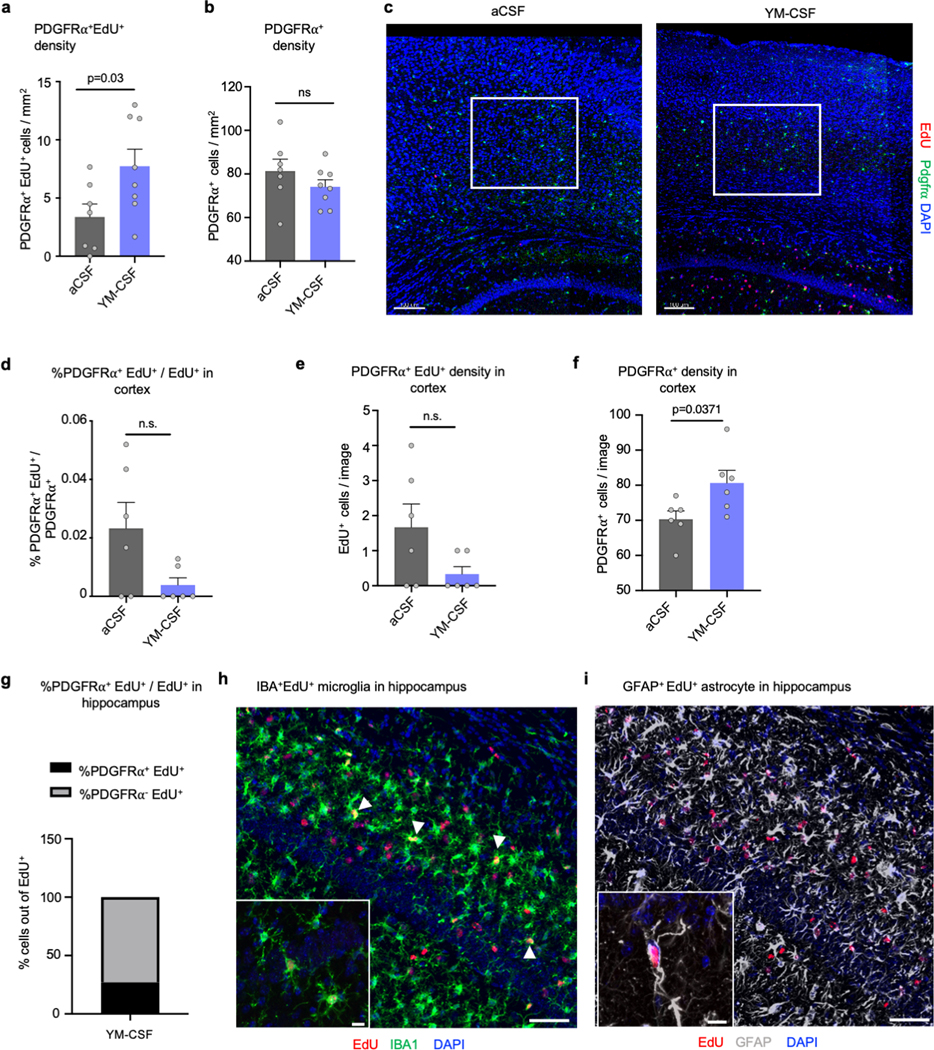
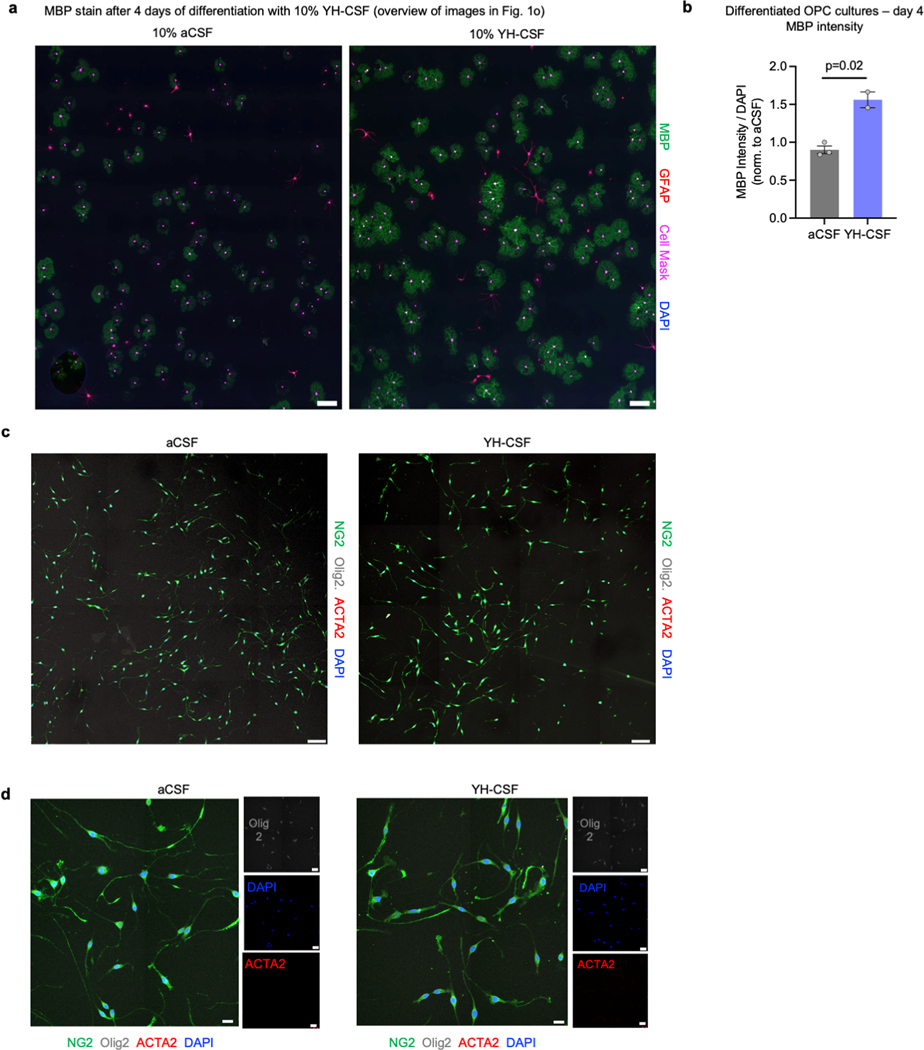
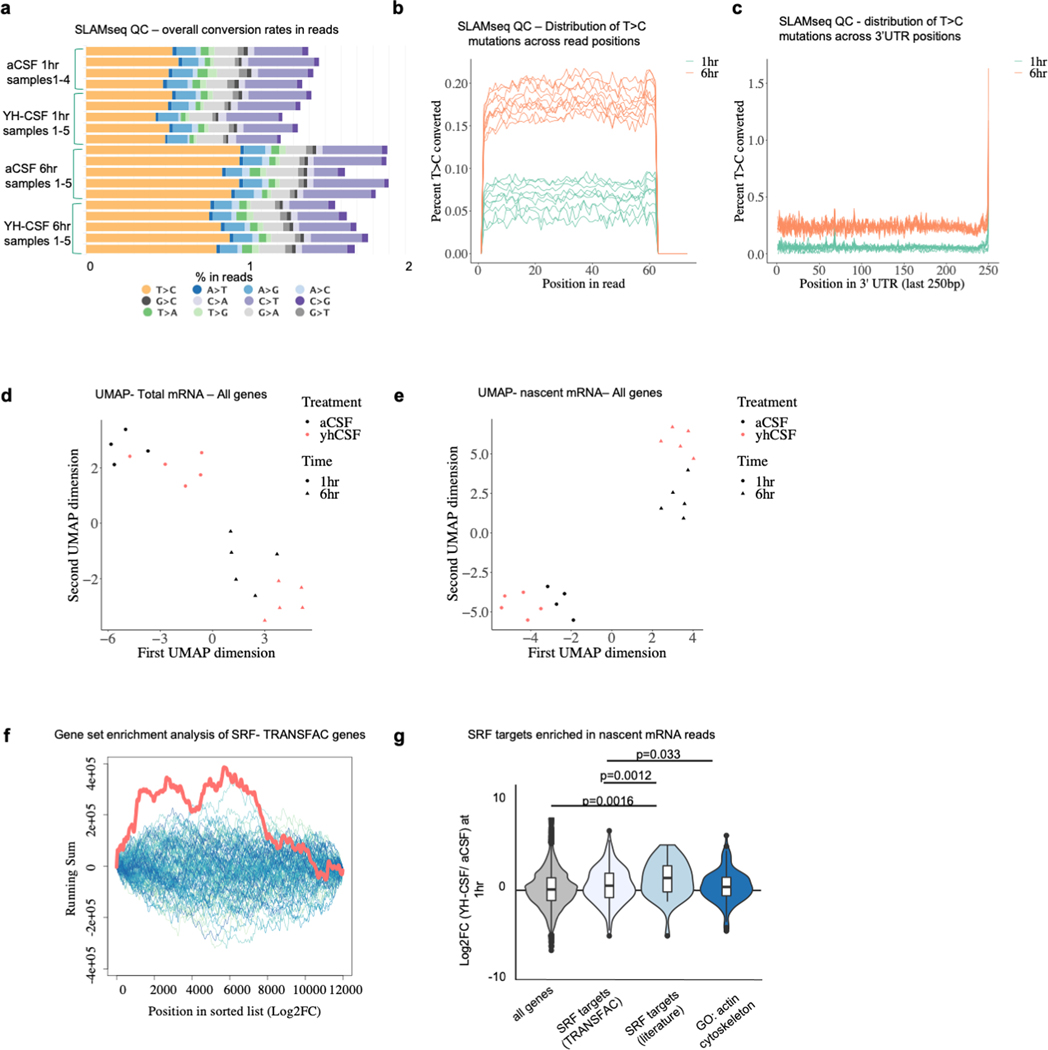
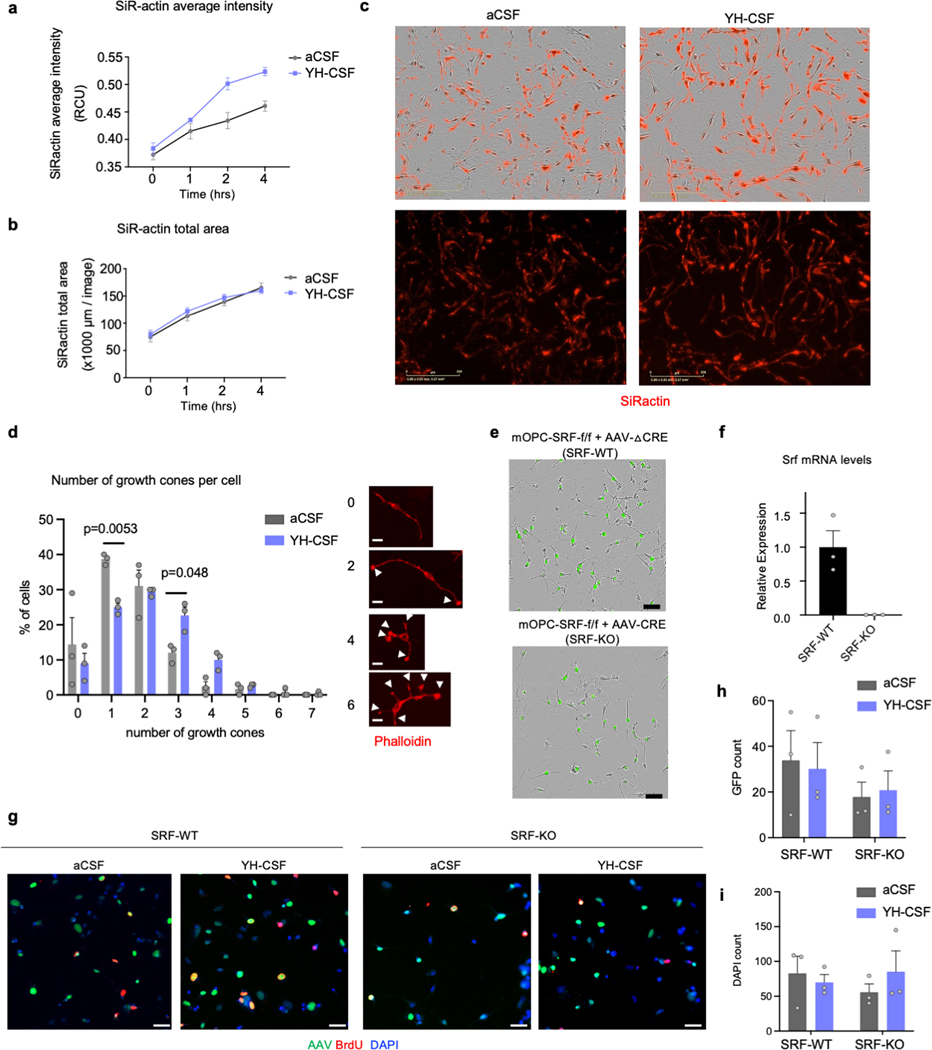
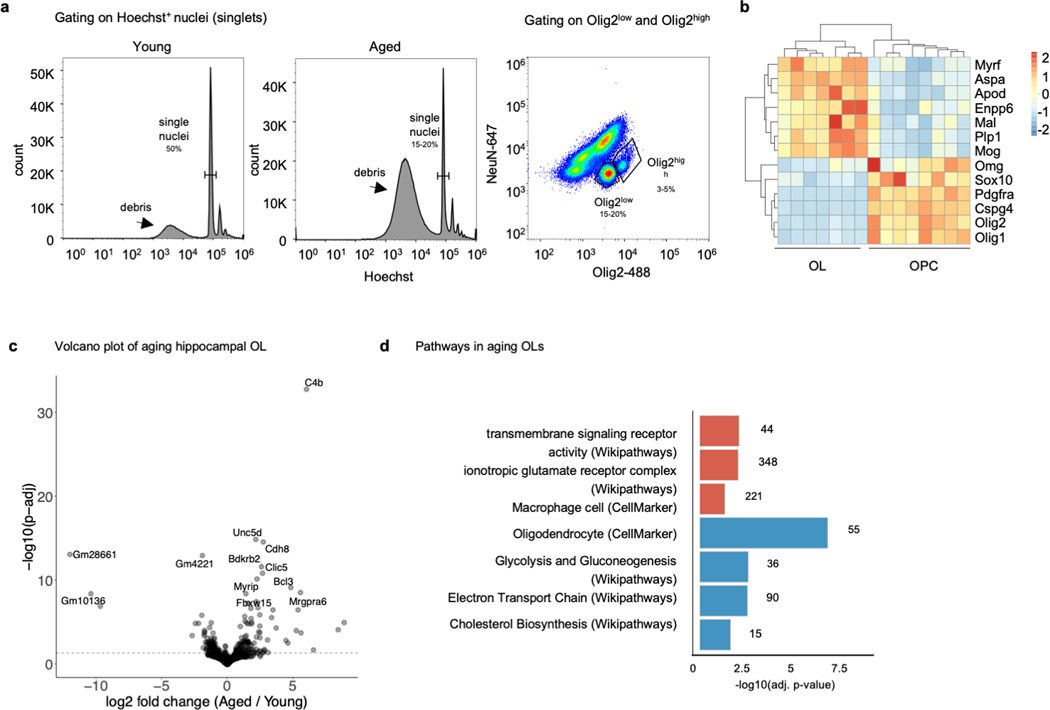
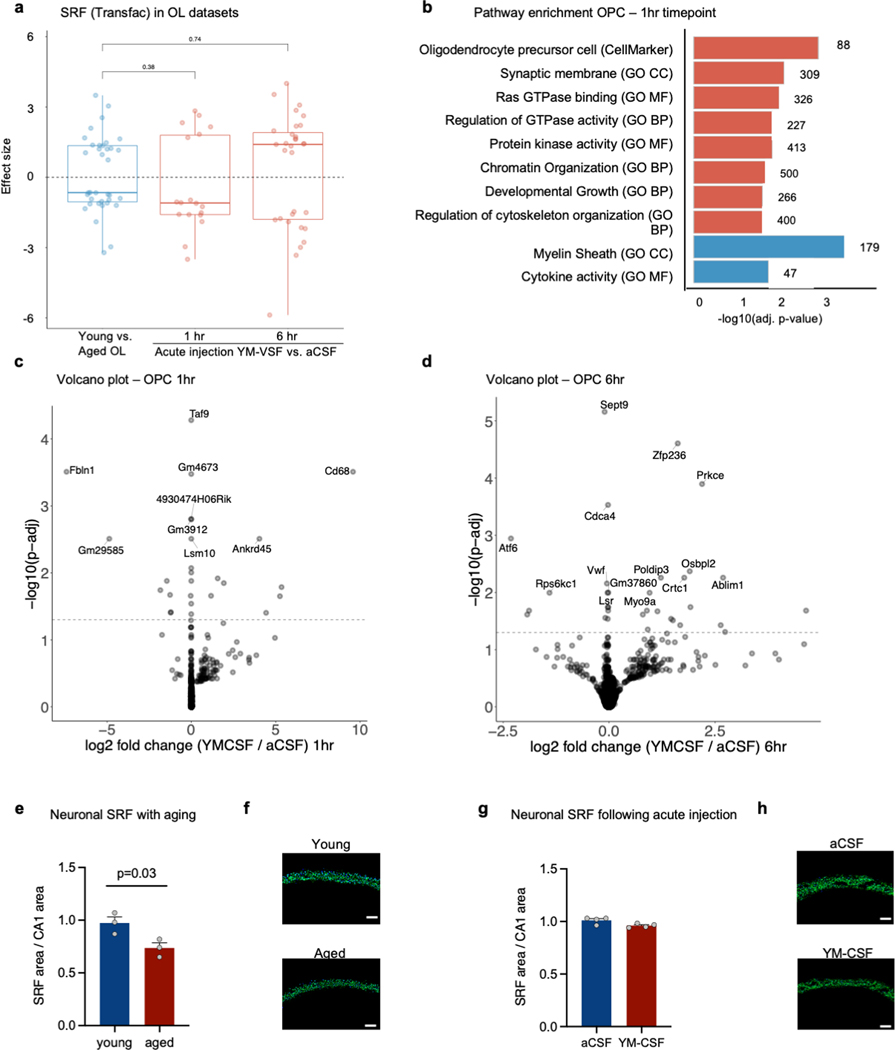
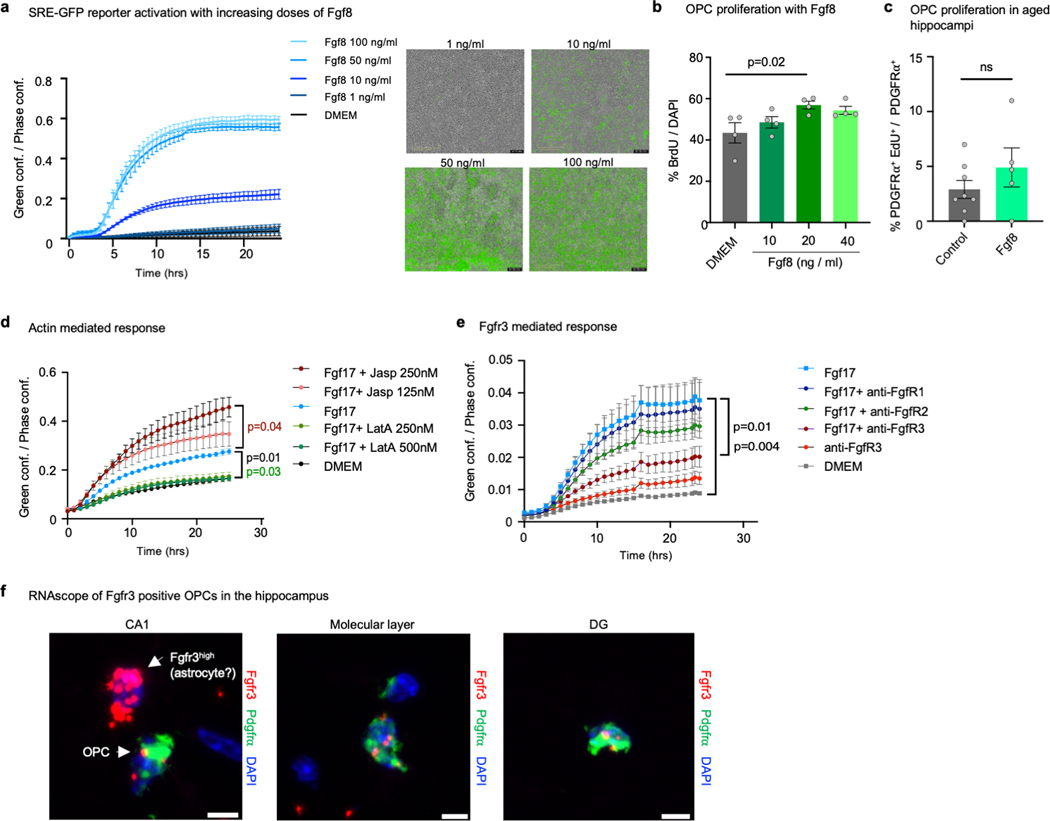
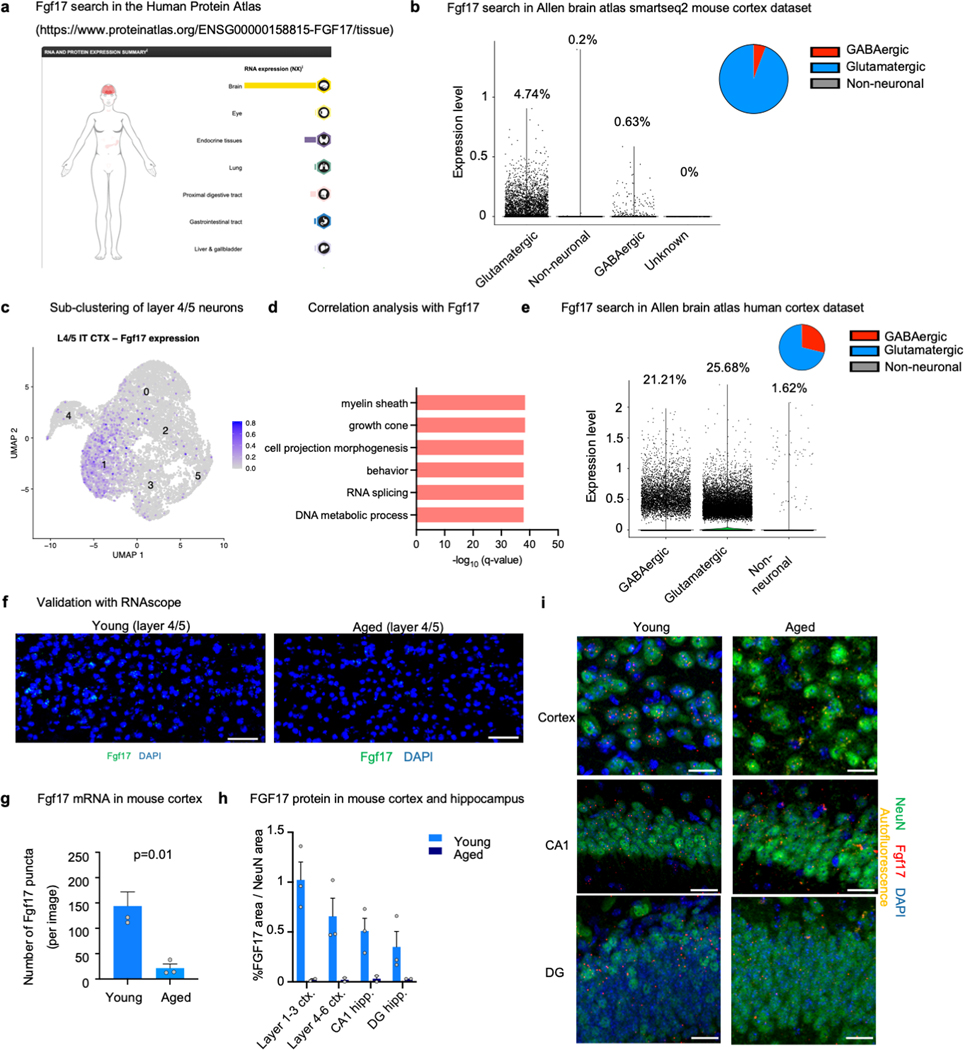
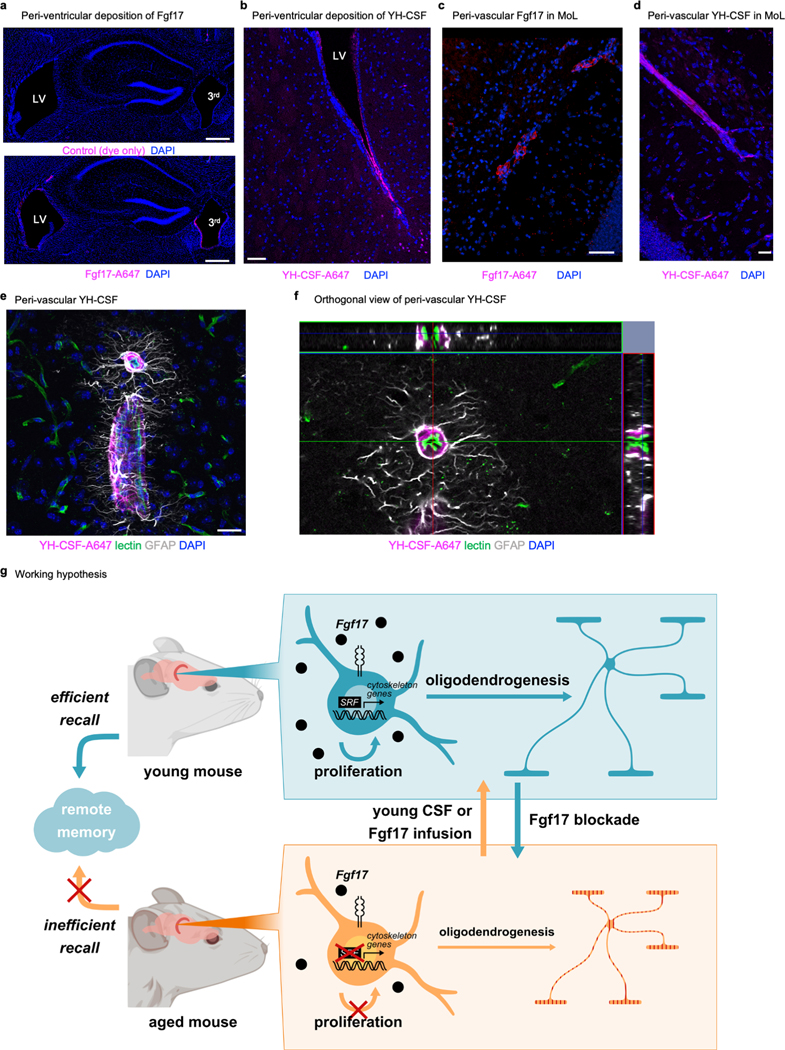
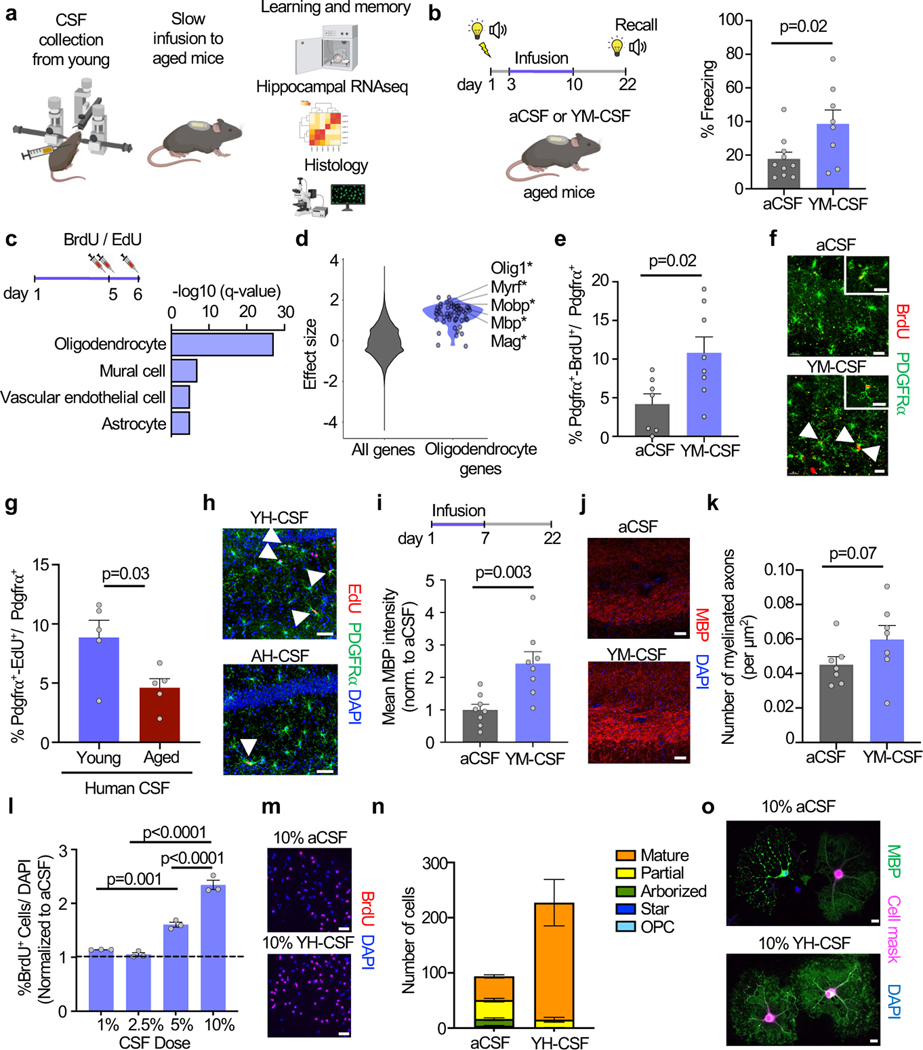
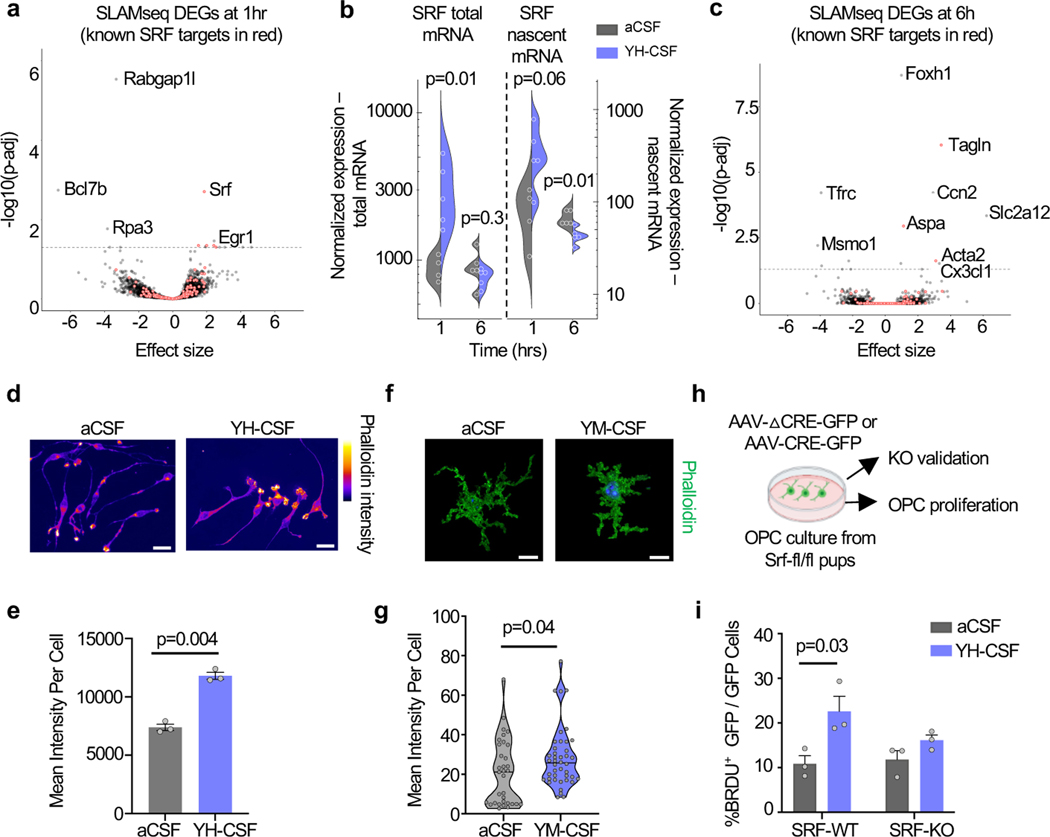
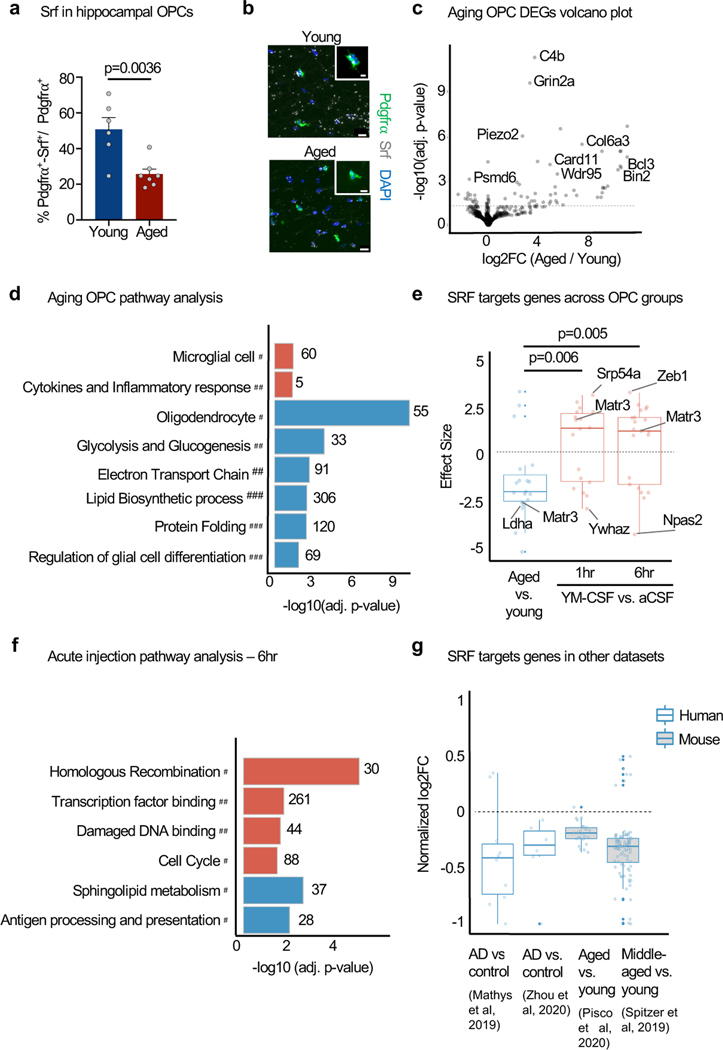
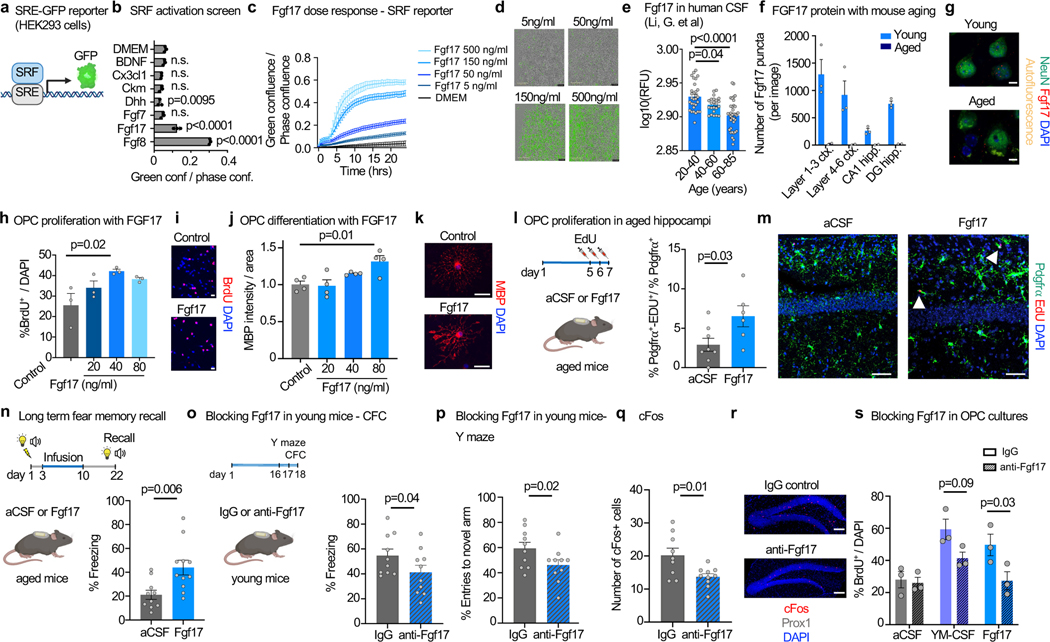
Recent understanding of how the systemic environment shapes the brain throughout life has led to numerous intervention strategies to slow brain ageing1-3. Cerebrospinal fluid (CSF) makes up the immediate environment of brain cells, providing them with nourishing compounds4,5. We discovered that infusing young CSF directly into aged brains improves memory function. Unbiased transcriptome analysis of the hippocampus identified oligodendrocytes to be most responsive to this rejuvenated CSF environment. We further showed that young CSF boosts oligodendrocyte progenitor cell (OPC) proliferation and differentiation in the aged hippocampus and in primary OPC cultures. Using SLAMseq to metabolically label nascent mRNA, we identified serum response factor (SRF), a transcription factor that drives actin cytoskeleton rearrangement, as a mediator of OPC proliferation following exposure to young CSF. With age, SRF expression decreases in hippocampal OPCs, and the pathway is induced by acute injection with young CSF. We screened for potential SRF activators in CSF and found that fibroblast growth factor 17 (Fgf17) infusion is sufficient to induce OPC proliferation and long-term memory consolidation in aged mice while Fgf17 blockade impairs cognition in young mice. These findings demonstrate the rejuvenating power of young CSF and identify Fgf17 as a key target to restore oligodendrocyte function in the ageing brain.


Conflict of interest statement

Competing interests: T.W.-C. and T.I. are co-inventors on a patent application related to the work published in this paper (STDU2-39617.101, S21-153 - METHODS AND COMPOSITIONS FOR IMPROVED MEMORY IN THE AGING). HZ has served at scientific advisory boards and/or as a consultant for Abbvie, Alector, Annexon, Artery Therapeutics, AZTherapies, CogRx, Denali, Eisai, Nervgen, Novo Nordisk, Pinteon Therapeutics, Red Abbey Labs, Passage Bio, Roche, Samumed, Siemens Healthineers, Triplet Therapeutics, and Wave, has given lectures in symposia sponsored by Cellectricon, Fujirebio, Alzecure, Biogen, and Roche, and is a co-founder of Brain Biomarker Solutions in Gothenburg AB (BBS), which is a part of the GU Ventures Incubator Program (outside submitted work).

Figures

Extended data Fig. 1.
Extended data Fig. 1.. Bulk RNAseq, infusion site details and overall overview of proliferating cells
a, Relative proportions of cell types as predicted by deconvolution analysis of bulk RNAseq of aged mice infused with aCSF or YM-CSF (aCSF n=8, YM-CSF n=7). b, Predicted number of DEGs per cell type by deconvolution analysis of bulk RNAseq of aged mice infused with aCSF or YM-CSF (aCSF n=8, YM-CSF n=7). c, Effect size of the subset of oligodendrocyte genes in Fig. 1d 16hrs following acute injection of YM-CSF or aged mouse CSF (AM-CSF) calculated over aCSF as control (n=4; Wilcoxon rank sum test). d, Location of infusion site. Image source: Allen Institute, Mouse brain atlas (coronal). e, Location of analysis site. Image source: Allen Institute, Mouse brain atlas (coronal). f, Hippocampal slice of 10-month-old mice given an EdU pulse prior to surgery showing low baseline proliferation, and three pulses of BrdU at day 5 and 6 of infusion showing an overall increase in proliferating cells following YM-CSF infusion (n=4 per group; repeated measures two-way ANOVA followed by Sidak’s post-hoc test; Means ± SEM). g, Representative images of EdU (red) and BrdU (green) cells in mice with no surgery or infused with aCSF or YM-CSF. Scale bar, 500μm. h, RNAscope of Pdgfrα+Edu+ cells in hippocampus of 2-month-old (young) and 19-month-old (aged) mice (n=3; two-sided t-test; mean ± s.e.m.). i, Representative images of analysis in panel h. Arrows pointing to Pdgfrα+Edu+ cells. Scale bar, 100μm.
Extended data Fig. 2.
Extended data Fig. 2.. Cortical Pdgfrα+EdU+ cells and identity of Pdgfrα- EDU+ cells
a, Hippocampal density of Pdgfrα+ EdU+ cells per mm2 (aCSF n=7, YM-CSF n=8; two-sided t-test; mean ± s.e.m.). b, Hippocampal density of Pdgfrα+ cells per mm2 (aCSF n=7, YM-CSF n=8; two-sided t-test; mean ± s.e.m.). c, Location of region of interest in the cortex. Scale bar, 100μm. d, Percentage of Pdgfrα+ EdU+ / Pdgfrα+ cells showing very low proliferation rates of OPCs in the cortex (n=6; two-sided t-test; mean ± s.e.m.). e, Cortical density of Pdgfrα+ EdU+ cells per mm2 (n=6; two-sided t-test; mean ± s.e.m.). f, Cortical density of Pdgfrα+ cells per mm2 (n=6; two-sided t-test; mean ± s.e.m.). g, Percentage of Pdgfrα+ EdU+ / EdU+ in the hippocampus of aged mice infused with YM-CSF (n=3). h, Example of IBA+ EdU+ cells in the hippocampus (n=3). Scale bar, 50μm. Insert, 10μm. i, Example of GFAP+ EdU+ cells in the hippocampus (n=3). Scale bar, 50μm. Insert, 10μm.
Extended data Fig. 3.
Extended data Fig. 3.. Young CSF increases number of myelinated axons in the molecular layer.
a, Representative overview of 1mm diameter biopsy punch in the hippocampus. b, Representative overview of molecular layer (MoL, between dashed lines) before and after TEM imaging of three 10×10 montage squares (n=7). c, Representative montage of MoL of aged mouse infused with aCSF and YM-CSF (n=7). Scale bar, 10 μm. d, Representative higher resolution image of aged mouse infused with aCSF and YM-CSF (n=7). Scale bar, 1μm. e, g-ratio analysis of myelinated axons in molecular layer. (n=3 mice per group, aCSF n=321 axons, YM-CSF n=291 axons).
Extended data Fig. 4.
Extended data Fig. 4.. Young CSF boosts OPC differentiation in vitro and validation of OPC culture purity.
a, Related to images in Fig 1o. Overview of MBP stain of OLs at day 4 of differentiation supplemented with 10% aCSF or YH-CSF (aCSF n=3 coverslips, YH-CSF n=2 coverslips). b, Quantification of MBP intensity of day 4 differentiated OLs. Scale bar, 200μm. (aCSF n=3 coverslips, YH-CSF n=2 coverslips; two-sided t-test; mean ± s.e.m). c, Primary rat OPC cultures were supplemented with 10% aCSF or YH-CSF for 6 hrs and stained for NG2 (green), Olig2 (grey) and Acta2 (red). (n=3 coverslips; Scale bar, 100 μm) d, Higher magnification of primary rat OPC cultures were supplemented with 10% aCSF or YH-CSF for 6 hrs and stained for NG2 (green), Olig2 (grey) and Acta2 (red). (n=3 coverslips; Scale bar, 20μm)
Extended data Fig. 5.
Extended data Fig. 5.. SLAMseq QC and principal component analysis.
a, Overall conversion rates in all SLAMseq samples, showing an enrichment for T>C mutation rate (orange bar) which increases with longer incubation time (6hr). b-c, Distribution of T>C mutations across b, read position and c, 3’UTR position indicating an equal distribution of s4U incorporation along the positive strand. d-e, UMAP of aCSF and YH-CSF samples in both time points by all genes detected in the d, total and e, nascent mRNA counts. (young CSF 1hr n=4, all the rest n=5). f, Gene set enrichment analysis (GSEA) of 6hr genes sorted by log2FC showing an enrichment for SRF target genes by TRANSFAC . g, Overall log2FC enrichment indicating upregulation of SRF target genes (TRANSFAC and curated list) and actin cytoskeleton genes in YH-CSF treated OPCs over aCSF. (SRF TRANSFAC (423 genes), validated SRF targets from literature (74 genes) and actin genes (212 genes); Wilcoxon rank sum test; box show the median and the 25–75th percentiles, and the whiskers indicate values up to 1.5-times the interquartile range).
Extended data Fig. 6.
Extended data Fig. 6.. YH-CSF induces actin cytoskeleton alterations in vitro.
a-b, Actin filament content measured by live imaging using SiR-actin (red) throughout 4hr of aCSF and YH-CSF exposure. Average SiR-actin a, intensity and b, area in rat OPC cultures exposed to aCSF or YH-CSF (n=6 wells per condition; Means ± SEM). c, Representative images of experiment quantified in panel a and b. Scale bar 200μm. d, OPC coverslips were treated with YH-CSF for 6 hrs and stained for phalloidin. Histogram of the percentage of OPC with the indicated number of growth cones per cell. YH-CSF treated cells show a shift towards more growth cones per cell (n=3 coverslips per condition, total of 200 cells analyzed per condition; two-way ANOVA followed by Sidak’s post-hoc test; Means ± SEM). Scale bar 20μm. e, mouse OPC primary cultures from SRF-fl/fl pups infected with CRE-GFP and △CRE-GFP AAVs to induce recombination. Representative images of infected cells (green) 48 hours after infection. Scale bar, 100μm. f, Normalized SRF mRNA levels as measured by RT-PCR (n=3 coverslips per condition; mean ± s.e.m.). g, Representative image of data presented in figure 2h. Scale bar, 20μm. h, Quantification of GFP+ cells per image in SRF-WT and SRF-KO cells treated with 10% aCSF or YH-CSF. (n=3; mean ± s.e.m.). i, Quantification of number of DAPI cells per image in SRF-WT and SRF-KO cells treated with 10% aCSF or YH-CSF. (n=3; mean ± s.e.m.). Data in panels a-i were replicated in two independent experiments.
Extended data Fig. 7.
Extended data Fig. 7.. Bulk RNAseq of hippocampal OPC and OL nuclei from young and aged mice.
a, Gating strategy for sorting of hippocampal OPC and OL nuclei. b, Heatmap of expression OPC and OL specific genes across young and aged OPC and OL samples (aged OL n=3, rest n=4). c, Volcano plot showing OL genes up and downregulated with age (n=4; p. adjusted value by Wald test in DESeq2). d, Pathways enriched (red) or depleted (blue) in hippocampal OLs with age (unweighted Kolmogorov-Smirnow test).
Extended data Fig. 8.
Extended data Fig. 8.. Bulk RNAseq of hippocampal OPC and OL nuclei from aged mice following acute injection and Srf levels in neurons.
a, Box plot of effect size of Srf targets (TRANSFAC database) in hippocampal OLs from aged vs. young, YM-CSF vs. aCSF at 1hr and 6hr timepoints (n=4; genes pre-filtered by p<0.05 cutoff; Wilcoxon rank sum test, box show the median and the 25–75th percentiles, and the whiskers indicate values up to 1.5-times the interquartile range). b, Pathways enriched (red) or depleted (blue) in hippocampal OPCs 1hr following injection of aCSF or YM-CSF (n=4; p. adjusted value by Wald test in DESeq2). c, Volcano plot showing OPC genes up and down regulated 1hr following CSF injection (n=4; p. adjusted value by Wald test in DESeq2). d, Volcano plot showing OPC genes up and down regulated 6hr following CSF injection (n=4; p. adjusted value by Wald test in DESeq2). e, Neuronal Srf intensity in CA1 in young and aged mice. (n=3; two-sided t-test; mean ± s.e.m) f, Representative image of panel e. Scale bar, 70μm. g, Neuronal Srf intensity in CA1 in aged mice following YM-CSF infusion. (n=4; two-sided t-test; mean ± s.e.m) h, Representative image of panel g. Scale bar, 70μm.
Extended data Fig. 9.
Extended data Fig. 9.. Fgf8 induces OPC proliferation and Fgf17 induces SRF reporter activation mediated by actin dynamics and Fgfr3.
a, Dose-dependent activation of SRE-GFP reporter by increasing concentrations of Fgf8 and representative images of the experiment at 15.5 hrs. Scale bar, 400μm. (n=3; similar control as in Fig. 4c; one-way ANOVA followed by Sidak’s post-hoc test; mean ± s.e.m.). b, Percentage of BRDU+/DAPI primary rat OPCs treated with 10, 20, 40 ng/ml Fgf8. (n=4; one-way ANOVA followed by Tukey’s post-hoc test; mean ± s.e.m.). c, Quantification of OPC proliferating cells (Pdgfrα+EDU+ / Pdgfrα+ cells) in the CA1 region of the hippocampus of 20-month-old mice following a week of aCSF or Fgf8 infusion. (aCSF n=8 similar control as in Fig. 4l, Fgf8 n=4; two-sided t-test; mean ± s.e.m.). d, SRE-GFP activation with 200 ng/ml Fgf17 following 30 min pre-treatment with Jasplakinolide (Jasp, 125 or 250nM) or Latrunculin A (LatA, 250 or 500nM). (n=3; Two-way ANOVA with Tukey’s multiple comparisons test; mean ± s.e.m.). e, SRE-GFP activation with 200 ng/ml Fgf17 following 30 min pre-treatment with blocking antibodies for FgfR1, FgfR2, FgfR3 (all 50 μg/ml) or FgfR3 alone (n=3; One-way ANOVA with Sidak’s multiple comparisons test; mean ± s.e.m.). f, Example of Pdgfr⍺+ Fgfr3+ cells in the hippocampus of young mice. (n=3). Scale bar, 5μm.
Extended data Fig. 10.
Extended data Fig. 10.. Fgf17 is predominantly expressed in the brain by a subset of neurons and is downregulated with age.
a, Fgf17 is predominantly expressed in the brain based on the human protein atlas. b, Fgf17 is expressed by cortical glutamatergic neurons in the young adult mouse (Allen brain atlas). c, Sub-clustering of mouse cortical layer 4/5 neurons indicates expression by a subset of cortical neurons (Allen brain atlas). d, Gene set enrichment analysis of genes mostly correlated with Fgf17 in layer 4/5 neurons (Allen brain atlas). e, Fgf17 is expressed by cortical glutamatergic and GABAergic neurons in the human cortex (Allen brain atlas). f, Representative image of analysis in panel g. Scale bar, 100μm. g, Fgf17 mRNA expression in cortical neurons drops dramatically in aged mice. (n=3; two-way student t-test; mean ± s.e.m.). h, Fgf17 protein expression in cortical and hippocampal neurons drops dramatically in aged mice. (n=3; mean ± s.e.m.). i, Representative images of analysis in panel h and Fig. 4f. Scale bar, 20μm.
Extended data Fig. 11.
Extended data Fig. 11.. Perfusion of labeled YH-CSF and mouse Fgf17 to the brain parenchyma and working model.
a, Deposition of labeled Fgf17 on ventricular walls 3 hours post ICV acute injection (n=3). Scale bar, 300μm. b, Deposition of labeled YH-CSF on lateral ventricle walls 2 hours post ICV acute injection (n=3). Scale bar, 100μm. c, Labeled Fgf17 in perivascular spaces in the molecular layer of the hippocampus (n=3). Scale bar, 50μm. d, Labeled YH-CSF in perivascular spaces in the molecular layer of the hippocampus (n=3). Scale bar, 20μm. e, YH-CSF in the perivascular space in between the vessel (green) and astrocyte endfeet (white; n=3). Scale bar, 20μm. f, Orthogonal slice of YH-CSF (magenta) in perivascular space, in between the vessel (green) and astrocyte endfeet (white; n=3). Scale bar, 20μm. g, Working model. OPC proliferation and differentiation (termed oligodendrogenesis) slow down with age . Re-exposure of the aged brain to young CSF or the brain-specific growth factor Fgf17 , boost hippocampal oligodendorgenesis, concomitant with improvement in long term memory recall.
Figure 1.
Figure 1.. Young CSF improves memory consolidation and promotes OPC proliferation and differentiation.
a, Overview of the experimental paradigm. b, Percentage of freezing of 20-month-old mice in the remote recall contextual fear conditioning test (aCSF n=10, YM-CSF n=8; two-sided t-test; mean ± s.e.m.). c, Gene set enrichment analysis of hippocampal bulk RNAseq identifies oligodendrocytes genes as highly upregulated following 6 days of YM-CSF infusion. d, Effect size of oligodendrocyte genes in YM-CSF vs. aCSF hippocampus compared to all genes in the dataset (asterisk indicates FDR<0.1) (aCSF n=8, YM-CSF n=7). e, Quantification of OPC proliferating cells in the hippocampus following a week of aCSF or YM-CSF infusion to 20-month-old mice (aCSF n=7, YM-CSF n=8; two-sided t-test; mean ± s.e.m.). f, Representative images of e. Arrowheads pointing at proliferating OPCs. Scale bar, 20μm. inserts 5μm. g, As in e but for YH-CSF and AH-CSF (n=5; two-sided t-test; mean ± s.e.m.). h, Representative images of g. Scale bar, 50μm. i, Hippocampal MBP stain following the long-term paradigm of aCSF or YM-CSF infusion (n=8; two-sided t-test; mean ± s.e.m.). j, Representative images of i. Scale bar, 50μm. k, Quantification of number of myelinated axons per μm2 in the hippocampus of aged mice following the long-term paradigm of aCSF or YM-CSF infusion (n=7; one-sided t-test; mean ± s.e.m.). l, Ratio of percentage of BrdU+/DAPI primary rat OPCs treated with indicated % YHCSF over matching aCSF as control (n=3; one-way ANOVA followed by Tukey’s post-hoc test; mean ± s.e.m.). m, Representative images of l. Scale bar, 50μm. n, Stacked bar plot of average number of cells in each differentiation state at day 4 of differentiation with 10% aCSF or 10% YH-CSF (aCSF n=281 cells analyzed in 3 coverslips, YH-CSF n=454 cells analyzed in 2 coverslips). o, Representative images of n. Scale bar, 20μm. See Supplementary videos S1-2.
Figure 2.
Figure 2.. SRF is induced by young CSF and mediates CSF-induced OPC proliferation.
a, Volcano plot of DEGs at 1hr following YH-CSF addition (SRF targets marked in red) (YH-CSF 1hr n=4, rest n=5; p. adjusted value by Wald test in DESeq2; mean ± s.e.m). b, Normalized expression levels of SRF in nascent mRNA counts and total counts (YH-CSF 1hr n=4, rest n=5; Two-way ANOVA Sidak’s post-hoc test (nascent and total reads separately)). c, Volcano plot of DEGs at 6hr following YH-CSF addition (SRF targets marked in red). (n=5; p. adjusted value by Wald test in DESeq2; mean ± s.e.m). d, Representative images of e. Scale bar, 20μm. e, Mean phalloidin intensity in OPCs 6hr following YH-CSF exposure. (n=3 coverslips per condition; two-sided t-test; mean ± s.e.m.). f, Representative images of g. Scale bar, 10μm. g, Mean phalloidin intensity in hippocampal OPCs (Pdgfrα+ following aCSF or YM-CSF infusion for 6 days. (n=3 mice per group, total of 33–42 single cells measured per condition; two-sided t-test; mean ± s.e.m.). h, Schematic of mouse OPC primary cultures from SRF-fl/fl pups infected with CRE-GFP and △CRE-GFP AAVs to induce recombination. i, Percentage of proliferating cells (BRDU+/GFP+ cells) in SRF-WT and SRF-KO cells treated with 10% aCSF or YH-CSF (n=3; two-way ANOVA followed by Sidak’s post-hoc test; mean ± s.e.m.).
Figure 3.
Figure 3.. SRF signaling is downregulated in hippocampal OPCs with ageing and induced by acute young CSF injection.
a, Srf mRNA quantified in OPC (Pdgfrα+ nuclei) in the CA1 region of the hippocampus of young (3 months) and aged (22 months) mice. (young n=6, aged n=7; two-sided t-test; mean ± s.e.m.). b, Representative images of a. Scale bar, 10μm and 5μm in insert. c, Volcano plot of DEGs of aged vs. young hippocampal OPC nuclei. Dashed line represents p.adj=0.05 (n=4). d, Pathways enriched (red) or depleted (blue) in hippocampal OPCs with age. Resource categories; # CellMarker; ## Wikipathways; ### GO BP (n=4, unweighted Kolmogorov-Smirnow test). e, Box plot of effect size of Srf targets (TRANSFAC database) in hippocampal OPCs from aged vs. young, YM-CSF vs. aCSF at 1hr and 6hr timepoints (n=4; genes pre-filtered by p<0.05 cutoff; Wilcoxon rank sum test; box show the median and the 25–75th percentiles, and the whiskers indicate values up to 1.5-times the interquartile range). f, Pathways enriched (red) or depleted (blue) in hippocampal OPCs following 6 hrs of aCSF or YM-CSF injection (n=4). Resource categories; # KEGG; ## GP MF (unweighted Kolmogorov-Smirnow test). g, Meta-analysis of log2FC of SRF target genes (TRANSFAC) in human AD vs. control and mouse aged vs. young ageing datasets (genes pre-filtered by p<0.05 cutoff; box show the median and the 25–75th percentiles, and the whiskers indicate values up to 1.5-times the interquartile range).
Figure 4.
Figure 4.. Fgf17 induces OPC proliferation and improves memory.
a, Diagram of SRE-GFP reporter in HEK293 cells. b, SRE-GFP activation by CSF ligands (500 ng/ml; n=3; One-way ANOVA with Dunnett’s multiple comparisons test; mean ± s.e.m.). c, Dose-dependent activation of SRE-GFP reporter by Fgf17 (n=3; one-way ANOVA with Tukey’s post-hoc test; mean ± s.e.m.). d, Representative images of c. Scale bar, 400μm. e, Meta-analysis of Fgf17 levels in healthy human CSF . (ages 20–40 n=30, ages 40–60 n=23, ages 60–85 n=36; One-way ANOVA with Dunnett’s post-hoc test; mean ± s.e.m.) f, Number of Fgf17 protein puncta in the cortex and hippocampus of young (3 months) and aged (25 months) mice. (young n=3, aged n=2; mean ± s.e.m.) g, Representative image of f. Scale bar, 5μm. h, Percentage proliferating OPCs treated with Fgf17 under proliferation conditions (n=3; one-way ANOVA with Tukey’s post-hoc test; mean ± s.e.m.). i, Representative images of h. Scale bar, 20μm. j, MBP intensity per area in OPCs treated with Fgf17 under differentiation conditions (day 3) (n=4; one-way ANOVA with Tukey’s post-hoc test; mean ± s.e.m.). k, Representative images of h. Scale bar, 20μm. l, Quantification of OPC proliferating cells in the hippocampus of 20-month-old mice following a week of aCSF or Fgf17 infusion. (aCSF n=8, Fgf17 n=6; two-sided t-test; mean ± s.e.m.). m, Representative images of l. Scale bar, 50μm. n, Percentage of freezing of 20-month-old mice in the remote recall contextual fear conditioning test (aCSF n=10, Fgf17 n=11; two-sided t-test; mean ± s.e.m.). o, Percentage of freezing of 3-month-old mice in the short-term contextual fear conditioning test (n=10; one-sided t-test; mean ± s.e.m.). p, Percentage of entries to the novel arm of the forced alternation Y maze (n=10; one-sided t-test; mean ± s.e.m.). q, Average number of active cFos+ cells in the DG (IgG n=9, anti-Fgf17 n=10; two-sided t-test; mean ± s.e.m.). r, Representative image of q. Scale bar, 100μm. s, Percentage proliferating OPCs treated with aCSF, YH-CSF or Fgf17 in combination with IgG or anti-Fgf17 antibodies (n=3; two-way ANOVA with Sidak’s post-hoc test; mean ± s.e.m.).

Comment in

References

Main text references

    1. Pluvinage JV & Wyss-Coray T. Systemic factors as mediators of brain homeostasis, ageing and neurodegeneration. Nat Rev Neurosci 21, 93–102, doi: 10.1038/s41583-019-0255-9 (2020). - DOI - PubMed
    1. Castellano JM et al. Human umbilical cord plasma proteins revitalize hippocampal function in aged mice. Nature 544, 488–492, doi: 10.1038/nature22067 (2017). - DOI - PMC - PubMed
    1. Villeda SA et al. Young blood reverses age-related impairments in cognitive function and synaptic plasticity in mice. Nat Med 20, 659–663, doi: 10.1038/nm.3569 (2014). - DOI - PMC - PubMed
    1. Lehtinen MK et al. The cerebrospinal fluid provides a proliferative niche for neural progenitor cells. Neuron 69, 893–905, doi: 10.1016/j.neuron.2011.01.023 (2011). - DOI - PMC - PubMed
    1. Silva-Vargas V, Maldonado-Soto AR, Mizrak D, Codega P. & Doetsch F. Age-Dependent Niche Signals from the Choroid Plexus Regulate Adult Neural Stem Cells. Cell Stem Cell 19, 643–652, doi: 10.1016/j.stem.2016.06.013 (2016). - DOI - PubMed

Methods references

    1. De Miguel Z. et al. Exercise plasma boosts memory and dampens brain inflammation via clusterin. Nature 600, 494–499, doi: 10.1038/s41586-021-04183-x (2021). - DOI - PMC - PubMed
    1. Liu L. & Duff K. A technique for serial collection of cerebrospinal fluid from the cisterna magna in mouse. J Vis Exp, doi: 10.3791/960 (2008). - DOI - PMC - PubMed
    1. Smith A, Wu AH, Lynch KL, Ko N. & Grenache DG Multi-wavelength spectrophotometric analysis for detection of xanthochromia in cerebrospinal fluid and accuracy for the diagnosis of subarachnoid hemorrhage. Clin Chim Acta 424, 231–236, doi: 10.1016/j.cca.2013.06.017 (2013). - DOI - PubMed
    1. Olsson M, Arlig J, Hedner J, Blennow K. & Zetterberg H. Sleep deprivation and cerebrospinal fluid biomarkers for Alzheimer’s disease. Sleep 41, doi: 10.1093/sleep/zsy025 (2018). - DOI - PubMed
    1. Olsson M, Arlig J, Hedner J, Blennow K. & Zetterberg H. Sleep deprivation and plasma biomarkers for Alzheimer’s disease. Sleep Med 57, 92–93, doi: 10.1016/j.sleep.2018.12.029 (2019). - DOI - PubMed

Substances