. 2022 May;605(7911):728-735.
doi: 10.1038/s41586-022-04718-w. Epub 2022 May 11.

Extricating human tumour immune alterations from tissue inflammation

Affiliations

Extricating human tumour immune alterations from tissue inflammation

Florian Mair et al. Nature. 2022 May.

Abstract

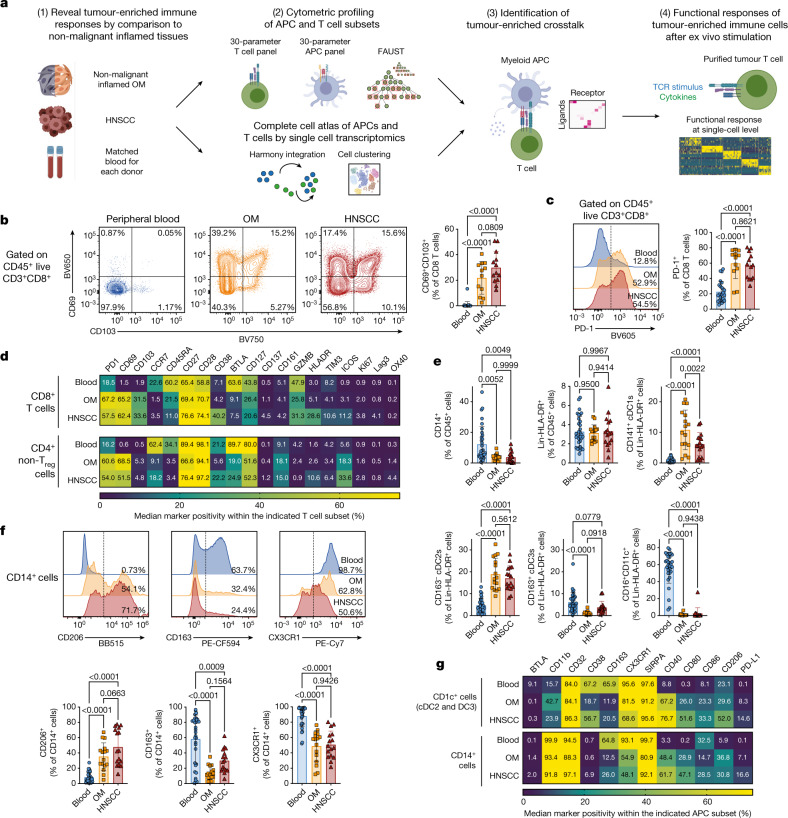
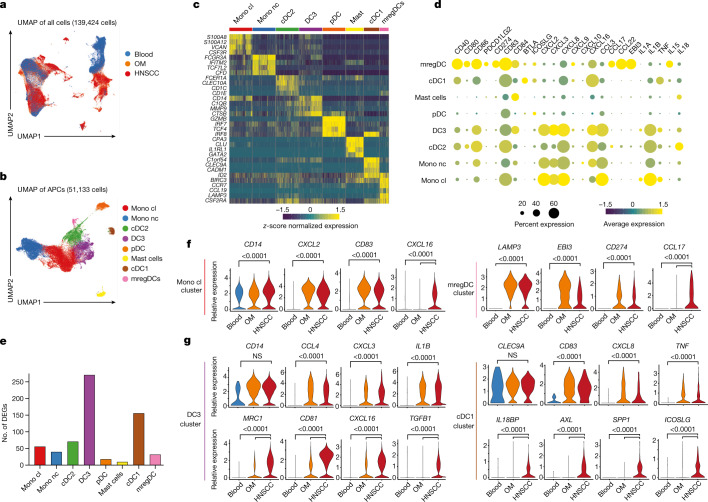
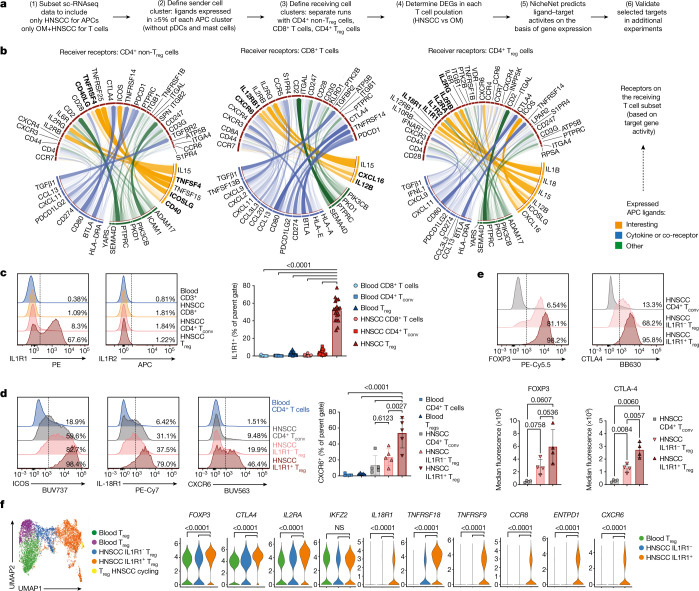
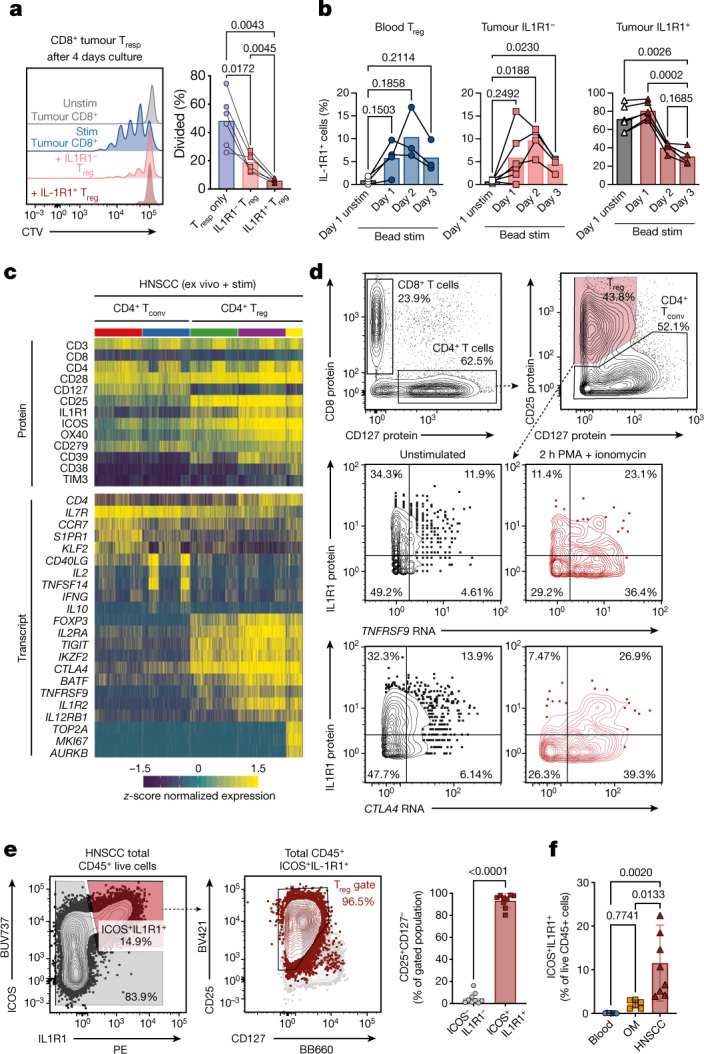
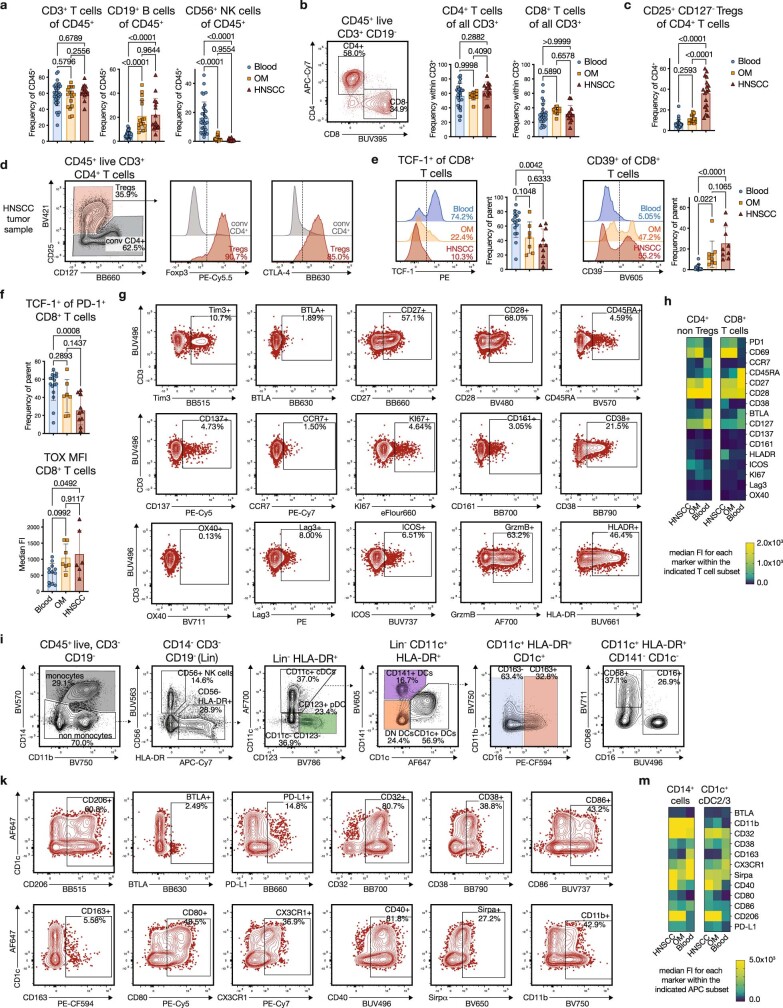
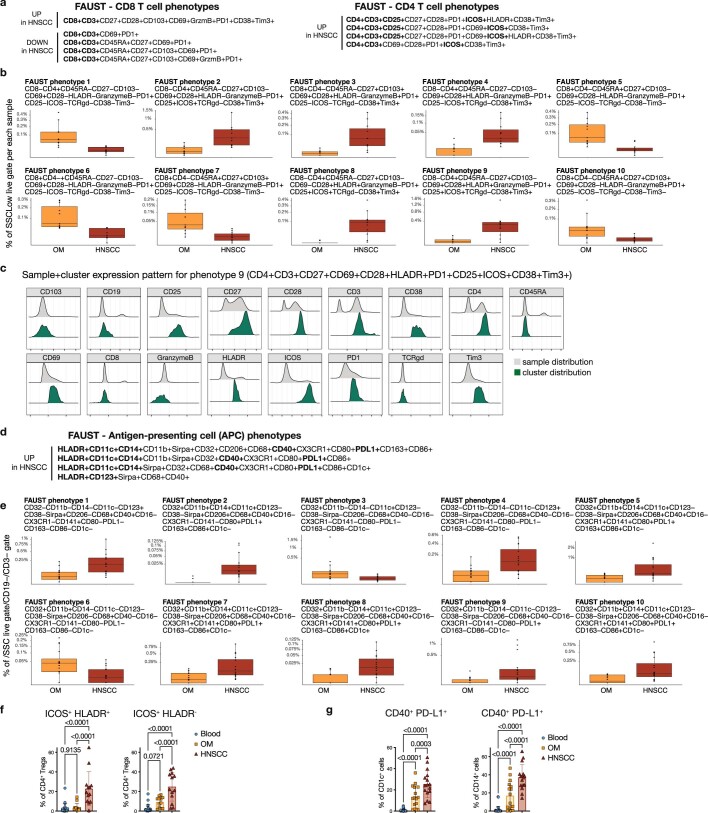
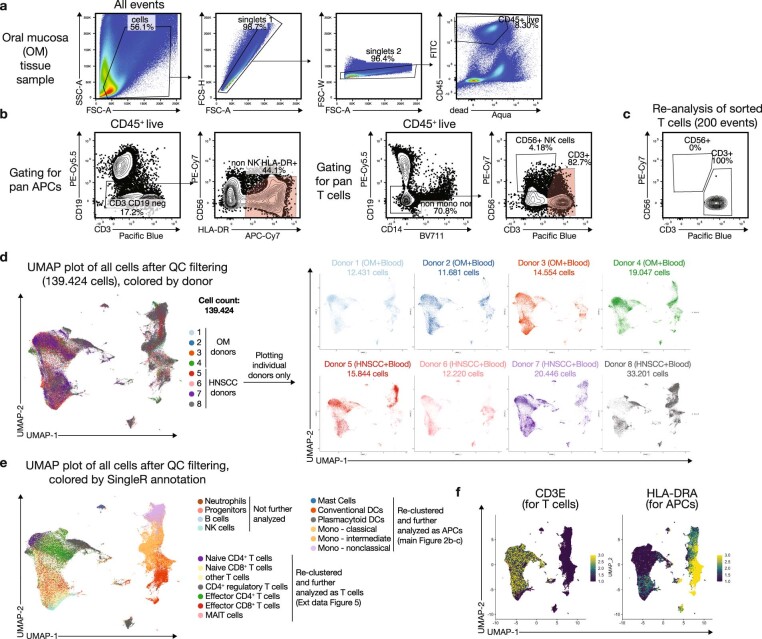
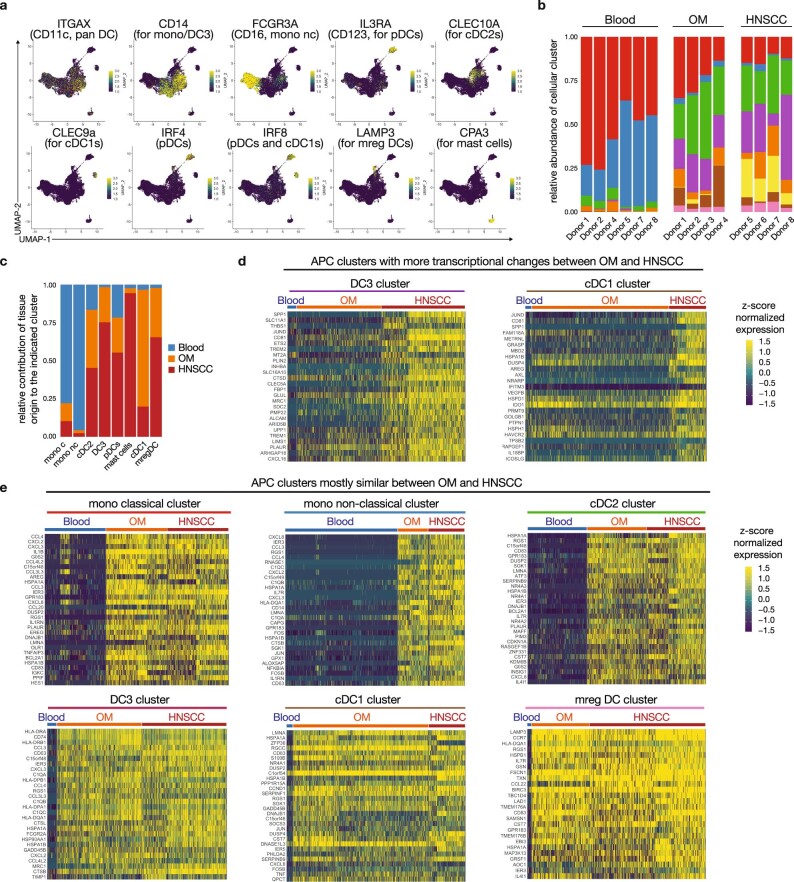
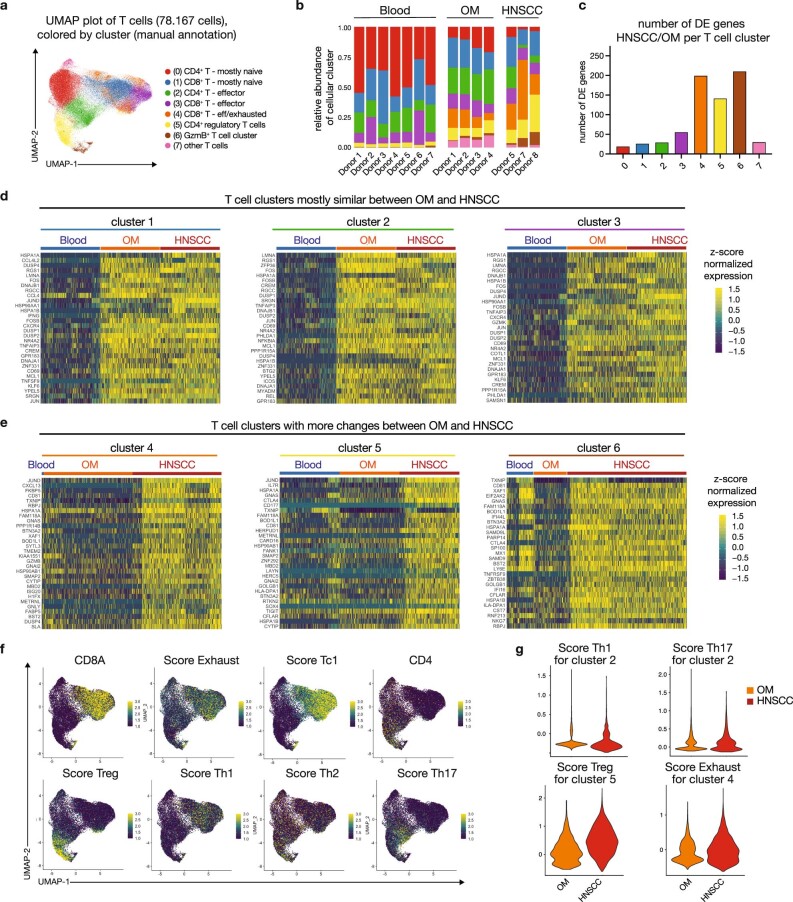
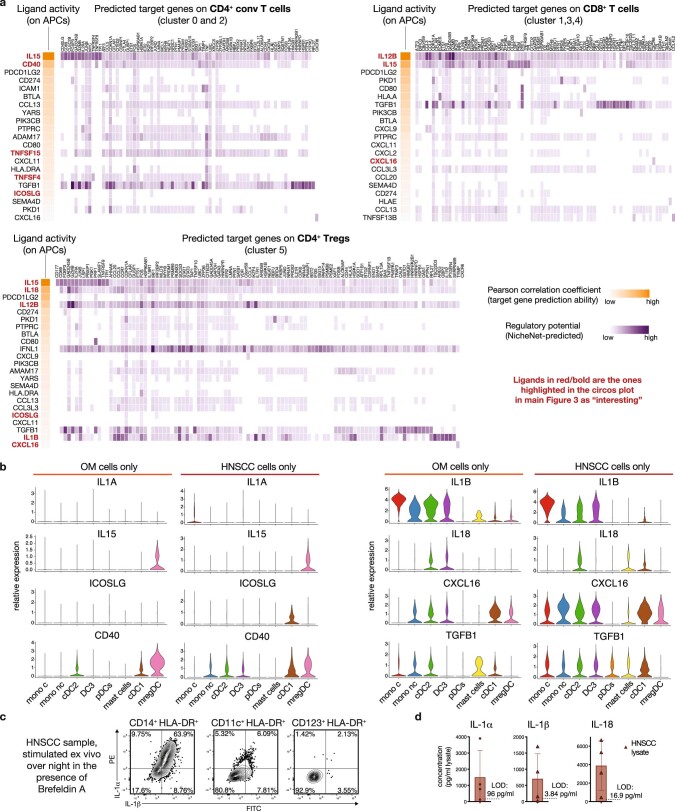
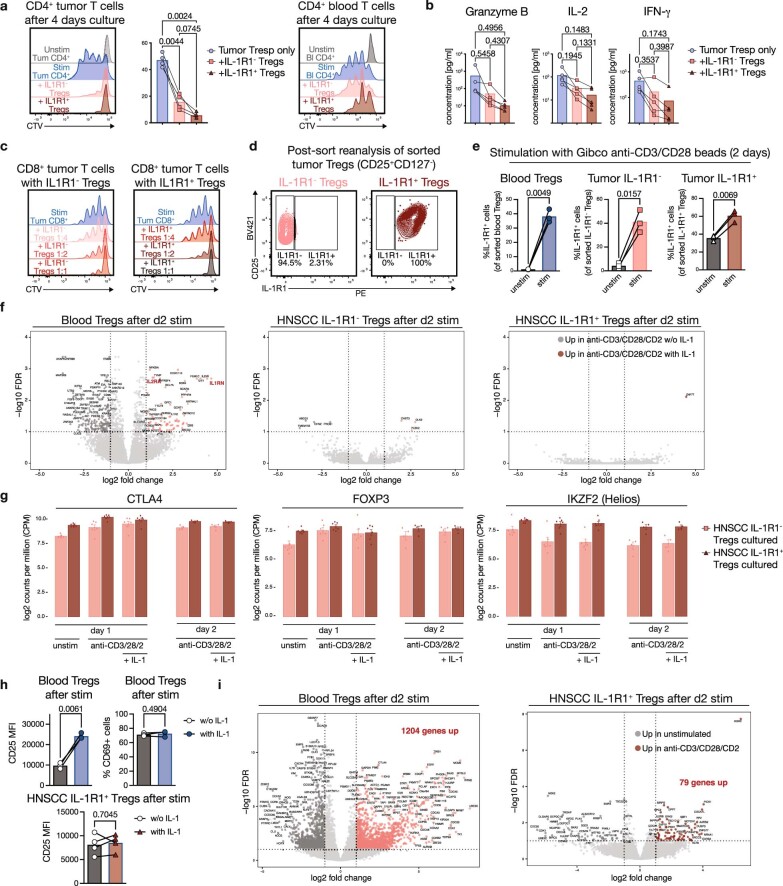
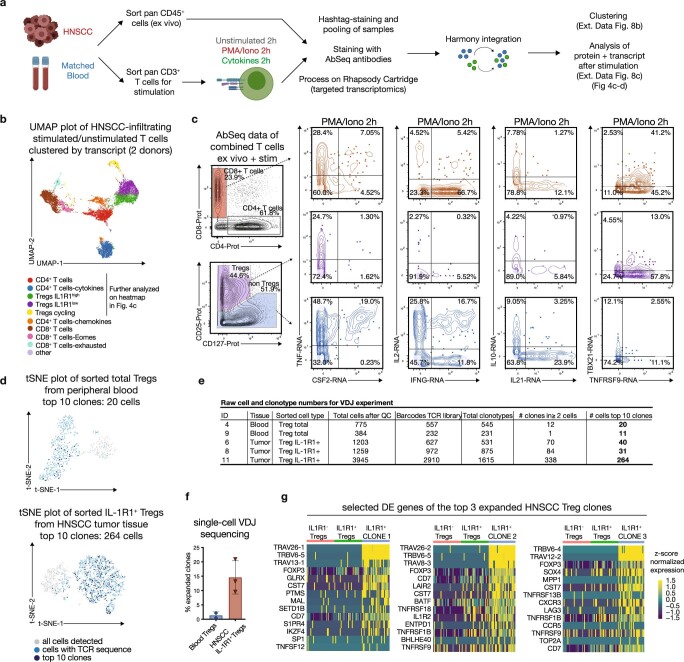
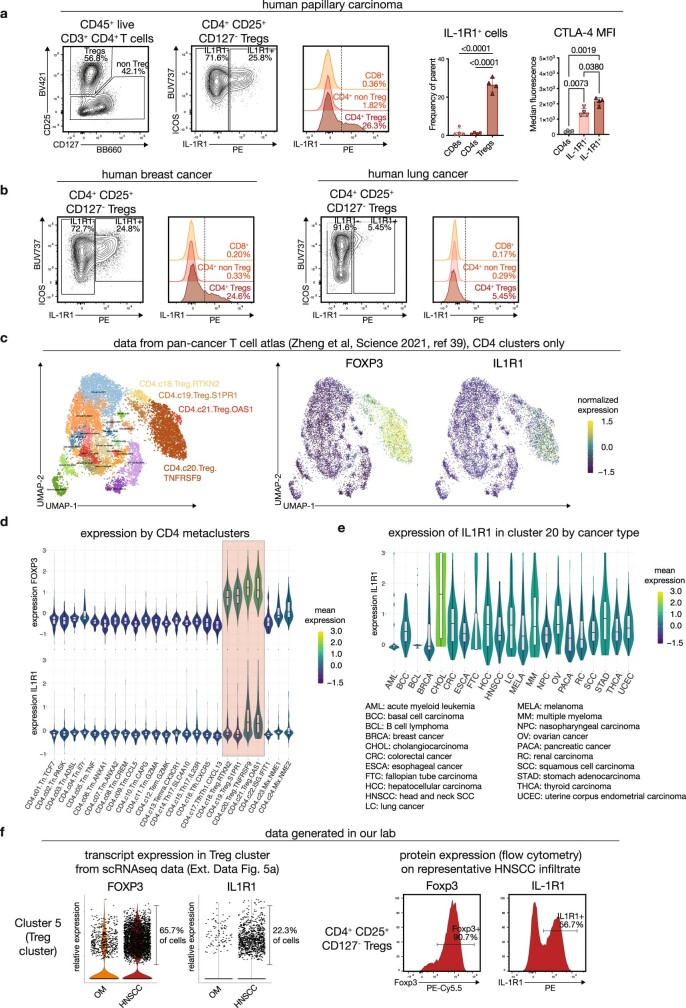
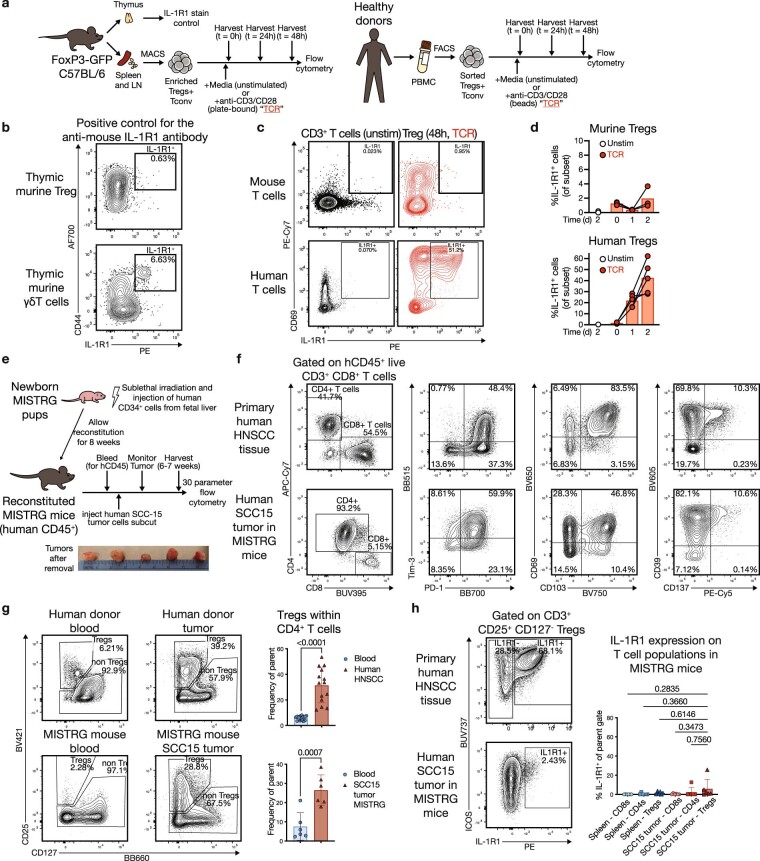
Immunotherapies have achieved remarkable successes in the treatment of cancer, but major challenges remain1,2. An inherent weakness of current treatment approaches is that therapeutically targeted pathways are not restricted to tumours, but are also found in other tissue microenvironments, complicating treatment3,4. Despite great efforts to define inflammatory processes in the tumour microenvironment, the understanding of tumour-unique immune alterations is limited by a knowledge gap regarding the immune cell populations in inflamed human tissues. Here, in an effort to identify such tumour-enriched immune alterations, we used complementary single-cell analysis approaches to interrogate the immune infiltrate in human head and neck squamous cell carcinomas and site-matched non-malignant, inflamed tissues. Our analysis revealed a large overlap in the composition and phenotype of immune cells in tumour and inflamed tissues. Computational analysis identified tumour-enriched immune cell interactions, one of which yields a large population of regulatory T (Treg) cells that is highly enriched in the tumour and uniquely identified among all haematopoietically-derived cells in blood and tissue by co-expression of ICOS and IL-1 receptor type 1 (IL1R1). We provide evidence that these intratumoural IL1R1+ Treg cells had responded to antigen recently and demonstrate that they are clonally expanded with superior suppressive function compared with IL1R1- Treg cells. In addition to identifying extensive immunological congruence between inflamed tissues and tumours as well as tumour-specific changes with direct disease relevance, our work also provides a blueprint for extricating disease-specific changes from general inflammation-associated patterns.


Conflict of interest statement

Part of the single-cell sequencing experiments was supported with reagents received from BD Biosciences and Illumina. BD Biosciences and Illumina were not involved in data analysis and interpretation. R.G. has received speaker fees from Illumina and Fluidigm and support from Juno Therapeutics and Janssen Pharma, has consulted for Takeda Vaccines, Juno Therapeutics and Infotech Soft, and has ownership interest in Modulus Therapeutics. E.G. and R.G. declare ownership interest in Ozette Technologies. F.M., J.R.E. and M.P. hold the related patent Specific Targeting of Tumor-infiltrating regulatory T cells (Tregs) using ICOS and IL-1R1 (US patent no. 63/092957).

Figures

Fig. 1
Fig. 1. Similar immune phenotypes in inflamed non-malignant OM tissues and HNSCC.
a, Overview of experimental strategy. b, Representative plots and quantification for CD69 and CD103 on CD8+ T cells from peripheral blood (blue), OM (orange) and HNSCC (red). c, Representative plots and quantification for PD-1 expression on CD8+ T cells. d, Heat map showing the expression pattern for all the indicated molecules within CD8+ T cells (top) and CD4+ helper T cells (without CD25+CD127 Treg cells, bottom) across peripheral blood, OM and HNSCC. e, Quantification of the indicated antigen-presenting cell (APC) populations. f, Representative histograms and quantification for CD206, CD163 and CX3CR1 on CD14+ cells. g, Heat map representing the expression pattern for all the indicated molecules within CD1c+ cDC2s and cDC3s (top) and CD14+ cells (bottom). All summary graphs are represented as mean ± s.d. (n = 12 for OM and n = 13 for HNSCC samples for T cell data, n = 16 for OM and HNSCC for APC data). Statistical analyses were performed using one-way ANOVA with Tukey’s multiple comparisons test.
Fig. 2
Fig. 2. Comprehensive scRNA-seq analysis of OM and HNSCC immune infiltrates.
a, UMAP of the combined scRNA-seq data after quality filtering and Harmony integration, coloured by tissue origin (more details in Extended Data Fig. 3). b, UMAP plot of the APC populations after subsetting and reclustering, coloured by cluster. Mono cl, classical monocyte; Mono nc, non-classical monocyte. c, Key DEGs in each APC cluster. d, Scaled dot plot showing the transcript expression across APC clusters from combined OM and HNSCC data (excluding blood). e, Number of DEGs between HNSCC and OM-derived cells per APC cluster as determined by MAST. f, Violin plots showing the expression of selected transcripts for the monocyte cluster (left) and the mregDC cluster (right). g, Violin plots showing the expression of selected transcripts for the DC3 cluster (left) and the cDC1 cluster (right). All graphs are showing combined data for n = 4 for OM samples and n = 4 for HNSCC samples, with a total of 139,424 cells after filtering for quality control criteria. Violin plots show adjusted P-values (Bonferroni correction) as calculated by the Seurat implementation of MAST.
Fig. 3
Fig. 3. NicheNet analysis predicts tumour-enriched APC-T cell crosstalk.
a, The NicheNet workflow was applied to the scRNA-seq data shown in Fig. 2. b, Circos plots showing the top ligand–receptor pairs identified by NicheNet. Transparency of the connection represents the interaction strength. APC ligands are on the bottom, TCRs are on top. c, Representative plots and quantification for the surface protein expression of IL1R1 (n = 19). d, Representative plots showing the expression of ICOS, IL-18R1 and the chemokine receptor CXCR6 on the indicated T cell subsets. Right, quantification for CXCR6 (n = 5). e, Representative plots (top) and mean fluorescence intensity (bottom) for FOXP3 and CTLA4 on T cell subsets from HNSCC (n = 4). f, UMAP plot of Treg cells sorted from blood and tumour of n = 3 donors with HNSCC after targeted transcriptomics, coloured by cluster. Violin plots show the expression of selected transcripts across Treg clusters. All summary graphs are represented as mean ± s.d. Statistical analyses of cytometry data was performed using one-way ANOVA with Tukey’s multiple comparisons test, analysis of targeted transcriptomics used the Seurat implementation of MAST (adjusted P-values after Bonferroni correction).
Fig. 4
Fig. 4. IL1R1-expressing Treg cells represent a functionally distinct population.
a, Proliferation of HNSCC-derived CD8+ T responder (Tresp) cells (n = 6) in an in vitro suppression assay with IL1R1 Treg cells (light red) and IL1R1+ Treg cells (dark red). Representative histograms show dilution of Cell Trace Violet. Stim, stimulated; unstim, unstimulated. b, Expression kinetics of IL1R1 after in vitro culture in the presence of anti-CD3/CD28/CD2 beads for Treg cells sorted from peripheral blood (left, n = 3), IL1R1 Treg cells (middle, n = 4) and IL1R1+ Treg cells (right, n = 5) from HNSCC. c, Tumour-infiltrating T cells from two donors with HNSCC after performing short-term stimulation and targeted transcriptomics with AbSeq (Extended Data Fig. 8). Heat maps show top differentially expressed proteins (top) and transcripts (bottom) across the selected clusters. d, TNFRSF9 and CTLA4 transcript expression by Treg cells left unstimulated (left) and after short-term stimulation with PMA and ionomcyin (right). The y-axis shows IL1R1 protein expression. e, Representative plots and quantification (n = 9) showing that within total CD45+ cells in HNSCC nearly all ICOS+ IL1R1+ cells are Treg cells. f, Quantification of total ICOS+ IL1R1+ cells in peripheral blood (n = 7), OM (n = 6) and HNSCC samples (n = 8). All summary graphs are represented as mean ± s.d. Statistical analyses were performed using one-way ANOVA with Tukey’s multiple comparisons test or using a two-tailed paired t-test (e).
Extended Data Fig. 1
Extended Data Fig. 1. Additional immune subset quantifications and representative flow cytometry data (related to main Figure 1).
(a) Quantification of CD3+ T cells, CD19+ B cells and CD56+ NK cells across the different tissue sources (blue: peripheral blood, orange: OM, red: HNSCC). (b) Frequency of CD4+ and CD8+ T cells within the CD3+ T cell compartment. (c) Quantification of CD4+ CD25+ CD127- regulatory T cells (Tregs) in the different tissue samples. (d) Intranuclear staining for Foxp3 and CTLA-4 on a representative HNSCC sample to confirm that CD25+ CD127- cells are bonafide Foxp3+ Tregs (red histograms: CD4+ CD25+ CD127- cells, grey histograms: CD4+ CD25- CD127+/- cells). (e) Representative histograms and quantification for the expression for TCF-1 (left, n = 7 for OM and n = 10 for HNSCC) and CD39 (right, n = 9) on CD8+ T cells. (f) Quantification for TCF-1 specifically on PD-1+ CD8+ T cells (left) and for the MFI of the transcription factor TOX on CD8+ T cells (right). (n = 7 for OM and n = 6 for HNSCC) (g) Staining patterns for phenotyping markers in the high-dimensional T cell panel, pregated on live CD3+ CD8+ T cells (HNSCC). Positivity cut-offs were the same for all samples, except where shifts in staining patterns based on density distributions indicated the need for adjustments. GrzmB staining showed donor-specific shifts, and Tim3 was impacted by autofluorescence in some donors. (h) Heatmap showing the median fluorescence intensities (MFI) for all the indicated molecules within CD8+ cytotoxic T cells (right) and CD4+ conv T cells (without CD25+ CD127- Tregs, left) across peripheral blood, OM, and HNSCC. This heatmap matches main Figure 1d, but shows MFIs instead of percentages. (i) Representative gating strategy for the identification of canonical antigen-presenting cell (APC) subsets in HNSCC. Plots are concatenated from three individual donors. (k) Staining patterns for all phenotyping markers in the high-dimensional APC panel shown on a representative HNSCC sample, pregated on live CD11c+ HLA-DR+ conventional DCs. Positivity cut-offs were left the same for all samples, except where shifts in staining patterns based on density distributions indicated adjustments. PD-L2 (on BV421) and CD85k (BV480) were excluded from all analyses because of significant variability due to autofluorescence between donors/experimental runs (data not shown). (m) Heatmap showing the median fluorescence intensities (MFI) for all the listed molecules within CD1c+ cDC2s/DC3s (right) and CD14+ cells (left). This heatmap matches main Figure 1g, but shows MFIs instead of percentages. Statistical analyses were performed using one-way ANOVA with Tukey’s multiple comparisons.
Extended Data Fig. 2
Extended Data Fig. 2. Computational analysis using FAUST for the T cell and APC panels (related to main Figure 1).
(a) and (b) The top 10 T cell phenotypes showing differential abundance between OM (orange) and HNSCC (red) samples as identified by FAUST (FDR-adjusted level below 0.05). Population frequency is relative to the CD45+ live gate. Negative markers are not listed, all phenotypes are CD3+. (c) Example ridge plots of the marker distribution for T cell phenotype #9 (CD4+ CD3+ CD27+ CD69+ CD28+ HLADR+ PD1+ CD25+ ICOS+ CD38+ Tim3+) from a representative HNSCC sample. Grey histogram denotes marker distribution across all cells, green on the selected FAUST cluster. (d) and (e) A selection from the top 20 myeloid APC phenotypes showing differential abundance between OM (orange) and HNSCC (red) samples as identified by FAUST (FDR-adjusted level below 0.05). Population frequency is relative to the CD45+ live CD3- CD19- gate. Negative markers are not listed. (f) Simplifying the FAUST discovered Treg phenotype to just two markers, HLA-DR and ICOS. Summary plots show the relative frequency of ICOS+ HLADR+ cells (left) and ICOS+HLADR- cells (right) in the CD4+ CD25+ CD127- Treg compartment across blood, OM and HNSCC (n = 13). (g) Simplifying the FAUST discovered APC phenotype to just two markers, CD40 and PD-L1. Summary plots show the relative frequency of CD40+ PD-L1+ cells on CD1c+ DCs (left) and CD14+ cells (right) in blood, OM and HNSCC (n = 16). For the FAUST box plots, the lower bound of the box is the 25th percentile (q25), center is the median, upper bound is the 75th percentile (q75). The lower whisker is 1.5*interquartile below the q25, and the upper whisker is 1.5*interquartile above q75. Y-axis is shown on a square-root scale. Statistical analyses in (f) and (g) were performed using one-way ANOVA with Tukey’s multiple comparisons, and summary graphs are represented as mean ± SD.
Extended Data Fig. 3
Extended Data Fig. 3. Gating strategy for the sorts and additional plots for the scRNA-seq data (related to main Figure 2).
(a) General gating of a representative OM tissue samples for CD45+ live singlets for the WTA 10x scRNA-seq experiments. (b) Gating strategy used for sorting the pan APC population and for pan T cells for WTA 10x scRNA-seq experiments. Red shaded gates were sorted. For some experiments (data not shown) MR1-Tetramer+ MAIT cells and CD56+ NK cells were sorted separately. (c) Representative re-analysis of a fraction of sorted pan T cells before loading onto the 10x Chromium controller. (d) UMAP plots of the combined scRNA-seq data after QC filtering (see Github script) and Harmony integration, colored by donor. A total of 139.424 cells is shown. Right plots depict individual donors separately, showing that cells from each donor distribute across the entire plot. Of note, for some donors only the T cell or the APC population could be sorted. (e) UMAP plots of the combined scRNA-seq data after QC filtering and Harmony integration, colored by simplified cell type calling derived from SingleR. The populations indicated in the legend were used for re-clustering and more in-depth analysis of the APC population (main Figure 2b) and T cells (Extended Data Fig. 5), respectively. (f) UMAP plots show heatmap overlays for CD3E and HLA-DRA transcripts to highlight the main lineages.
Extended Data Fig. 4
Extended Data Fig. 4. Additional analyses of the scRNA-seq data for the APC populations (related to main Figure 2).
(a) Heatmap overlays for the expression of key lineage transcripts on the UMAP plot for the APC population (see main Figure 2b). (b) Relative abundance of the APC clusters across donors and tissue origin. (c) Relative contribution of each tissue source to the indicated APC cluster (colors match the cluster description in main Fig. 2b). (d) Heatmaps showing the top 30 transcripts that were differentially expressed in HNSCC for the DC3 cluster (left) and cDC1 cluster (right), which are the two clusters showing the largest number of DE genes between OM and HNSCC (see main Figure 2e). (e) Heatmaps showing the top 30 transcripts that were shared between OM and HNSCC, but differentially expressed from matched peripheral blood, for each of the indicated APC clusters (mono classical, mono non-classical, cDC2s, DC3s, cDC1s and mreg DCs). For (d) and (e), the APC clusters identified in the scRNA-seq data (main Figure 2b) were subsetted, and either the genes shared between OM and HNSCC cells, or genes differentially expressed between HNSCC and OM cells were identified by the Seurat implementation of MAST (see material and methods and Github script for additional details).
Extended Data Fig. 5
Extended Data Fig. 5. Additional analyses of the scRNA-seq data for T cell populations (related to main Figure 2).
(a) UMAP plot of the T cell populations after subsetting and reclustering, colored by cluster. (b) Relative cluster abundance across donors and tissue origin (color code is the same as in panel a) (c) Number of DE genes between HNSCC and OM-derived cells per T cell cluster as determined by MAST. (d) Heatmaps showing the top 30 transcripts that were shared between OM and HNSCC, but differentially expressed from matched peripheral blood, for each of the indicated T cell clusters. (e) Heatmaps showing the top 30 transcripts that were differentially expressed in HNSCC for the T cell clusters 4–6, which were the two clusters showing the largest number of DE genes between OM and HNSCC. (f) Heatmap overlays showing the indicated lineage transcripts and T cell scores (see material and methods) on the UMAP plot. (g) Violin plots depicting the relative T cell score in the indicated HNSCC (red) vs OM-derived (orange) T cell clusters.
Extended Data Fig. 6
Extended Data Fig. 6. Additional plots related to the NicheNet predictions (related to main Figure 3).
(a) Plots derived from the NicheNet analysis showing the predicted ligand activity (orange) for the top ligands (as ranked by Pearson correlation coefficient), and the predicted target genes (purple) for all three separate NicheNet runs: sender APCs + receiver cells CD4+ conv T cell clusters (upper left plots), sender APCs + receiver CD8+ T cell clusters (upper right plots) and sender APCs + receiver CD4+ Treg cluster (lower plots). The full script utilized for the NicheNet analysis is available on Github (see material and methods). The ligands that are highlighted in main Figure 3b as “interesting” are highlighted in red/bold in this panel here. (b) The APC clusters from main Figure 2b were subsetted to contain only OM or HNSCC-derived cells, and Violin plots depict relative expression of the indicated ligand transcripts across all APC clusters either in OM-infiltrating cells (left columns) or HNSCC infiltrating cells (right columns). The ligands here match the ones highlighted as “interesting” in main Figure 3b. (c) Representative plots showing the protein expression for the cytokines IL-1α and IL-1β after ex vivo culture of bulk HNSCC-derived APCs in the presence of Brefeldin A, followed by intracellular cytokine staining. (d) Concentration of IL-1α and IL-1β and IL-18 as measured by Luminex analysis in flash-frozen HNSCC samples (n = 4). LOD: limit of detection.
Extended Data Fig. 7
Extended Data Fig. 7. Additional data from Treg suppression and stimulation assays (related to main Figure 4).
(a) Proliferation of HNSCC-derived CD4+ T responder cells from tumor (left) or from blood (right) in an in vitro suppression assay with IL-1R1- Tregs (light red) and IL-1R1+ Tregs (dark red) from tumor. Representative histograms show dilution of Cell Trace Violet (CTV) after 4 days. n = 4. (b) Concentration of Granzyme B, IL-2 and IFN-g in the culture supernatants of the 4-day suppression assays shown in main Figure 4a. (c) Proliferation of HNSCC-derived CD8+ T responder cells in an in vitro suppression assay with titrated amounts of IL-1R1- Tregs (left plot) and IL-1R1+ Tregs (right plot). Histograms show CTV dilution after 4 days of culture with Treg-to-Teff ratios of 1:4, 1:2 and 1:1 (top to bottom). (d) Plots depict representative post-sort purity of HNSCC-Treg populations used for the stimulation experiments in main Figure 4b. (e) Expression of IL-1R1 after two days of in vitro culture either unstimulated or in the presence of Gibco anti-CD3/CD28 beads for Tregs sorted from peripheral blood (blue), IL-1R1- (light red) and IL-1R1+ Tregs (dark red) from HNSCC. n = 3. (f) Volcano plots showing differential gene expression of SMART-Seq bulk RNAseq data (250 sorted cells) of blood Tregs, HNSCC IL-1R1- and IL-1R1+ after 2 days of culture with anti-CD3/CD28/CD2 beads with (light and dark red) or without IL-1 (grey). (g) Transcripts per million for FOXP3, Helios (IKZF2) and CTLA4 from the bulk RNAseq data for the indicated time points and culture conditions. n = 4 for the d2 time point, n = 6 for the d1 time point. (h) CD25 median fluorescence intensity (MFI) on the indicated Treg populations after 2 days of culture with anti-CD3/CD28/CD2 beads +/− IL-1. n = 3 for blood and n = 4 for the HNSCC samples. (i) Volcano plots showing differential gene expression of SMART-Seq bulk RNAseq data (250 sorted cells) of blood Tregs and HNSCC IL-1R1+ Tregs after 2 days either unstimulated or with anti-CD3/CD28/CD2 beads. Number of DE genes upregulated is highlighted in bold.
Extended Data Fig. 8
Extended Data Fig. 8. Additional analyses for the VDJ and targeted transcriptomics/Abseq data (related to main Figure 4).
(a) Experimental outline for the targeted transcriptomics+AbSeq experiments (see also material and methods). Combined data set after Harmony integration consists of ex vivo CD45+ cells, unstimulated T cells, and PMA-Ionomycin stimulated T cells from two different donors. (b) UMAP plot of tumor-infiltrating T cells of two different HNSCC donors after targeted transcriptomics and AbSeq as described in (a), colored by clustering based on transcript. The highlighted clusters are shown in more detail in main Figure 4c. (c) Selected cytokine transcripts are shown on manually gated T cell subsets from HNSCC AbSeq data (populations as identified by surface protein). Red plots show CD8+ T cells, violet plots show CD25+ CD127- Tregs, and blue plots show CD25- CD4+ non Tregs (all after PMA/Iono for 2h). TBX21 encodes for T-bet, TNFRSF9 encodes for CD137 (4-1BB). (d) t-SNE plot of sorted Tregs from the peripheral blood (top) and tumor (bottom) from a single donor after VDJ sequencing (10x genomics 5’ v1 chemistry). All cells with a complete TCR sequence are marked in light blue, and the top 10 clonotypes are marked in dark blue (encompassing 20 cells in the blood, and 239 cells in the tumor). (e) Table showing the total cell counts, barcode counts and detected clonotypes after VDJ sequencing for the indicated samples (n = 3 for the HNSCC tumor samples, n = 2 for matched peripheral blood). Counts are derived from VDJ Loupe browser. (f) Expanded clones by single-cell VDJ sequencing within sorted IL-1R1+ Tregs from HNSCC tumors relative to total Tregs from matched peripheral blood. Every TCR sequence that was present in 2 cells or more was considered an expanded clone. (n = 2 for blood, n = 3 for HNSCC) (g) Differentially expressed (DE) genes for the top 3 expanded clones from one single donor. Heatmaps show a selection of the top DE genes as identified by MAST for each clone (right side of each heatmap) vs downsampled HNSCC IL1R1- Tregs and IL1R1+ Tregs.
Extended Data Fig. 9
Extended Data Fig. 9. IL-1R1 expression in other cancer types (related to main Figure 4).
(a) IL-1R1 expression is present on CD4+ CD25+ CD127- Tregs in tumor tissues from a cohort of human papillary carcinoma patients. Plot on the very right shows quantification of the MFI for CTLA-4 on the indicated populations (n = 4 donors, one-way ANOVA with Tukey’s multiple comparisons). (b) To assess IL-1R1 protein expression in additional tumor types, we were able to collect a single sample of human breast cancer (left) and human lung cancer (right). IL-1R1 expression is present on breast cancer Tregs, but only at very low level/absent on lung cancer Tregs. (c) UMAP plot of all CD4 T cell metaclusters. There are four Treg clusters, which are highlighted on the right side of the UMAP plot. Heatmap overlays on the right side show expression of the transcripts encoding FOXP3 and IL1R1. (d) Violin plots depicting expression of FOXP3 (top panel) and IL1R1 (lower panel) across all CD4 T cell clusters of the combined data set as annotated by Zheng et al. Shaded area highlights the Treg clusters. IL1R1 expression is primarily found in cluster 20 and 21. (e) Violin plots depicting expression of IL1R1 in cells from cluster 20 CD4.c20.Treg.TNFRSF9) across different tumor types. While expression appears to be absent in AML and BCL, varying levels of IL1R1 transcript are present across all other tumor types. (f) IL1R1 transcript expression in scRNA-seq data may underestimate protein expression. Left panel shows violin plots for expression of the indicated transcripts in the Treg cluster 5 of our combined scRNAseq data from OM and HNSCC (see Extended Data Fig. 5a), right histograms show protein expression for the same genes by flow cytometry on live CD4+ CD25+ CD127- Tregs on a representative HNSCC sample. Data in panels c-e are publicly available from the pan-cancer T cell atlas (containing 21 cancer types), Zheng et al, Science 2021 (ref. ). Figures were generated using the Shiny app on http://cancer-pku.cn:3838/PanC_T. Per the authors’ description, box plot overlays show 25th percentile (lower bound), median (center) and 75th percentile (upper bound), whiskers extend +/− 1.5*interquartile range. Data in panel a-b and f are from our own tissue collections.
Extended Data Fig. 10
Extended Data Fig. 10. Differential expression kinetics of IL-1R1 in human cells, murine cells and a humanized mouse model.
(a) Overview of stimulation experiments for murine (left) and human (right) purified Treg populations. (b) Murine thymic γδ T cells (lower plot) were used as a positive control to validate the anti-mouse IL-1R1-PE antibody signal. (c) Representative plots depicting IL-1R1 and CD69 expression on unstimulated (black) and TCR stimulated (red) Tregs after 48 h. (d) Quantification of IL-1R1 expression after stimulation for 1 or 2 days in murine (top panel, n = 3) and human Tregs (bottom panel, n = 5), highlighting the discrepancy in expression level and kinetics. (e) Overview and timeline of human SCC15-tumor experiment in humanized MISTRG mice. Bottom, photograph of 5 tumors after collection. (f) Representative flow cytometry plots showing similar expression patterns for a set of key T cell markers in primary human HNSCC biopsies (top) and SCC15 tumors in MISTRG mice reconstituted with human immune cells (bottom). (g) Representative plots and quantification showing a similar increase in Treg frequencies between human blood/HNSCC tumor tissue (top) and humanized mouse blood/SCC15 tumor tissue (bottom). n = 6 for the humanized mouse samples, and n = 14 for the human HNSCC samples. (h) Representative plots and quantification showing that IL-1R1 expression is detectable, but under-represented in the humanized mouse model (n = 5) compared to primary human HNSCC tissue (see main Figure 3c). Error bars represent mean +/- SD. Statistical analyses were performed using one-way ANOVA with Tukey’s multiple comparisons test for (h) or using a two-tailed paired t-test for (g).

Comment in

References

    1. Chen DS, Mellman I. Oncology meets immunology: the cancer-immunity cycle. Immunity. 2013;39:1–10. doi: 10.1016/j.immuni.2013.07.012. - DOI - PubMed
    1. Martins F, et al. Adverse effects of immune-checkpoint inhibitors: epidemiology, management and surveillance. Nat. Rev. Clin. Oncol. 2019;16:563–580. doi: 10.1038/s41571-019-0218-0. - DOI - PubMed
    1. Greten FR, Grivennikov SI. Inflammation and cancer: triggers, mechanisms, and consequences. Immunity. 2019;51:27–41. doi: 10.1016/j.immuni.2019.06.025. - DOI - PMC - PubMed
    1. Mujal AM, Krummel MF. Immunity as a continuum of archetypes. Science. 2019;364:28–29. doi: 10.1126/science.aau8694. - DOI - PubMed
    1. Fan X, Rudensky AY. Hallmarks of tissue-resident lymphocytes. Cell. 2016;164:1198–1211. doi: 10.1016/j.cell.2016.02.048. - DOI - PMC - PubMed

Publication types