. 2022 Jun;606(7912):172-179.
doi: 10.1038/s41586-022-04696-z. Epub 2022 May 11.

Fundamental immune-oncogenicity trade-offs define driver mutation fitness

Affiliations

Fundamental immune-oncogenicity trade-offs define driver mutation fitness

David Hoyos et al. Nature. 2022 Jun.

Erratum in

  • Author Correction: Fundamental immune-oncogenicity trade-offs define driver mutation fitness.
    Hoyos D, Zappasodi R, Schulze I, Sethna Z, de Andrade KC, Bajorin DF, Bandlamudi C, Callahan MK, Funt SA, Hadrup SR, Holm JS, Rosenberg JE, Shah SP, Vázquez-García I, Weigelt B, Wu M, Zamarin D, Campitelli LF, Osborne EJ, Klinger M, Robins HS, Khincha PP, Savage SA, Balachandran VP, Wolchok JD, Hellmann MD, Merghoub T, Levine AJ, Łuksza M, Greenbaum BD. Hoyos D, et al. Nature. 2022 Jun;606(7914):E5. doi: 10.1038/s41586-022-04879-8. Nature. 2022. PMID: 35641605 Free PMC article. No abstract available.

Abstract

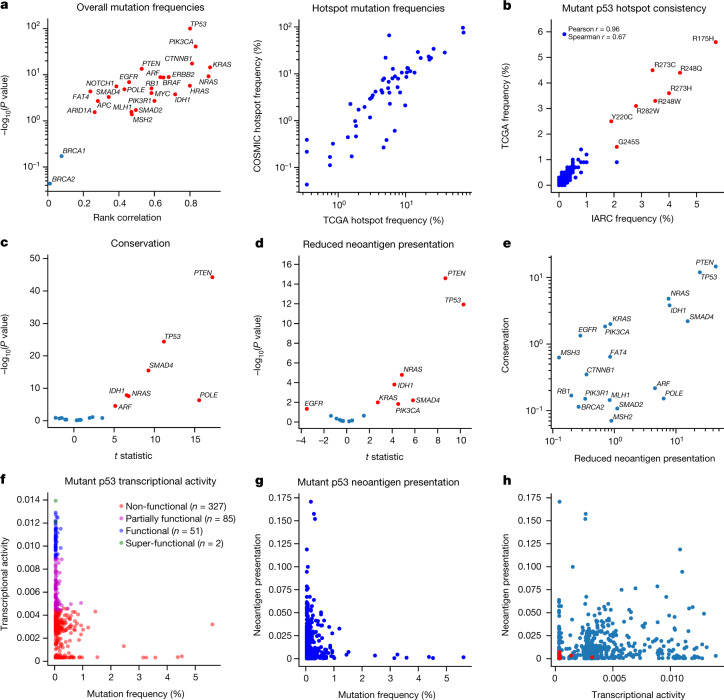
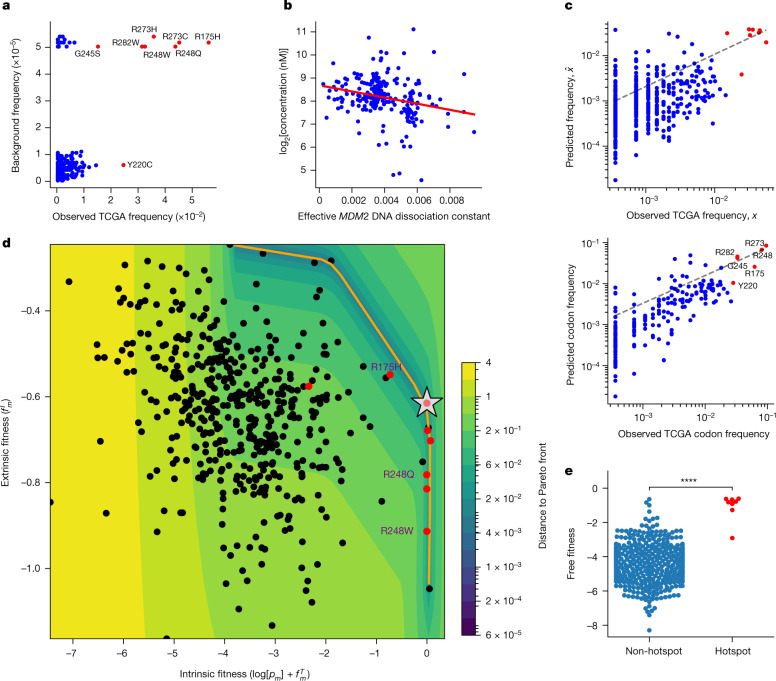
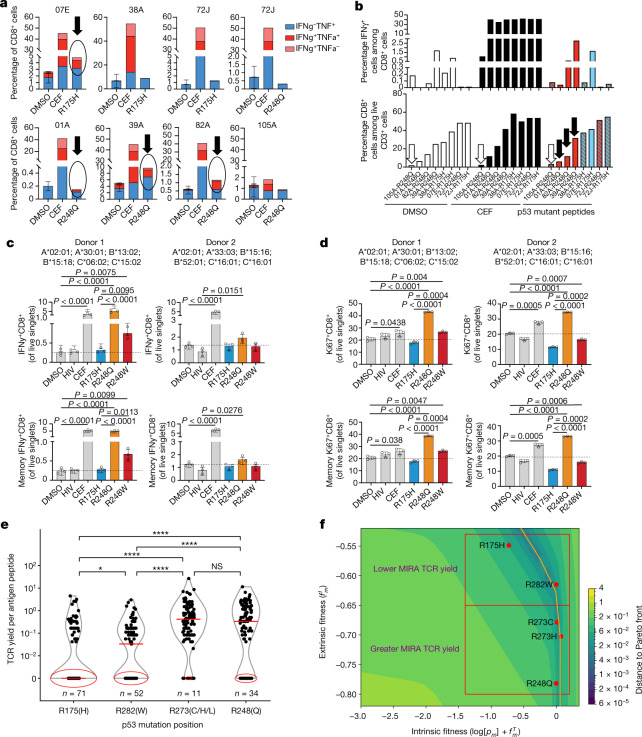
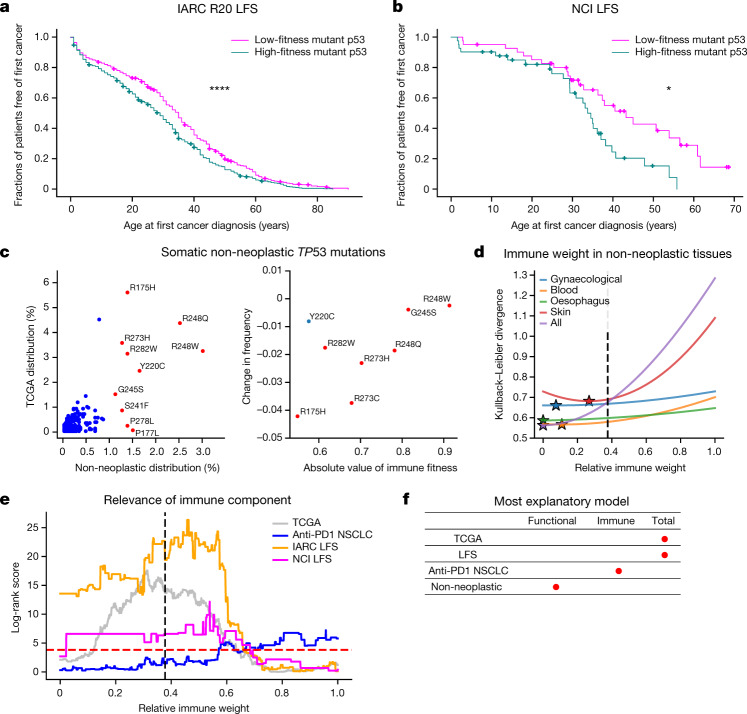
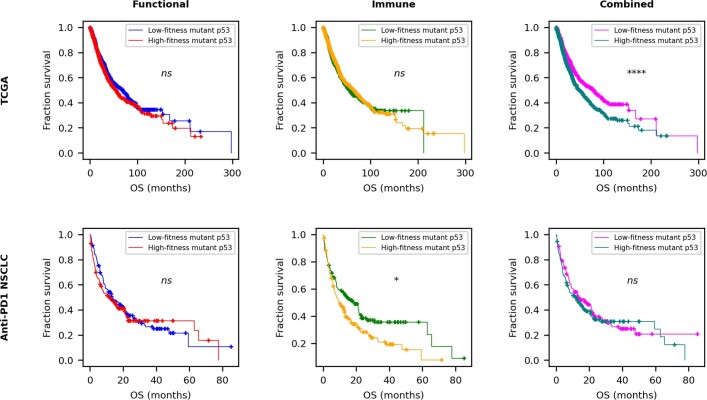
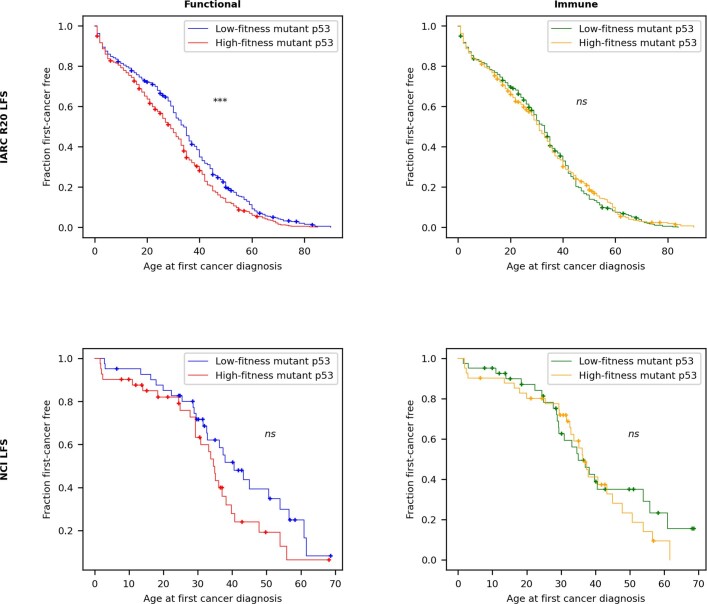
Missense driver mutations in cancer are concentrated in a few hotspots1. Various mechanisms have been proposed to explain this skew, including biased mutational processes2, phenotypic differences3-6 and immunoediting of neoantigens7,8; however, to our knowledge, no existing model weighs the relative contribution of these features to tumour evolution. We propose a unified theoretical 'free fitness' framework that parsimoniously integrates multimodal genomic, epigenetic, transcriptomic and proteomic data into a biophysical model of the rate-limiting processes underlying the fitness advantage conferred on cancer cells by driver gene mutations. Focusing on TP53, the most mutated gene in cancer1, we present an inference of mutant p53 concentration and demonstrate that TP53 hotspot mutations optimally solve an evolutionary trade-off between oncogenic potential and neoantigen immunogenicity. Our model anticipates patient survival in The Cancer Genome Atlas and patients with lung cancer treated with immunotherapy as well as the age of tumour onset in germline carriers of TP53 variants. The predicted differential immunogenicity between hotspot mutations was validated experimentally in patients with cancer and in a unique large dataset of healthy individuals. Our data indicate that immune selective pressure on TP53 mutations has a smaller role in non-cancerous lesions than in tumours, suggesting that targeted immunotherapy may offer an early prophylactic opportunity for the former. Determining the relative contribution of immunogenicity and oncogenic function to the selective advantage of hotspot mutations thus has important implications for both precision immunotherapies and our understanding of tumour evolution.


Conflict of interest statement

D.F.B. is a consultant for Bristol Myers Squibb, Merck, Genentech–Roche, AstraZeneca and Pfizer and has received research support from Merck, Genentech–Roche, AstraZeneca, Novartis and Bristol Myers Squibb. M.K.C. has received consulting fees for Bristol Meyers Squibb, Merck, Incyte, Moderna, Immunocore and AstraZeneca and research funding from Bristol Meyers Squibb. L.F.C., E.J.O., M.K. and H.S.R. are employees of Adaptive Biotechnologies. S.A.F. has received research support from AstraZeneca and Genentech–Roche; is a consultant and advisory board member for Merck; and owns stock in UroGen, Allogene Therapeutics, Neogene Therapeutics, Kronos Bio and IconOVir. B.D.G. has received honoraria for speaking engagements from Merck, Bristol Meyers Squibb and Chugai Pharmaceutical; has received research funding from Bristol Meyers Squibb; has been a compensated consultant for PMV Pharma, DarwinHealth and ROME Therapeutics; and is a cofounder of ROME Therapeutics. M.D.H. reports personal fees from Achilles, Adagene, Adicet, Arcus, AstraZeneca, Blueprint, Bristol Myers Squib, Da Volterra, Eli Lilly, Genentech–Roche, Genzyme–Sanofi, Janssen, Immunai, Instil Bio, Mana Therapeutics, Merck, Mirati, Natera, PACT Pharma, Shattuck Labs and Regeneron and has equity options with Factorial, Immunai, Shattuck Labs and Arcus. M.D.H. also reports that a patent filed by Memorial Sloan Kettering related to the use of tumour mutational burden to predict response to immunotherapy (PCT/US2015/062208) is pending and licensed by Personal Genome Diagnostics and that, subsequent to completing this work, he became an employee of AstraZeneca. A.J.L. is a founder, director and shareholder of PMV Pharma and is the chair of the Janssen scientific advisory board. T.M. is a cofounder and holds equity in Imvaq Therapeutics; is a consultant for ImmunOs Therapeutics, Im AQ19 munoGenesis and Pfizer; has received research support from Bristol Myers Squibb, Surface Oncology, Kyn Therapeutics, Infinity Pharmaceuticals, Peregrine Pharmaceuticals, Adaptive Biotechnologies, Leap Therapeutics and Aprea; and has patent applications related to work on oncolytic viral therapy, alpha virus-based vaccines, neoantigen modelling, CD40, GITR, OX40, PD-1 and CTLA-4. I.S. is an inventor on a patent application related to work on CD40. J.E.R. has received consulting fees and trial funding from Bayer, Seagen, AstraZeneca, Roche, Astellas Pharma and QED Therapeutics; consulting fees from Bristol Myers Squibb, Merck, Pfizer, Pharmacyclics, Boehringer Ingelheim, GlaxoSmithKline, Infinity, Janssen, Mirati, EMD Serono, Gilead, BioClin, Eli Lilly and Company, Tyra Biosciences and Pharmacyclics; honoraria for continuing medical education from Research to Practice, MJH Life Sciences, Medscape, Clinical Care Options, OncLive and EMD Serono; royalties from UpToDate. B.W. reports ad hoc membership of the scientific advisory board of Repare Therapeutics, outside the submitted work. J.D.W. is a consultant for Adaptive Biotechnologies, Amgen, Apricity, Ascentage Pharma, ArsenalBio, Astellas, AstraZeneca, Bayer, BeiGene, Boehringer Ingelheim, Bristol Myers Squibb, Celgene, Chugai, Eli Lilly, Elucida, F-Star, Georgiamune, Imvaq, Kyowa Kirin, Linneaus, Merck, Neon Therapeutics, Polynoma, PsiOxus, Recepta, Takara Bio, Trieza, Truvax, SELLAS, Serametrix, Surface Oncology, Syndax, Syntalogic and Werewolf Therapeutics; receives grant and research support from Bristol Myers Squibb and Sephora; and has equity in Tizona Pharmaceuticals, Adaptive Biotechnologies, Imvaq, BeiGene, Linneaus, Apricity, ArsenalBio and Georgiamune. R.Z. is an inventor on patent applications related to work on GITR, PD-1 and CTLA-4; is a scientific advisory board member of iTEOS Therapeutics; has consulted for Leap Therapeutics; and receives grant support from AstraZeneca and Bristol Myers Squibb. D.Z. is a consultant for Merck, Agenus, Hookipa Biotech, AstraZeneca, Western Oncolytics, Synthekine, MANA Therapeutics, Xencor, Memgen and Takeda; receives grant and research support from AstraZeneca, Roche and Plexxikon; holds stock options with ImmunOs Therapeutics, Calidi Biotherapeutics and Accurius; and has a patent related to use of Newcastle disease virus for cancer therapy with royalties paid by Merck.

Figures

Fig. 1
Fig. 1. Driver gene hotspots are highly conserved and have relatively poor neoantigen presentation.
a, Left, rank correlation between shared mutation frequencies in TCGA and the Catalogue of Somatic Mutations in Cancer (COSMIC) database for commonly mutated tumour suppressors and oncogenes plotted against the −log10-transformed rank correlation P value. Points corresponding to P < 0.05 are coloured red. Right, correlation of individual hotspot mutation frequencies in TCGA and the COSMIC database, excluding TCGA samples (Pearson r = 0.860, P < 0.0001; Spearman r = 0.851, P < 0.0001). b, Comparison of TP53 mutation distributions in the TCGA (n = 2,764) and IARC (n = 21,170) databases (Pearson r = 0.963, P < 0.0001; Spearman r = 0.672, P < 0.0001; labelled hotspots coloured in red). c, Comparison of conservation in hotspots and other mutations in the same gene (Welch’s t-test P value, P < 0.05 annotated in red). d, Comparison of reduced neoantigen presentation between hotspots and other mutations in the same gene (Welch’s t-test P value, P < 0.05 annotated in red). e, −log10P values from c and d plotted against each other. f, Mutant p53 transcriptional activity defined as the median of the inferred association constant for transcription factor affinity across eight transcriptional targets (WAF1, MDM2, BAX, h1433s, AIP1, GADD45, NOXA and P53R2) plotted against the frequency of TP53 mutations in TCGA (Pearson r = −0.204, P < 0.0001; Spearman r = −0.404, P < 0.0001). g, Neoantigen presentation defined as effective mutant peptide affinity versus mutation frequency in TCGA (Pearson r = −0.079, P = 0.088; Spearman r = −0.053, P = 0.256; hotspots coloured in red). h, Mutant p53 transcriptional activity plotted against neoantigen presentation shows weak dependence between the two features (Pearson r = 0.073, P = 0.117; Spearman r = 0.144, P = 0.002; hotspots coloured in red).
Fig. 2
Fig. 2. Mutant p53 fitness model quantifies the trade-off between oncogenicity and immunogenicity.
a, Model with only background intrinsic mutational frequencies (Kullback–Leibler divergence, 1.222; Pearson r = 0.324, P < 0.0001; Spearman r = 0.2, P < 0.0001; hotspots coloured in red). b, Relationship between mutant p53 concentration (log2 transformed) and the predicted effective p53 association constant for the MDM2 promoter across TCGA (n = 219; Pearson r = −0.25, P < 0.001; Spearman r = −0.29, P < 0.0001). c, Correlation of predicted TP53 mutation frequencies to observed frequencies on a per-mutation basis (top; Kullback–Leibler divergence, 0.599; Pearson r = 0.671, P < 0.0001; Spearman r = 0.39, P < 0.0001) and per-protein position basis (bottom; Kullback–Leibler divergence, 0.337; Pearson r = 0.794, P < 0.0001; Spearman r = 0.782, P < 0.0001). d, Sum of the log-transformed background frequency log[pm] and positive functional fitness fmT, denoted intrinsic fitness, plotted against negative immune fitness (fmI, extrinsic fitness) (Pearson r = −0.31, P < 0.0001; Spearman r = −0.33, P < 0.0001). The orange line corresponds to the Pareto front; the silver star indicates optimal free fitness constrained by the Pareto front; and the heat map corresponds to the distance to the Pareto front. The hotspot mutations are coloured red and the R175H and R248Q/W mutations are shown. e, Comparison of the free fitness distributions of non-hotspot and hotspot mutations (P < 0.0001, Welch’s t-test).
Fig. 3
Fig. 3. Validation of differential reactivity to mutant p53 neoepitopes in healthy donors and patients with cancer.
a, b, PBMCs from patients with R175H and/or R248Q p53-mutant tumours were cultured with the indicated p53 neopeptides or with CEF or DMSO as positive and negative controls, respectively. a, Flow cytometry quantification of cells expressing IFNγ ± TNFα among CD8+CD3+ live T cells in the indicated samples. DMSO data are the mean ± s.d. of two to three technical replicates. b, Assessment of IFNγ responses (IFNγ+ cells among CD8+ T cells) in the same samples as in a in association with the frequencies of total CD8+ T cells in those cultures. Black arrows indicate reacting samples; a white arrow indicates low-input CD8+ T cells. c–f, Reactivity of PBMCs from healthy donors to the indicated p53 neoantigens by an optimized ex vivo priming assay (c, d) and MIRA assay using TCR sequencing to quantify specific T cell clonal expansion (e–f). IFNγ (c) and Ki67 (d) expression was assessed in the total CD8+ T cell fraction (top) or the non-naive memory CD8+ T cell fraction (bottom). Frequencies are shown for two individual healthy donors as the percentage of live single cells in culture after 2 weeks of in vitro stimulation with the indicated p53 neopeptides compared with CEF and DMSO or an HIV peptide pool as positive and negative controls, respectively. e, Quantification of reactive TCRs in 107 healthy donors in 222 MIRA assay experiments, with an average of two experiments per donor. Median values are denoted by red horizontal line; zero values are circled in red with the number of zero values annotated in blue. f, TP53 hotspots tested in e along the Pareto front yielding fewer or more TCRs grouped in red squares. Statistical significance was assessed by unpaired two-sided t-tests (c, d) or Mann–Whitney U-test (e). *P ≤ 0.05, **P ≤ 0.01, ***P ≤ 0.001, ****P ≤ 0.0001.
Fig. 4
Fig. 4. Mutant p53 fitness informs LFS age of tumour onset and non-neoplastic TP53 mutation distribution.
a, b, Kaplan–Meier curves split on median mutant p53 fitness from the combined model for age of tumour onset in the IARC R20 germline dataset (n = 998) (a) and the NCI LFS dataset (n = 82) (b). c, Left, comparison of TP53 mutation frequencies in non-neoplastic tissues (3,451 mutation occurrences) and the frequencies in TCGA (2,764 mutation occurrences; Pearson r = 0.732, P < 0.0001; Spearman r = 0.544, P < 0.0001; top 10 non-neoplastic mutations coloured in red and annotated). Right, positive relationship between hotspot frequency difference in non-cancerous and cancerous cells and magnitude of immune fitness. CpG-associated hotspots are coloured in red; Y220C is coloured in blue (overall: Pearson r = 0.594, P = 0.120; Spearman r = 0.619, P = 0.102; CpG-associated hotspots only: Pearson r = 0.827, P = 0.022; Spearman r = 0.786, P = 0.036). d, Kullback–Leibler divergence plotted as a function of relative immune weight for the largest tissue-specific mutation distributions across collected non-neoplastic somatic p53 mutations. Optimal immune weights are denoted as stars, and the optimal relative immune weight derived independently to best represent the observed mutation frequency in TCGA is denoted as a black dotted line. e, Log-rank scores of the TCGA (n = 1,941), NSCLC (n = 289) and LFS (IARC, n = 946; NCI, n = 82) cohorts as a function of the relative immune weight. The dashed red line corresponds to the log-rank score for P = 0.05; the dashed black line marks the choice of parameters trained independently to best represent the observed mutation frequency in TCGA. f, The most explanatory models across mutant TP53 datasets, as indicated by red dots.
Extended Data Fig. 1
Extended Data Fig. 1. Inferred relationships between relative transactivation and apparent dimer dissociation constant.
Relationship between the relative transactivation and the inferred apparent dimer dissociation constant for mutant homodimer p53. Blue dotted lines correspond to wild-type p53, which has a relative transactivation of 1 (Methods). The hotspots’ inferred values are annotated in red.
Extended Data Fig. 2
Extended Data Fig. 2. Relationship between mutant p53 concentration and predicted MDM2 binding affinities.
a, Variation in normalized concentration across mutant p53 versus predicted affinity to MDM2 DNA in common TP53-mutated tissues within TCGA. Protein concentration is expressed as log2 of inferred protein concentration in nanomolar (nM) units. b, Fraction positive immunohistochemistry (IHC) assay from the IARC R20 dataset plotted against predicted per-allele mutant p53 concentration averaged across tissues. Correlations are for mutations with at least 10 IHC data entries (Pearson p-value 0.00848, Spearman p-value 0.00967). c, Fraction positive IHC assay plotted against predicted per-allele mutant p53 concentration averaged across tissues only for mutant TP53 hotspots (Pearson p-value 0.0207, Spearman p-value 0.00503).
Extended Data Fig. 3
Extended Data Fig. 3. Fitness model prediction analysis.
a, Predicted ratio from combined fitness model plotted against posterior ratio for each TP53 mutation. Mutations are colored by their observed frequency. Ratios > 1 are predicted to be fixed in the cancer population. Diagonal line corresponds to ratios being equal. b, Prediction accuracy plotted as the proportion of observed mutation frequency for true positive (TP), false positive (FP), true negative (TN) and false negative (FN) model predictions. c, Kullback-Leiber divergence versus number of simulated HLA-I haplotypes shows improved model predictions according to the haplotype sample size. d, Internal validation by shuffling background mutation frequencies, functional phenotypes and immune phenotypes of TP53 mutations for 1,000 iterations and computing the Kullback-Leibler divergence for each iteration. The histogram is of the distribution of Kullback-Leibler divergences from all iterations. Permutation-mean Kullback-Leibler divergence is plotted as a vertical black dotted line and the true Kullback-Leibler divergence is plotted as a vertical red dotted line.
Extended Data Fig. 4
Extended Data Fig. 4. Fitness model predicts mutation frequencies in commonly mutated cancer driver genes.
a, Degree to which models of varying complexity account for mutation distributions from TCGA and COSMIC, excluding TCGA samples, across 27 commonly mutated cancer driver genes. Models are ranked by Bayesian Information Criterion (BIC) in descending order (models with the lowest BIC value are deemed the most explanatory). b, Boxplots of observed mutation frequency variances of driver genes best explained by a particular model, ranked by complexity in ascending order. c, Fitness model results for PTEN per protein position in TCGA, using both conservation and immunogenicity over background mutation rates. The full model is justified by the BIC value (KL divergence = 0.269; Pearson r = 0.701, p-value = 2.013e-24; Spearman r = 0.701, p-value = 2.386e-24). d, Fitness model results for KRAS per protein position in TCGA, using a full model with conservation, function and immunogenicity over background mutation rates with functional information available for seven frequent KRAS cancer mutations (G12A/C/D/R/V, G13D and Q61L). All components are justified by the BIC value (KL divergence = 0.256; Pearson r = 0.981, p-value = 2.095e-24; Spearman r = 0.616, p-value = 0.000104). e, Trade-off between gain-of-function and avoidance of neoantigen presentation, defined as 1ImH, in TCGA pancreatic cancer for KRAS hotspots (Pearson −0.750, p-value = 2.599e-23; Spearman r = −0.774, p-value = 1.507e-25). Each point corresponds to an individual pancreatic cancer sample with a hotspot KRAS mutation.
Extended Data Fig. 5
Extended Data Fig. 5. Inferred mutant immunogenicity is not related to pathogenicity in non-cancer driver genes.
a–f, Comparison of inferred immunogenicity across not-pathogenic and pathogenic missense mutations in nine non-cancerous disease driver genes (HBA, HBB, HBD, HG1, HG2, F8, PAH, PHEX and POGZ) using the Mann-Whitney U-test. Six out of nine genes had sufficient data for comparison between not-pathogenic and pathogenic mutations (HBA, HBB, F8, PAH, PHEX and POGZ). g, Data corresponding to all hemoglobin subunits (HBA, HBB, HBD, HG1 and HG2) were combined and compared (Hemoglobin). Mutations and their “Not-pathogenic” and “Pathogenic” status were determined using the NCBI’s dbSNP and ClinVar systems, respectively.
Extended Data Fig. 6
Extended Data Fig. 6. Fitness trade-offs inferred from ATAC- and RNA-seq.
a, Lack of binding score plotted versus predicted functional fitness. Most TCGA ATAC-seq samples were breast cancers (BRCA), therefore we only plot matched BRCA samples to normalize on tissue-specific protein abundance (Pearson r = 0.46, p-value = 0.063, Spearman r = 0.55, p-value 0.023, N = 17). b, log2 of median TCGA RNA expression (TPM) of eight p53 target genes utilized in fitness model split on median TCGA ATAC-seq lack of DNA binding score (Mann-Whitney p-value = 0.006). c, Immune fitness plotted versus ATAC-seq-based lack of DNA binding footprinting score for each TCGA sample (Pearson r = −0.45, p-value < 0.0001; Spearman r = −0.49, p-value < 0.0001). d, Median TCGA RNA expression (TPM) of the target genes with available ATAC-seq data (WAF1, BAX, h1433s, AIP1, GADD45 and NOXA) plotted versus median probability of mutant p53 binding DNA, conditioned on target DNA chromatin accessibility (Pearson r = 0.25, p-value 0.0459; Spearman r = 0.088, p-value 0.480).
Extended Data Fig. 7
Extended Data Fig. 7. Differential T-cell reactivity to p53 neopeptides.
a, Flow cytometry quantification of HLA-A*02:01 expression on the surface of live T2 cells as a measure of peptide:MHC stabilization via binding to specific peptides. T2 cells were incubated overnight in serum-free media with recombinant human B2M and the indicated peptides at the indicated concentrations, or DMSO as vehicle control. Blue, negative controls (DMSO and unrelated HLA-B*35-restricted NY-ESO-1-derived peptide); red, positive controls (HLA-A*02:01-restricted peptides from flu and HIV viral antigens and Mart1/Melan-A melanoma-associated antigen); gray, experimental peptides containing the indicated mutation in comparison with the corresponding wild-type (wt) sequence. Data are mean ± SD of 2-3 replicates. P values are calculated with a two-sided unpaired t-test. b, Model illustrating the molecular basis of the T-cell stimulation assay and stimulation conditions (APC, antigen presenting cell; TCR, T-cell receptor). c, Representative plots of IFN-γ ± TNF-a expressing cells among CD8+CD3+ live T cells in PBMCs from patients with mutant p53 tumors as in Fig. 3a. d, Correlation analyses between indicated parameters in PBMC samples from R248Q mutant patients with presence of disease (N = 4) at the time of PBMC collection as in Fig. 3b. e, Estimate of mutant p53 amount per tumor cell before treatment in the same patients. Samples with R175H mutations are colored in blue. The sample which reacted, corresponding to the patient who received immune checkpoint blockade (ICB) therapy, is in solid blue, and the sample which did not react, and did not receive ICB, has filled-in lines. f, Flow cytometry gating strategy for total CD8 and non-naïve memory CD8 T-cells analyzed in Fig. 3c, d. TN: naïve T-cells, TCM: central memory T-cells, TEM, effector memory T-cells, TEMRA: effector memory T-cells re-expressing CD45RA.
Extended Data Fig. 8
Extended Data Fig. 8. Relationships between immune fitness and immune checkpoint protein expression in TCGA.
a, b, Continuous and categorical relationships between CTLA-4 (a) and PD-1 (b) protein expression available from TCGA RPPA proteomics assay and immune fitness. For the CTLA-4 scatterplot, Pearson p-value < 0.0001, Spearman p-value < 0.0001. For the PD-1 scatterplot, Pearson p-value = 0.00153, Spearman p-value < 0.0001. Categorical differences measured with the Welch’s t-test. c, Continuous and categorical relationships between PD-L1 protein expression available from TCGA RPPA proteomics assay and immune fitness in commonly TP53-mutated tissues. Correlation p-values: Ovarian - Pearson p-value = 0.2, Spearman p-value = 0.0829; Colorectal - Pearson p-value = 0.157, Spearman p-value 0.003; NSCLC - Pearson p-value = 0.0812, Spearman p-value = 0.00793; Breast - Pearson p-value = 0.00671, Spearman p-value = 0.000140. Categorical differences measured with the Welch’s t-test.
Extended Data Fig. 9
Extended Data Fig. 9. p53 fitness predicts survival and immune relevance in diverse p53-mutated groups.
Kaplan-Meier curves separated by median functional, immune and total fitness in TCGA and MSKCC non-small cell lung cancer (NSCLC) ICB-treated samples. For NSCLC samples, matched HLA-TP53 mutation pairs with lung-specific and allele-specific concentrations were used to determine functional, immune and combined fitness. ns p > 0.05, * p ≤ 0.05, ** p ≤ 0.01, *** p ≤ 0.001, **** p ≤ 0.0001.
Extended Data Fig. 10
Extended Data Fig. 10. Relationships of germline mutant p53 fitness and age of tumour onset.
Kaplan-Meier curves separated by median functional and immune mutant p53 fitness for first-cancer age of onset in the LFS IARC R20 germline dataset (N = 998) and the NCI LFS cohort (N = 82). Mutant p53 fitness was determined using TCGA-derived tissue-specific mutant p53 concentrations for both datasets, with individual HLA-I types for the NCI cohort and averages taken over TCGA haplotypes for the IARC dataset, which lacked individual HLA-I types.

References

    1. Martínez-Jiménez F, et al. A compendium of mutational cancer driver genes. Nat. Rev. Cancer. 2020;20:555–572. doi: 10.1038/s41568-020-0290-x. - DOI - PubMed
    1. Giacomelli AO, et al. Mutational processes shape the landscape of TP53 mutations in human cancer. Nat. Genet. 2018;50:1381–1387. doi: 10.1038/s41588-018-0204-y. - DOI - PMC - PubMed
    1. Baugh EH, Ke H, Levine AJ, Bonneau RA, Chan CS. Why are there hotspot mutations in the TP53 gene in human cancers? Cell Death Differ. 2018;25:154–160. doi: 10.1038/cdd.2017.180. - DOI - PMC - PubMed
    1. Petitjean A, et al. Impact of mutant p53 functional properties on TP53 mutation patterns and tumor phenotype: lessons from recent developments in the IARC TP53 database. Hum. Mutat. 2007;28:622–629. doi: 10.1002/humu.20495. - DOI - PubMed
    1. Kato S, et al. Understanding the function–structure and function–mutation relationships of p53 tumor suppressor protein by high-resolution missense mutation analysis. Proc. Natl Acad. Sci. USA. 2003;100:8424–8429. doi: 10.1073/pnas.1431692100. - DOI - PMC - PubMed