. 2022 May;19(5):613-619.
doi: 10.1038/s41592-022-01468-5. Epub 2022 May 11.

A hybrid open-top light-sheet microscope for versatile multi-scale imaging of cleared tissues

Affiliations

A hybrid open-top light-sheet microscope for versatile multi-scale imaging of cleared tissues

Adam K Glaser et al. Nat Methods. 2022 May.

Abstract

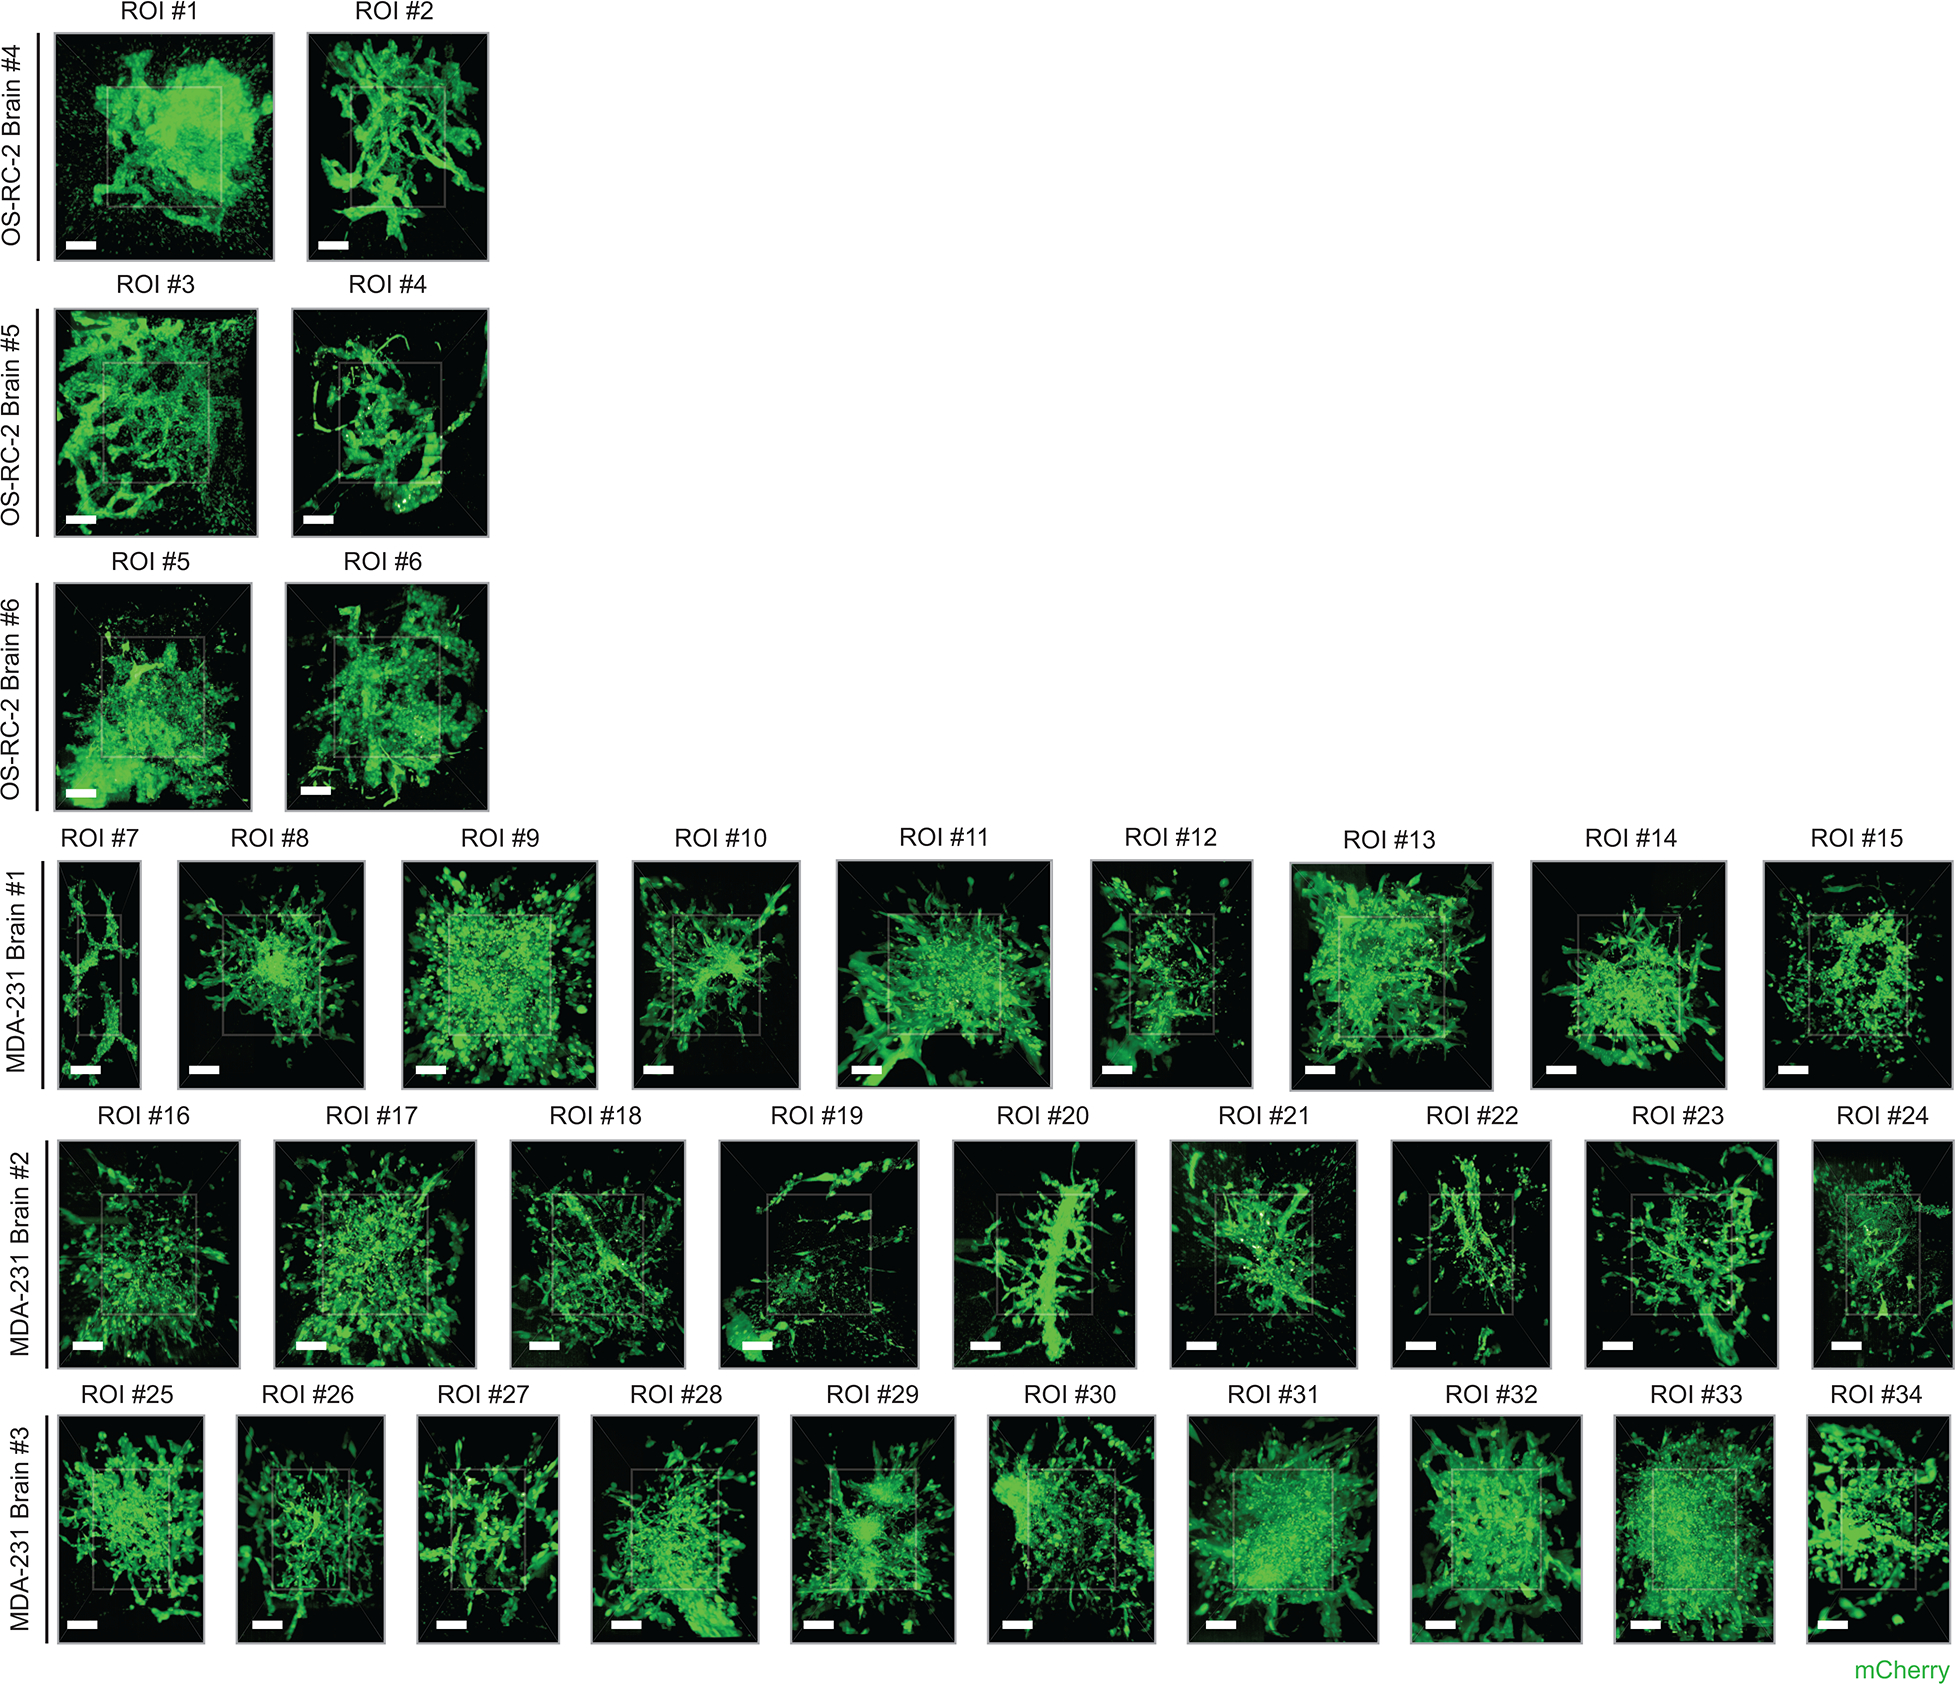
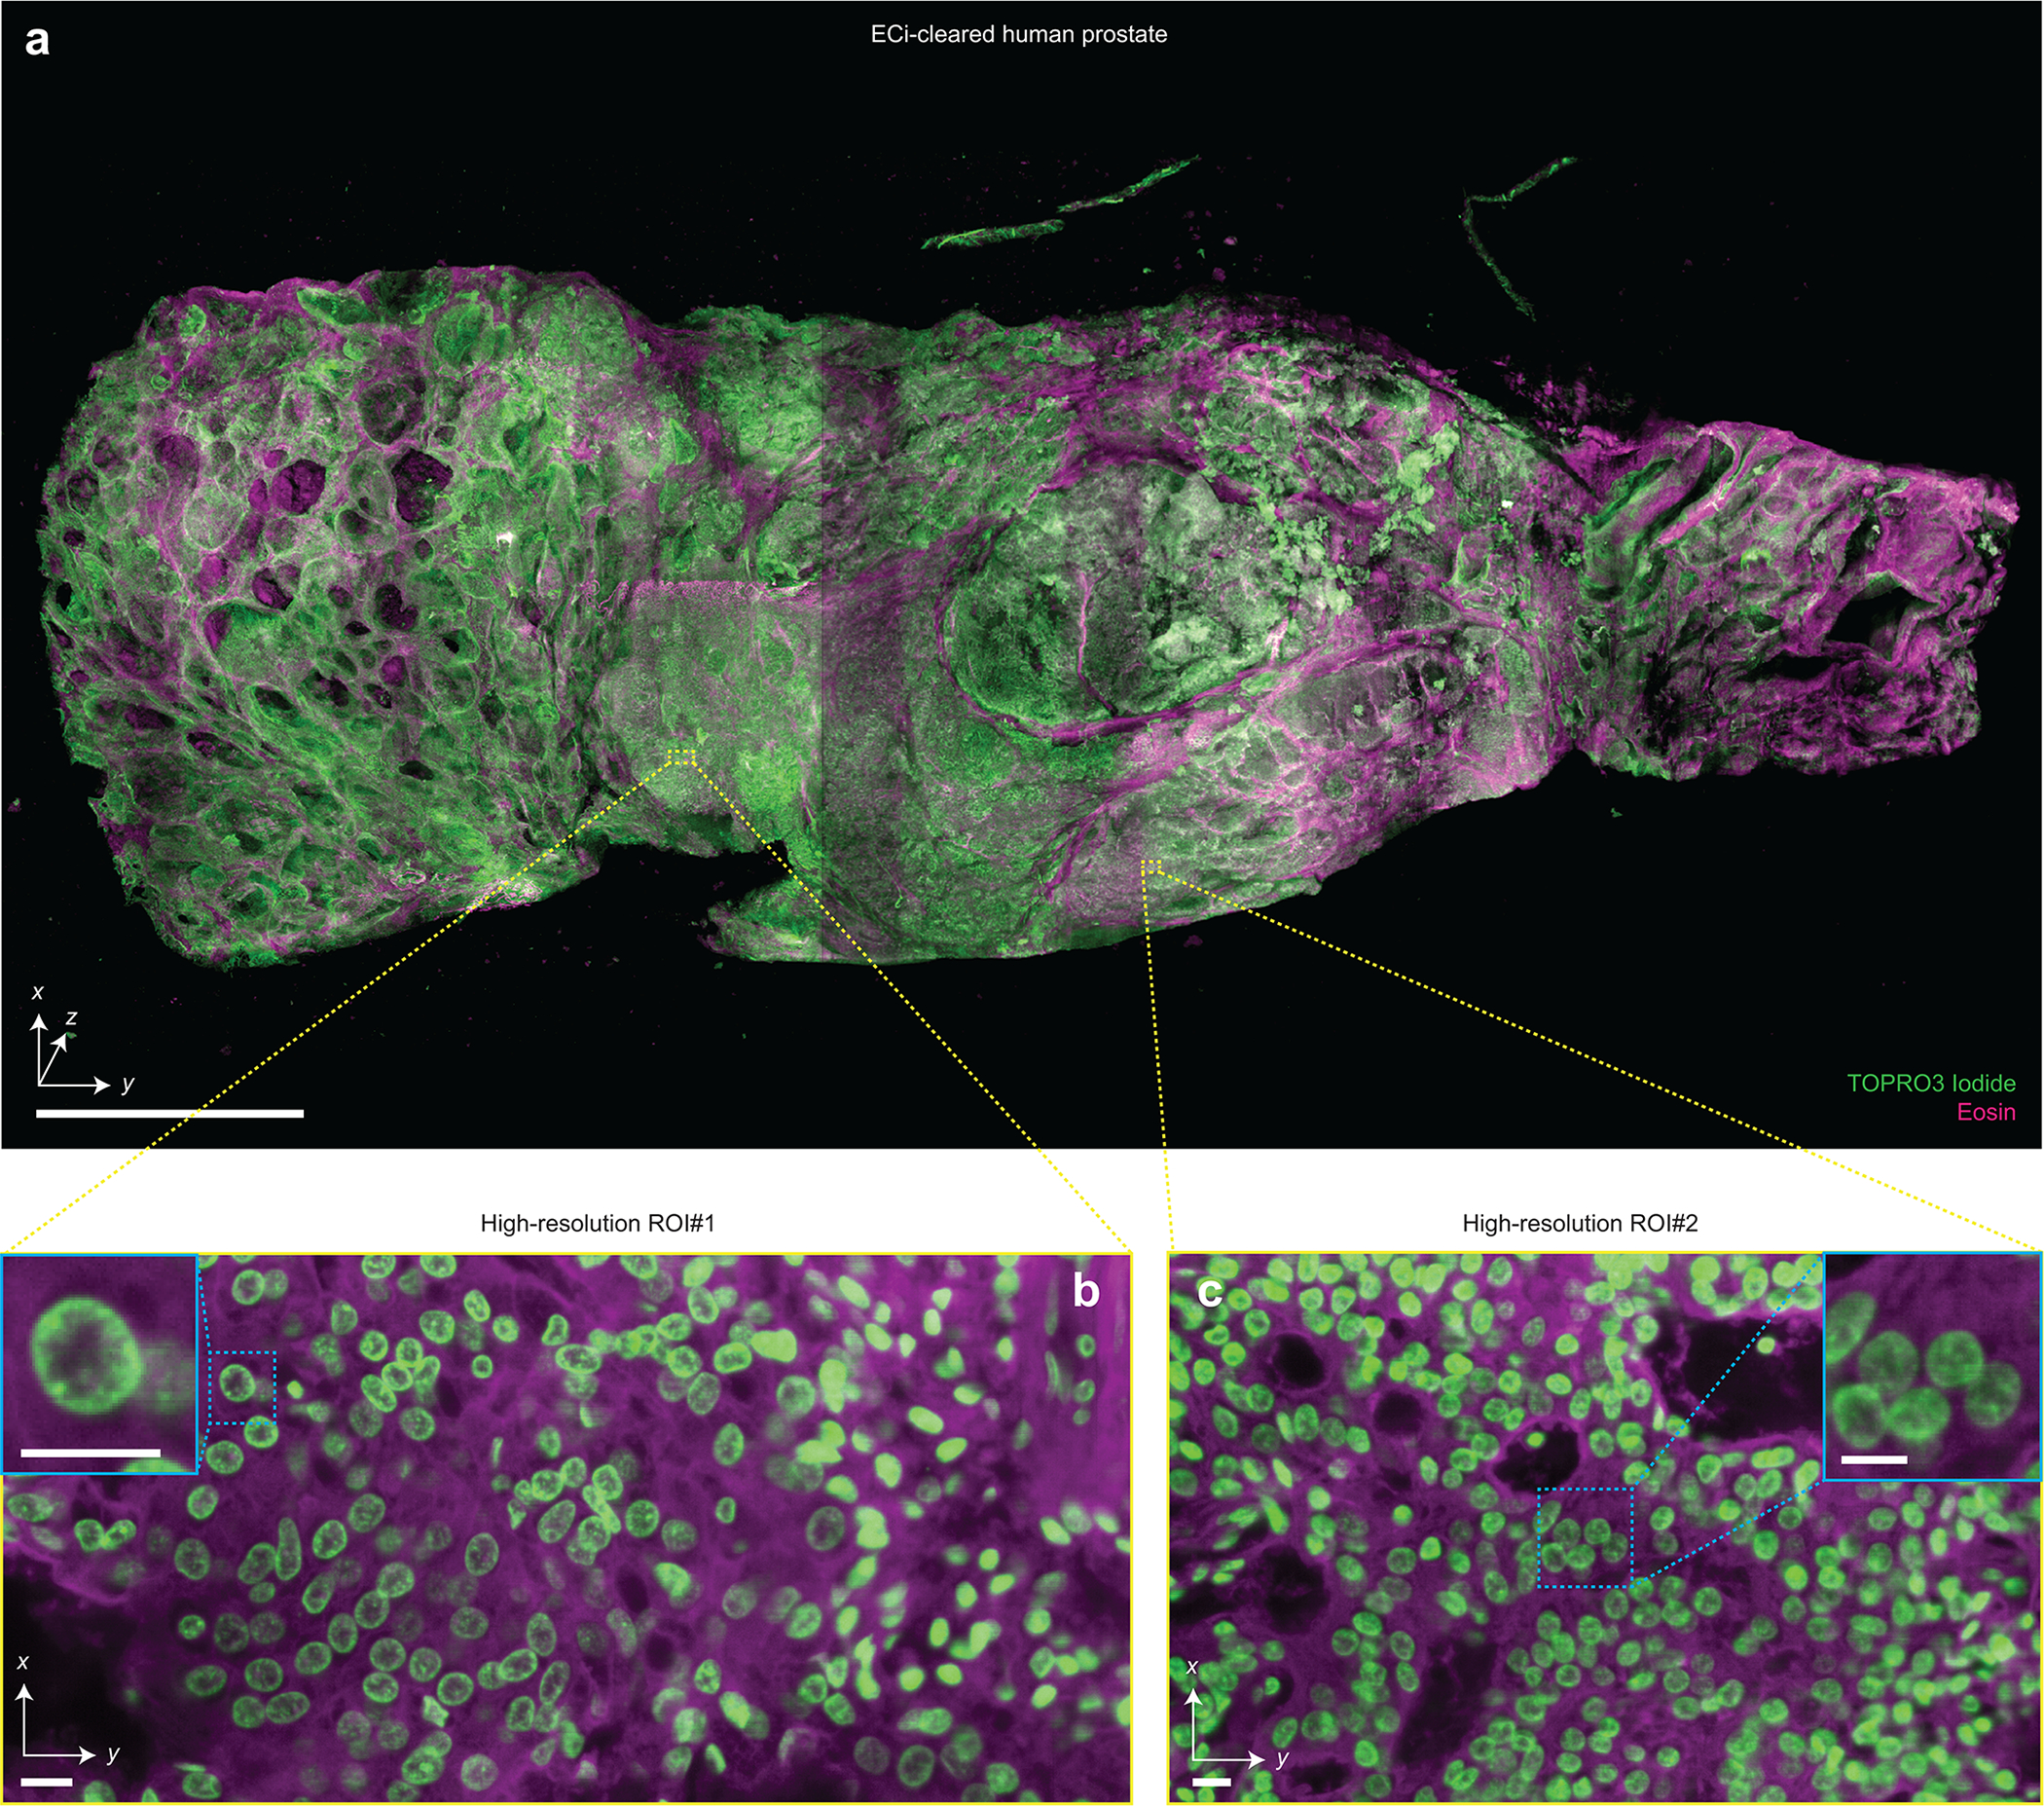
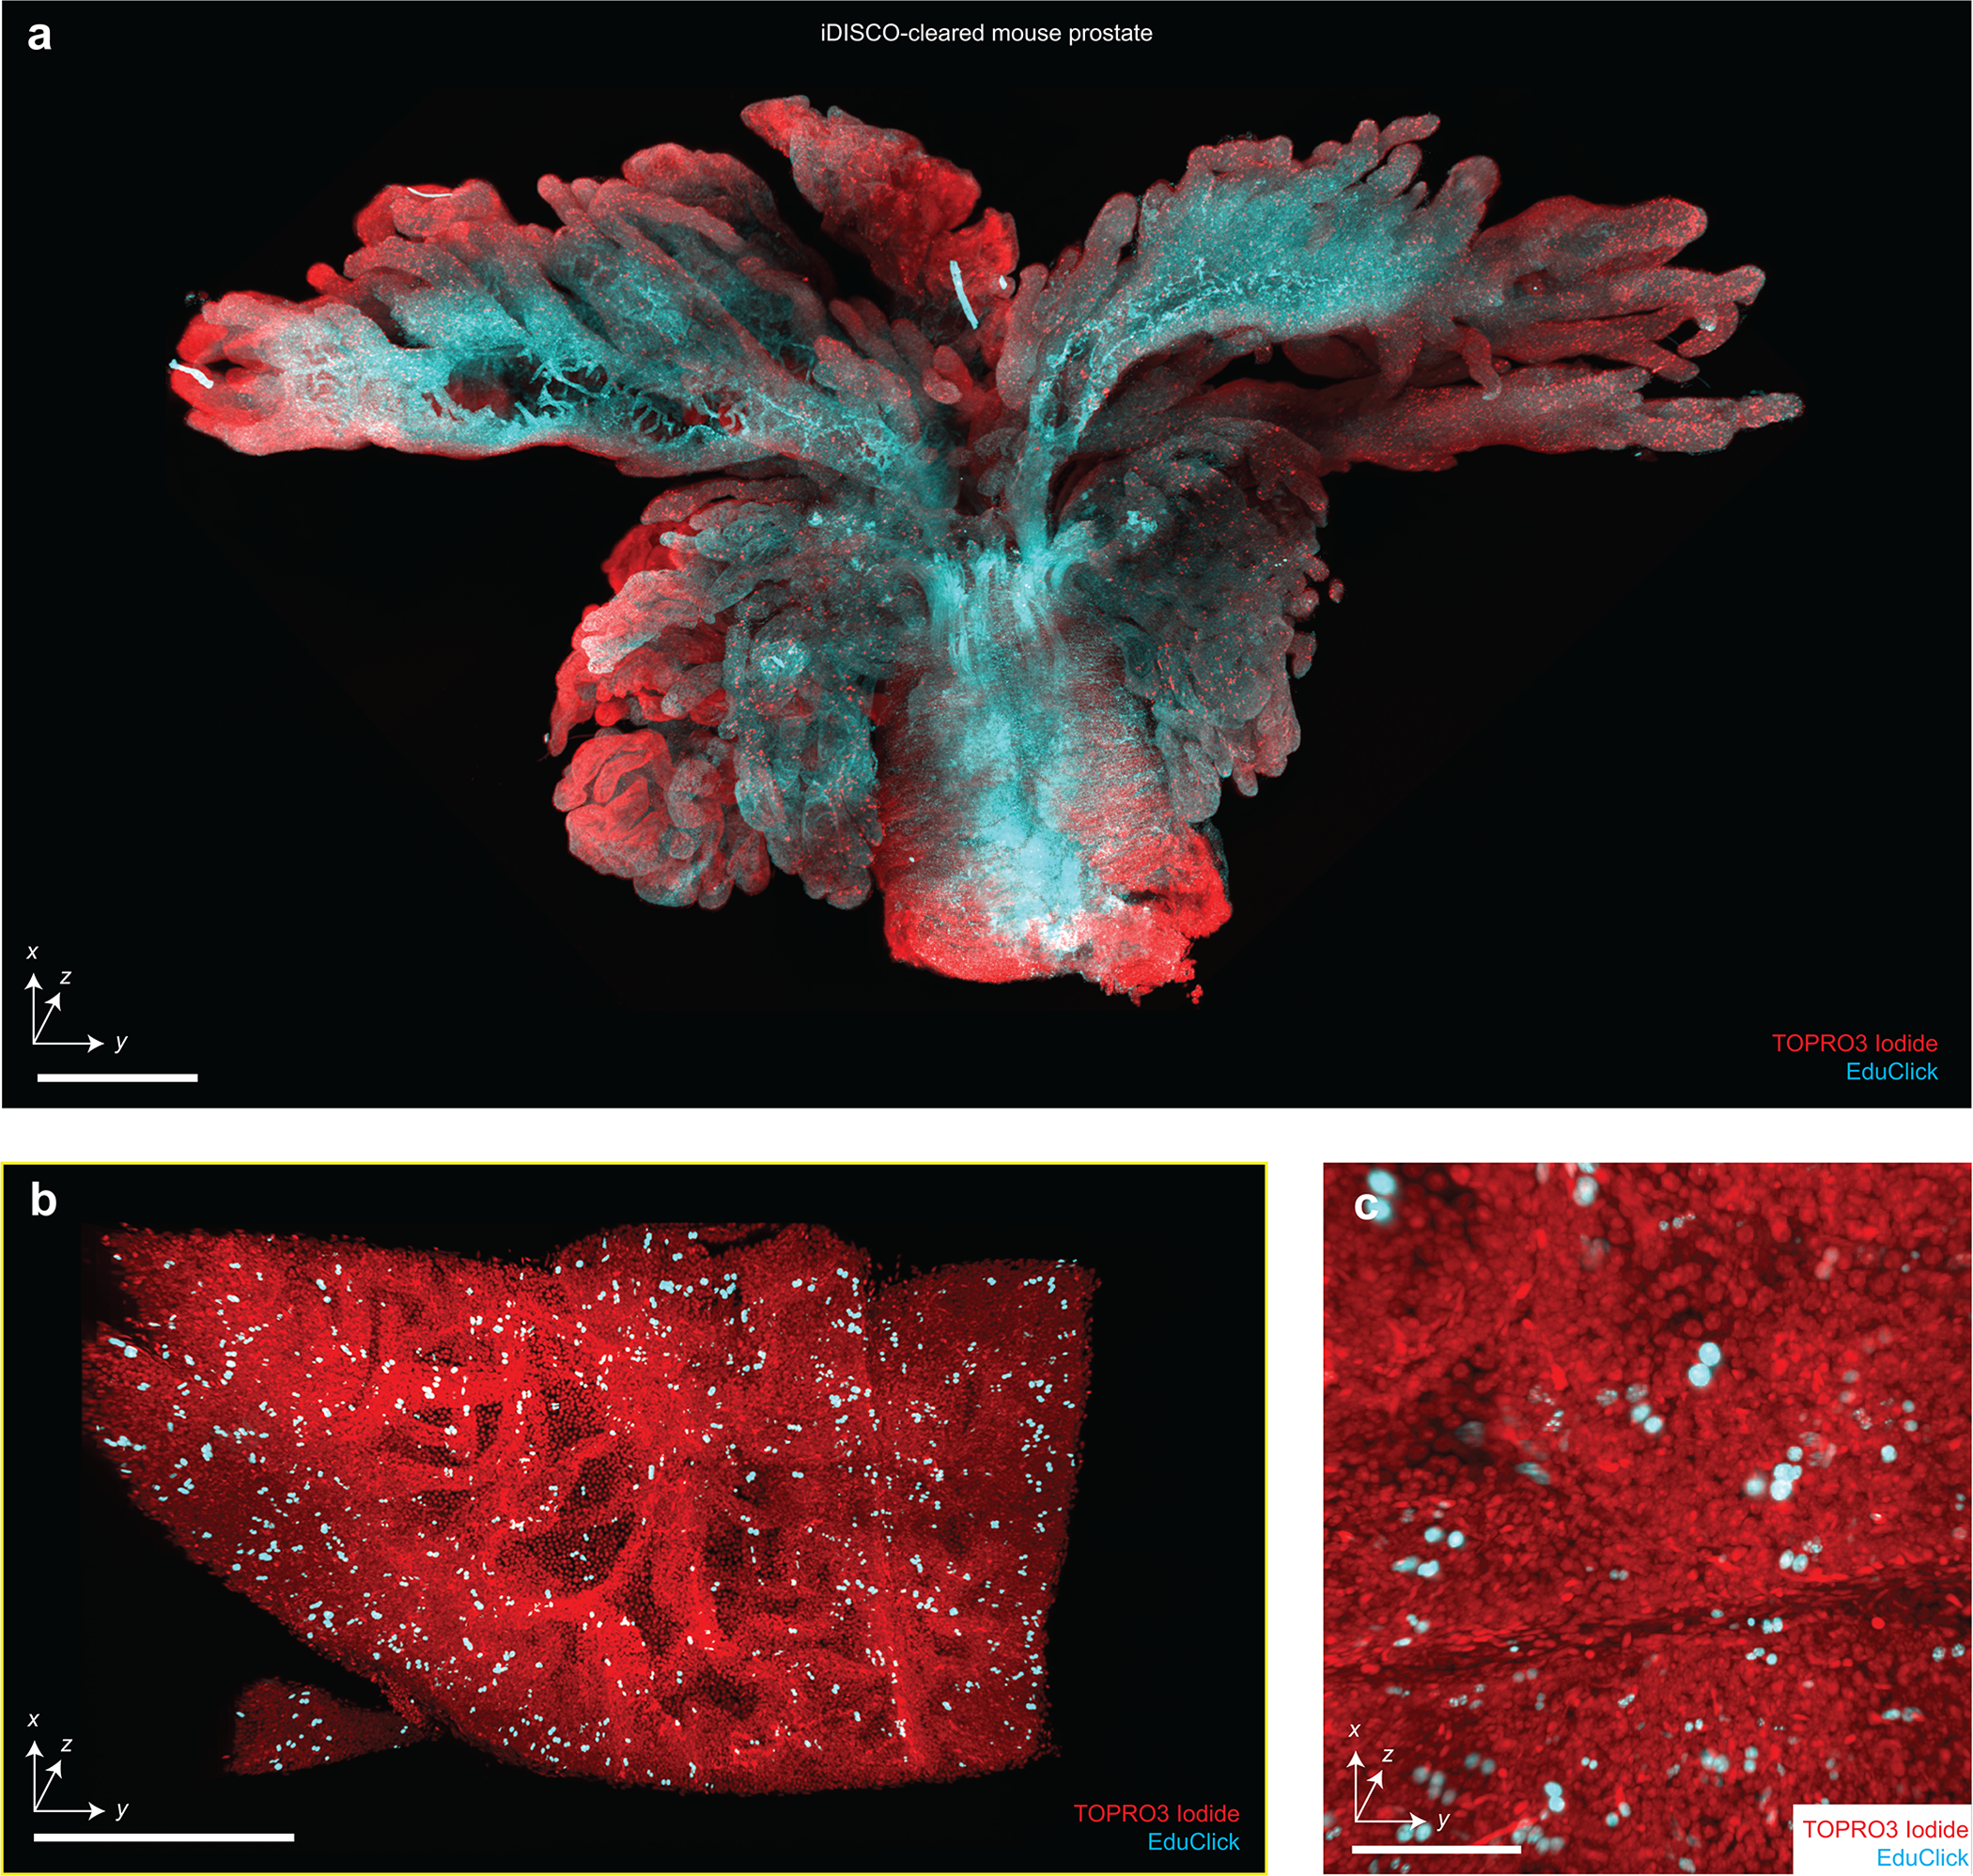
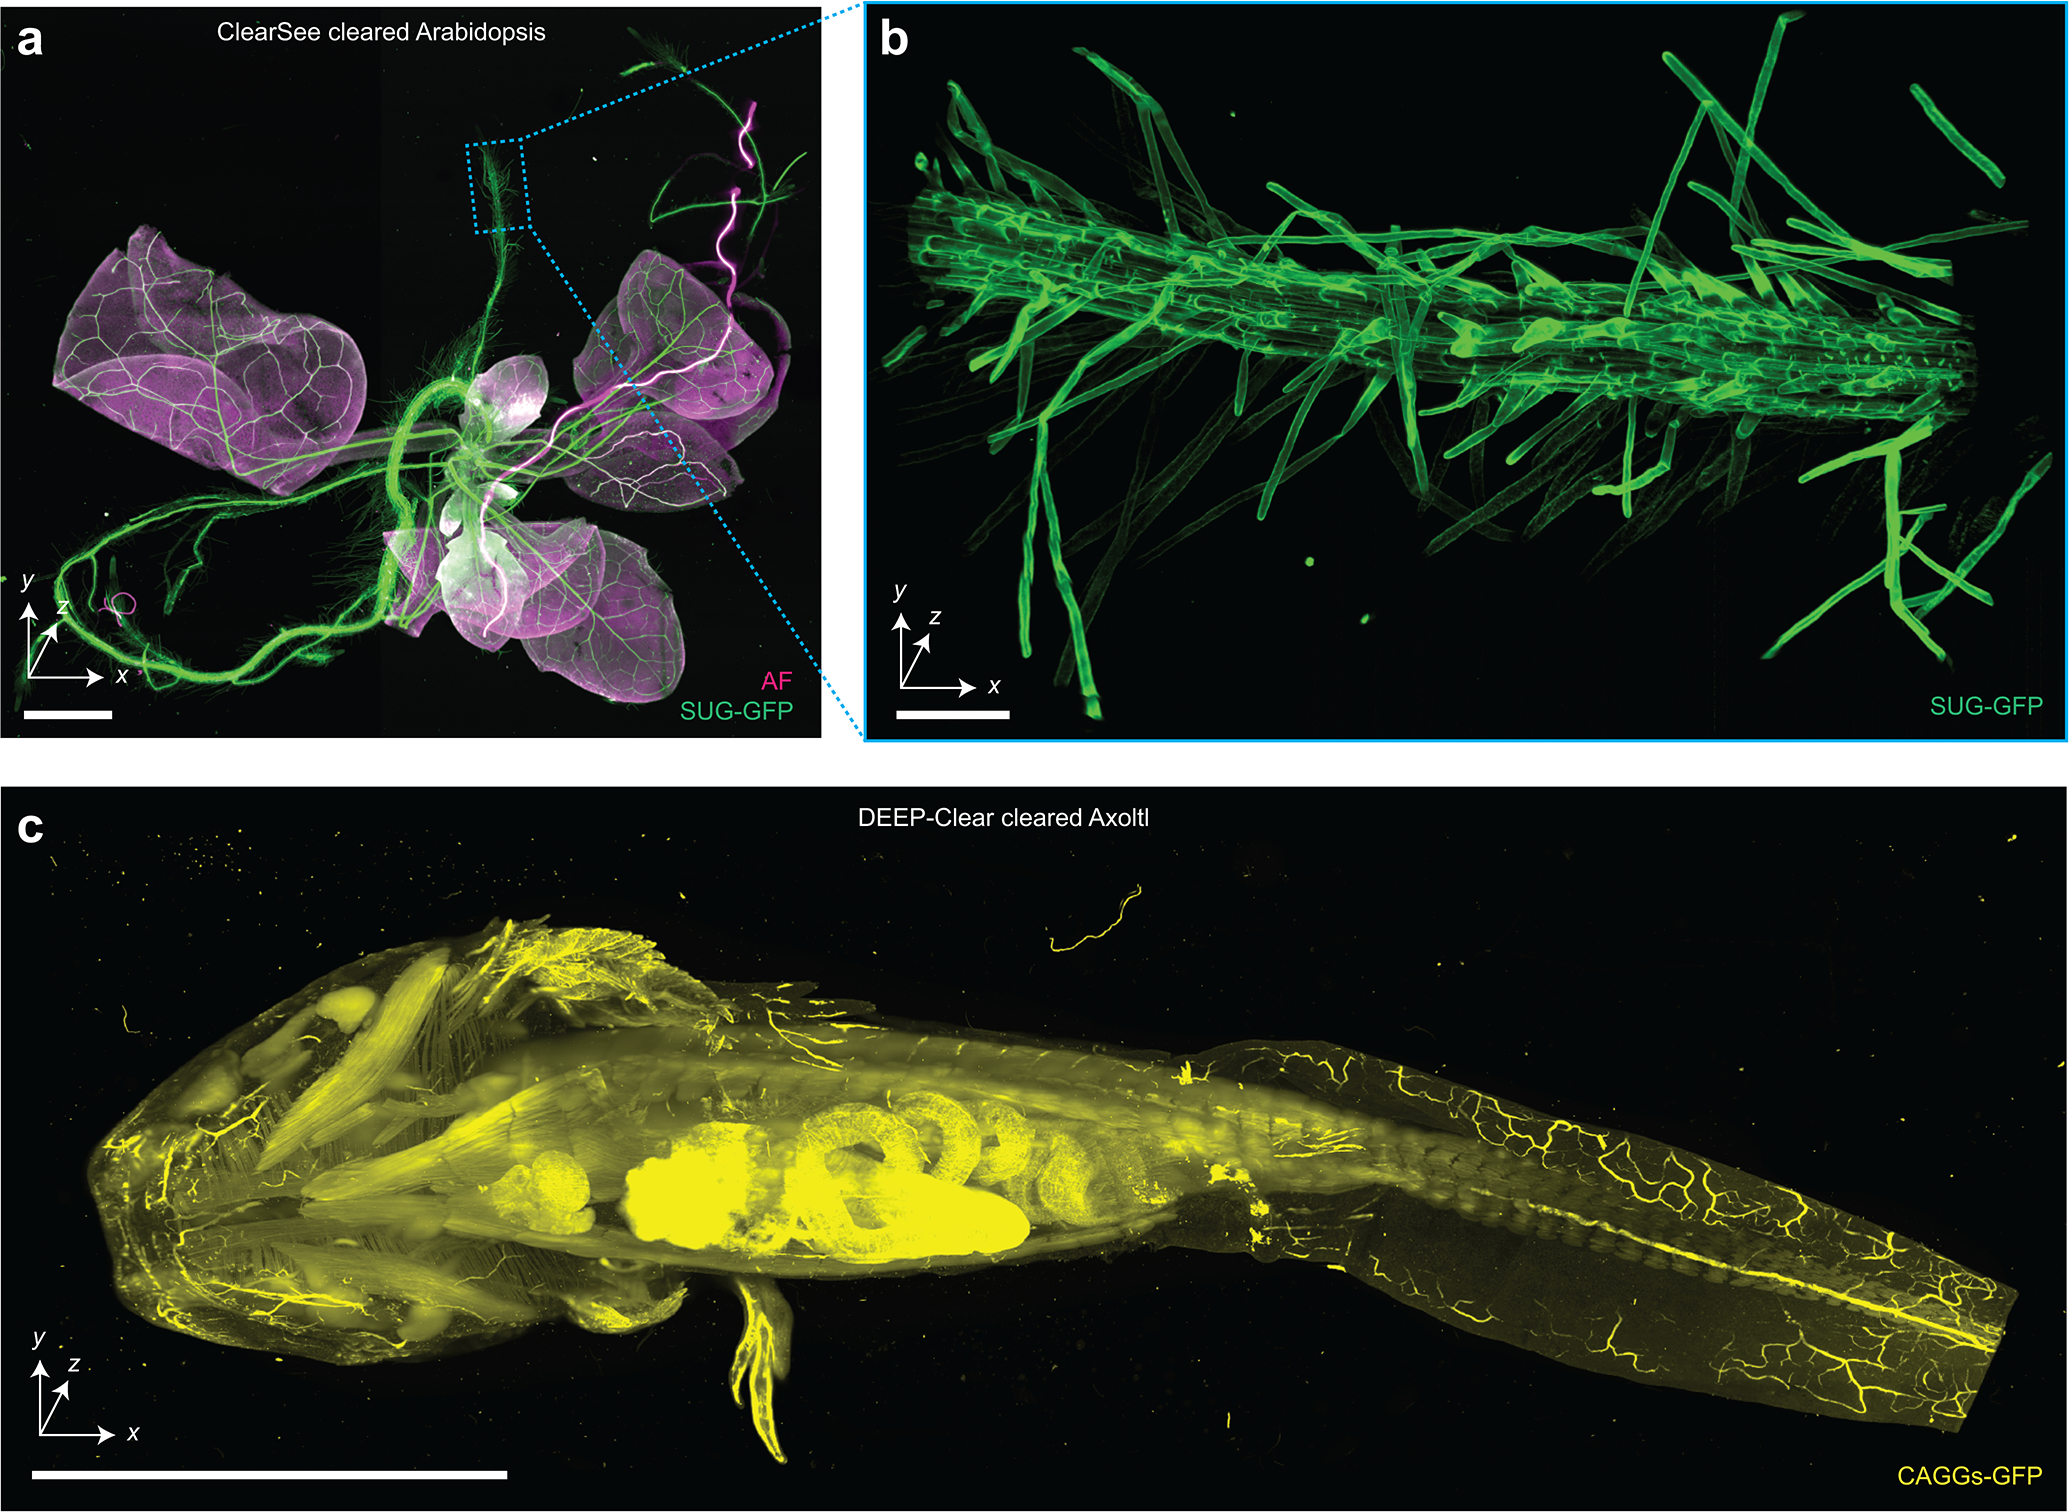
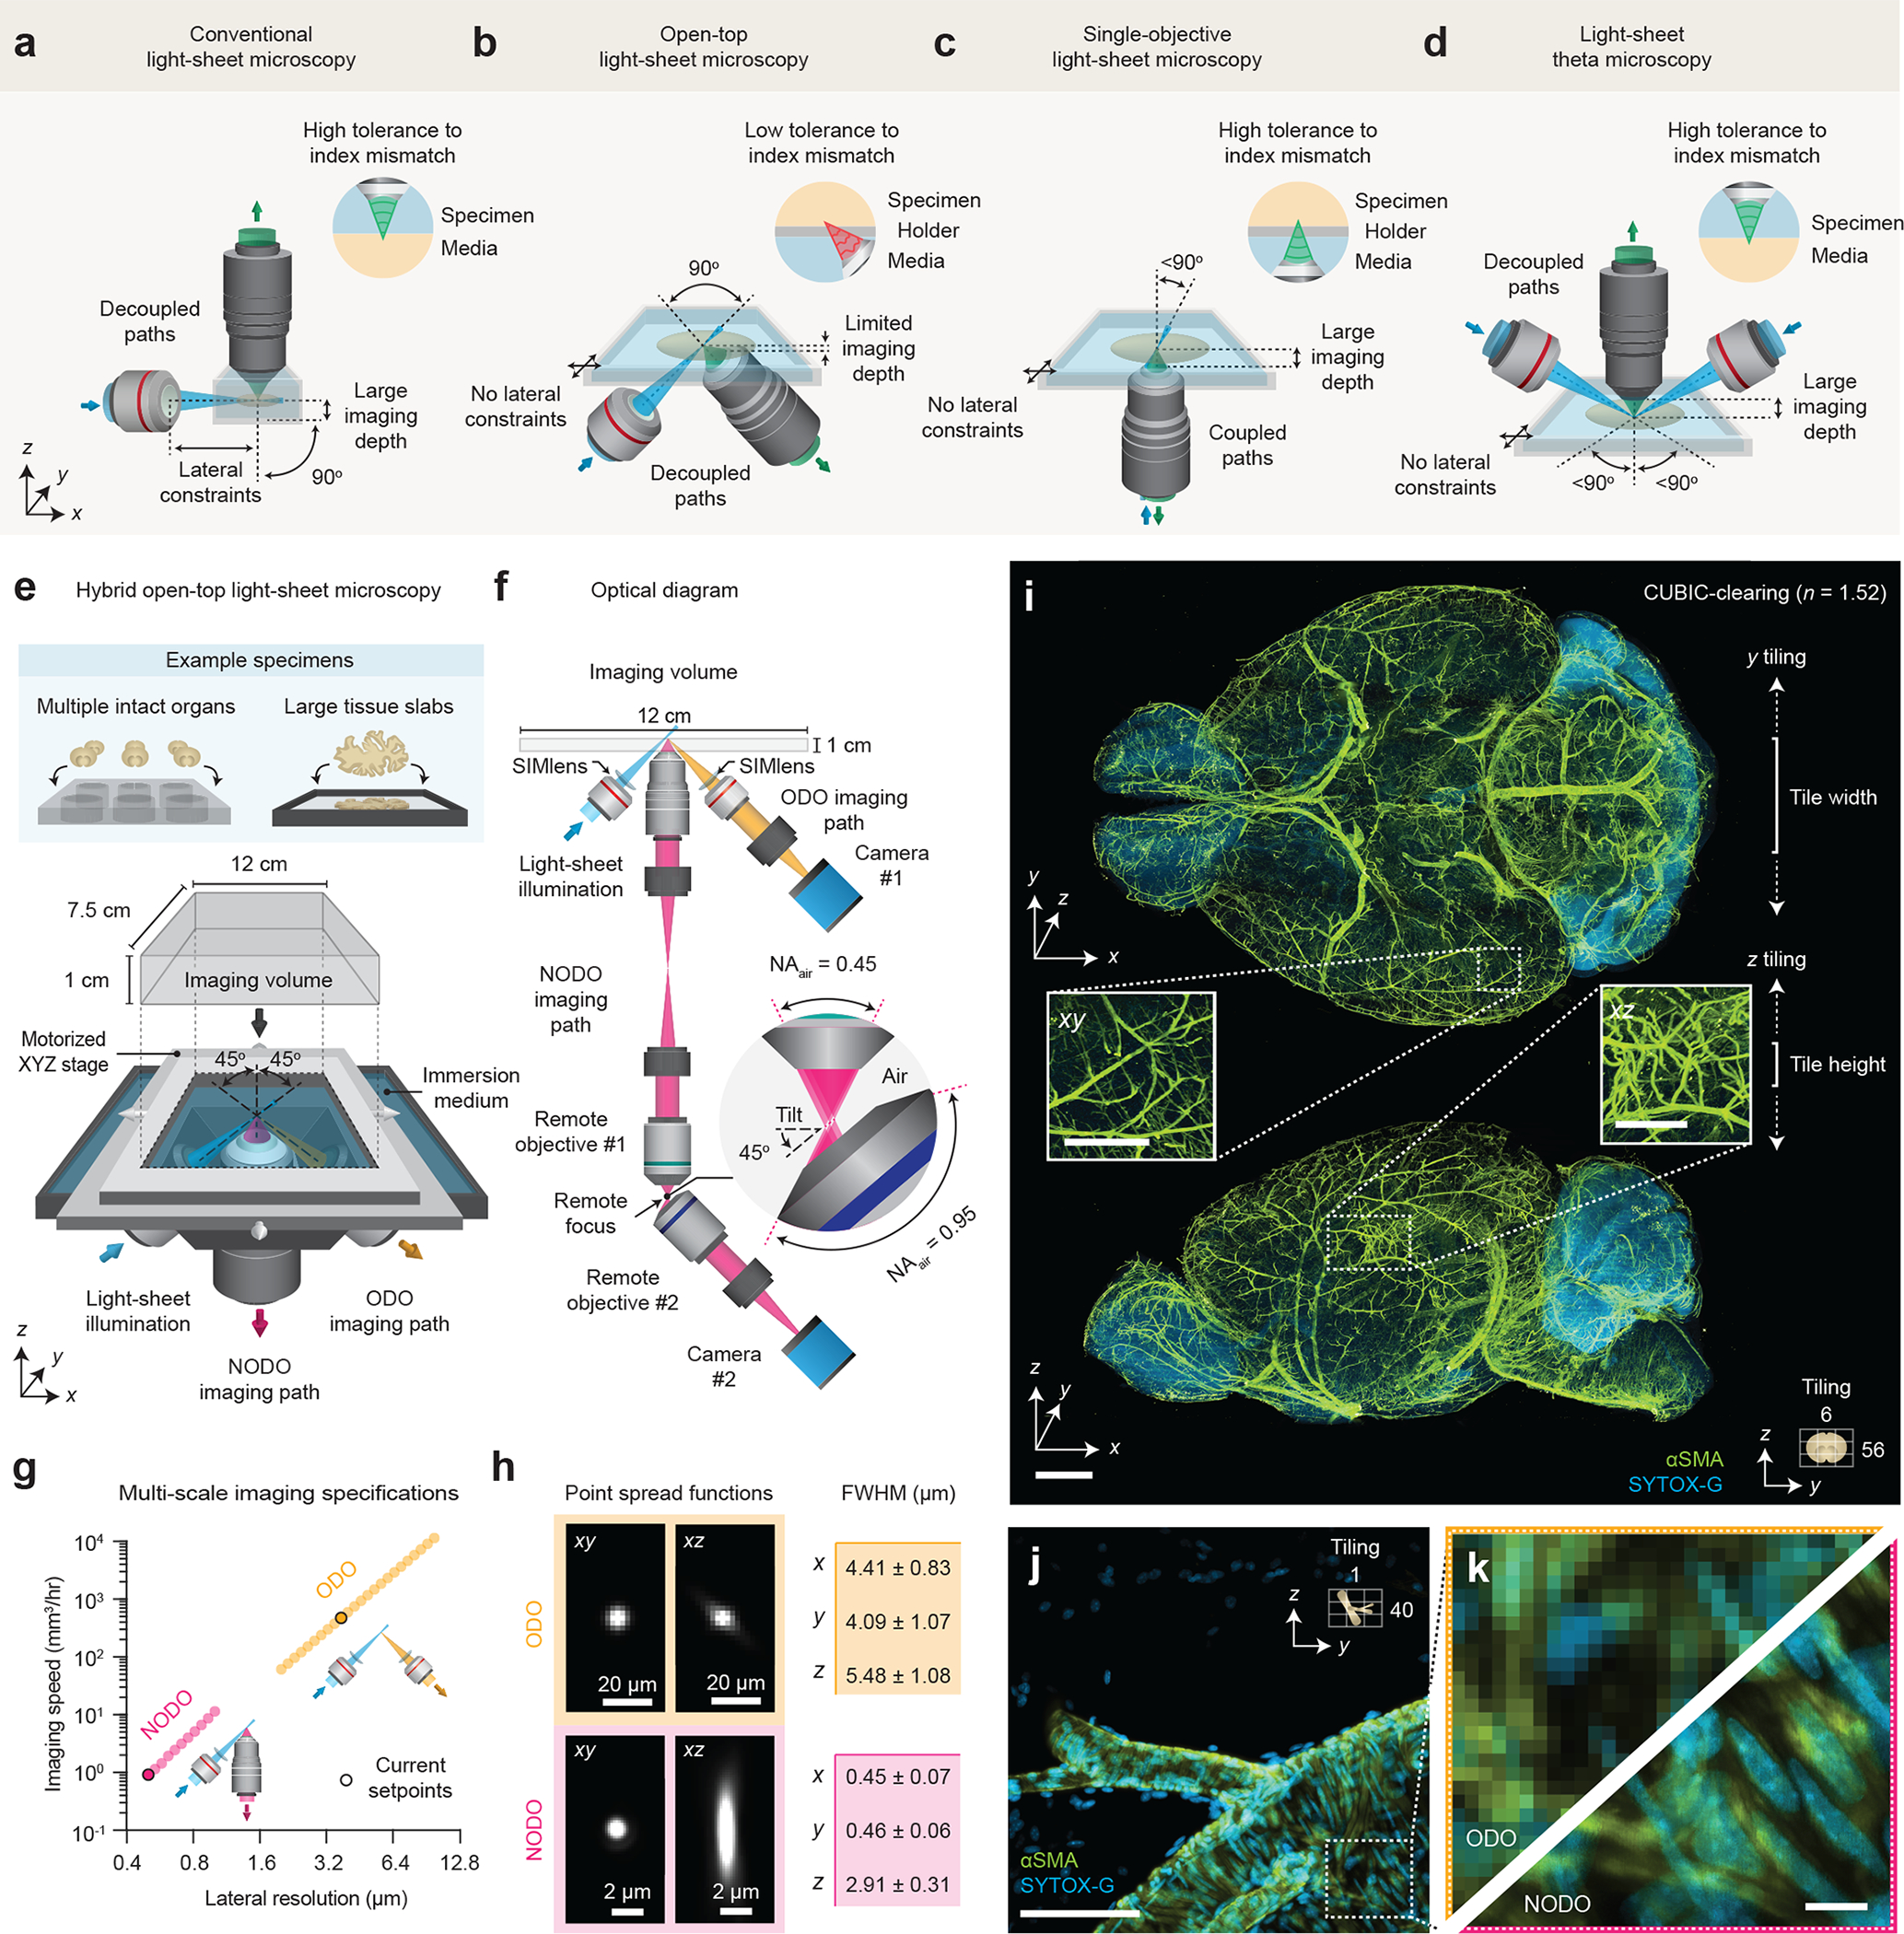
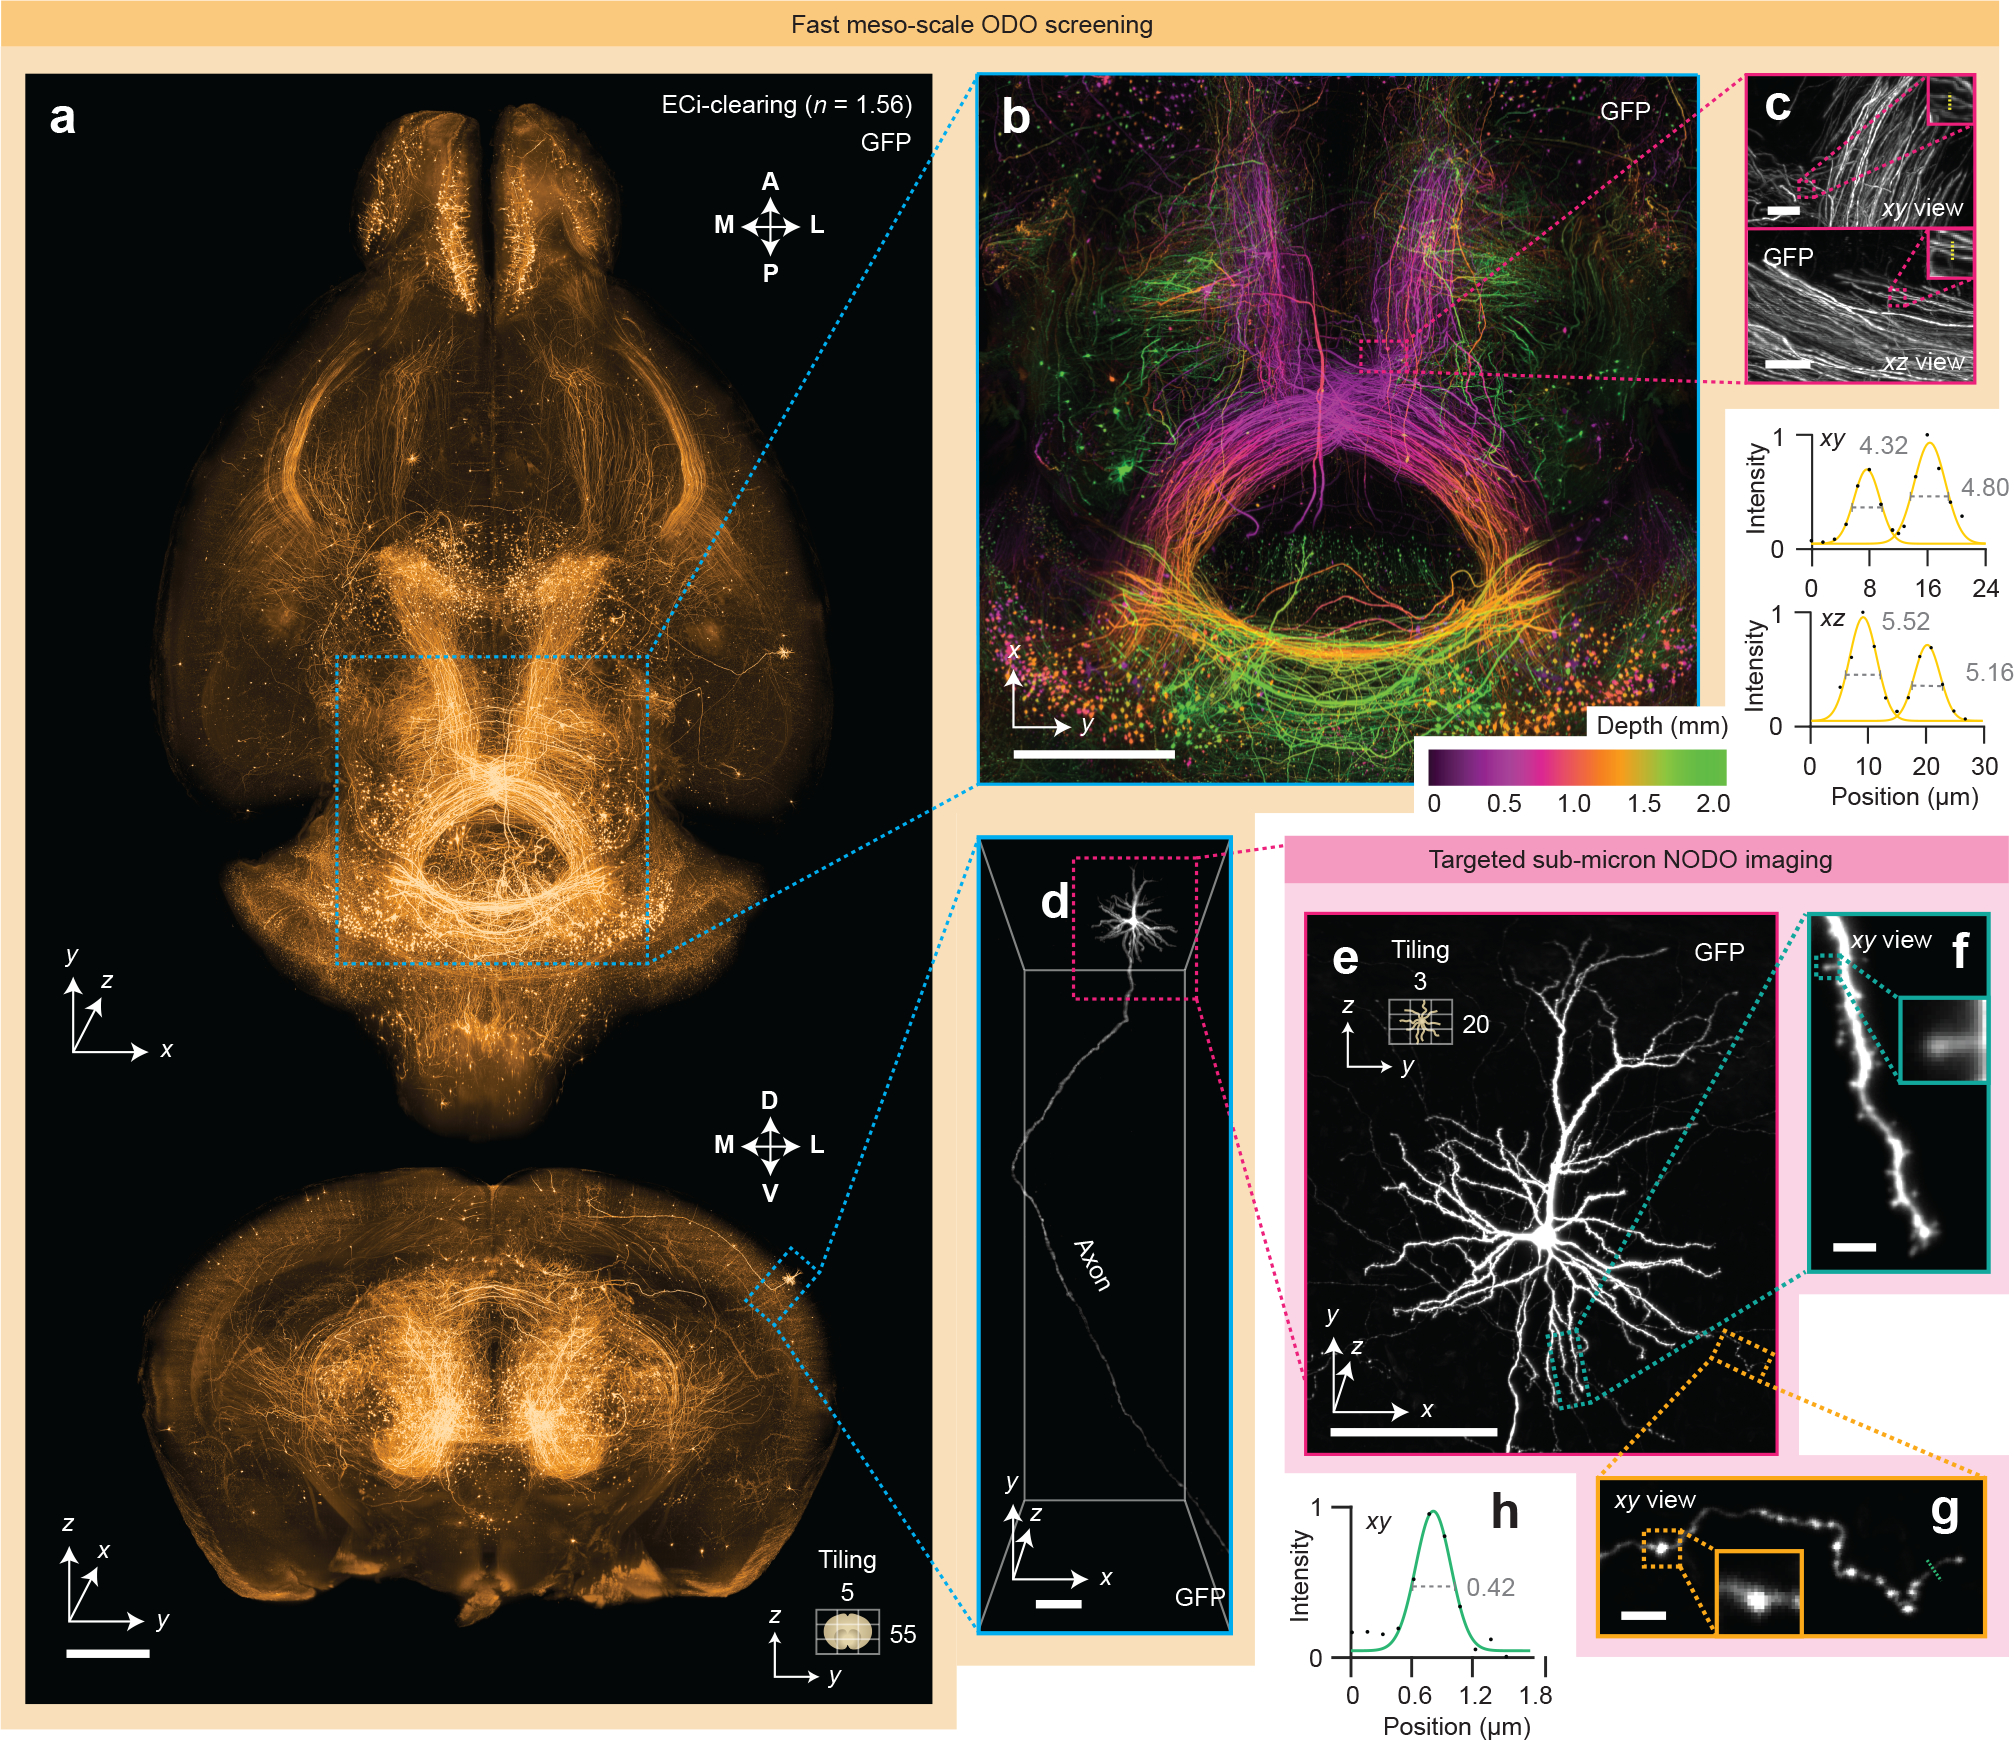
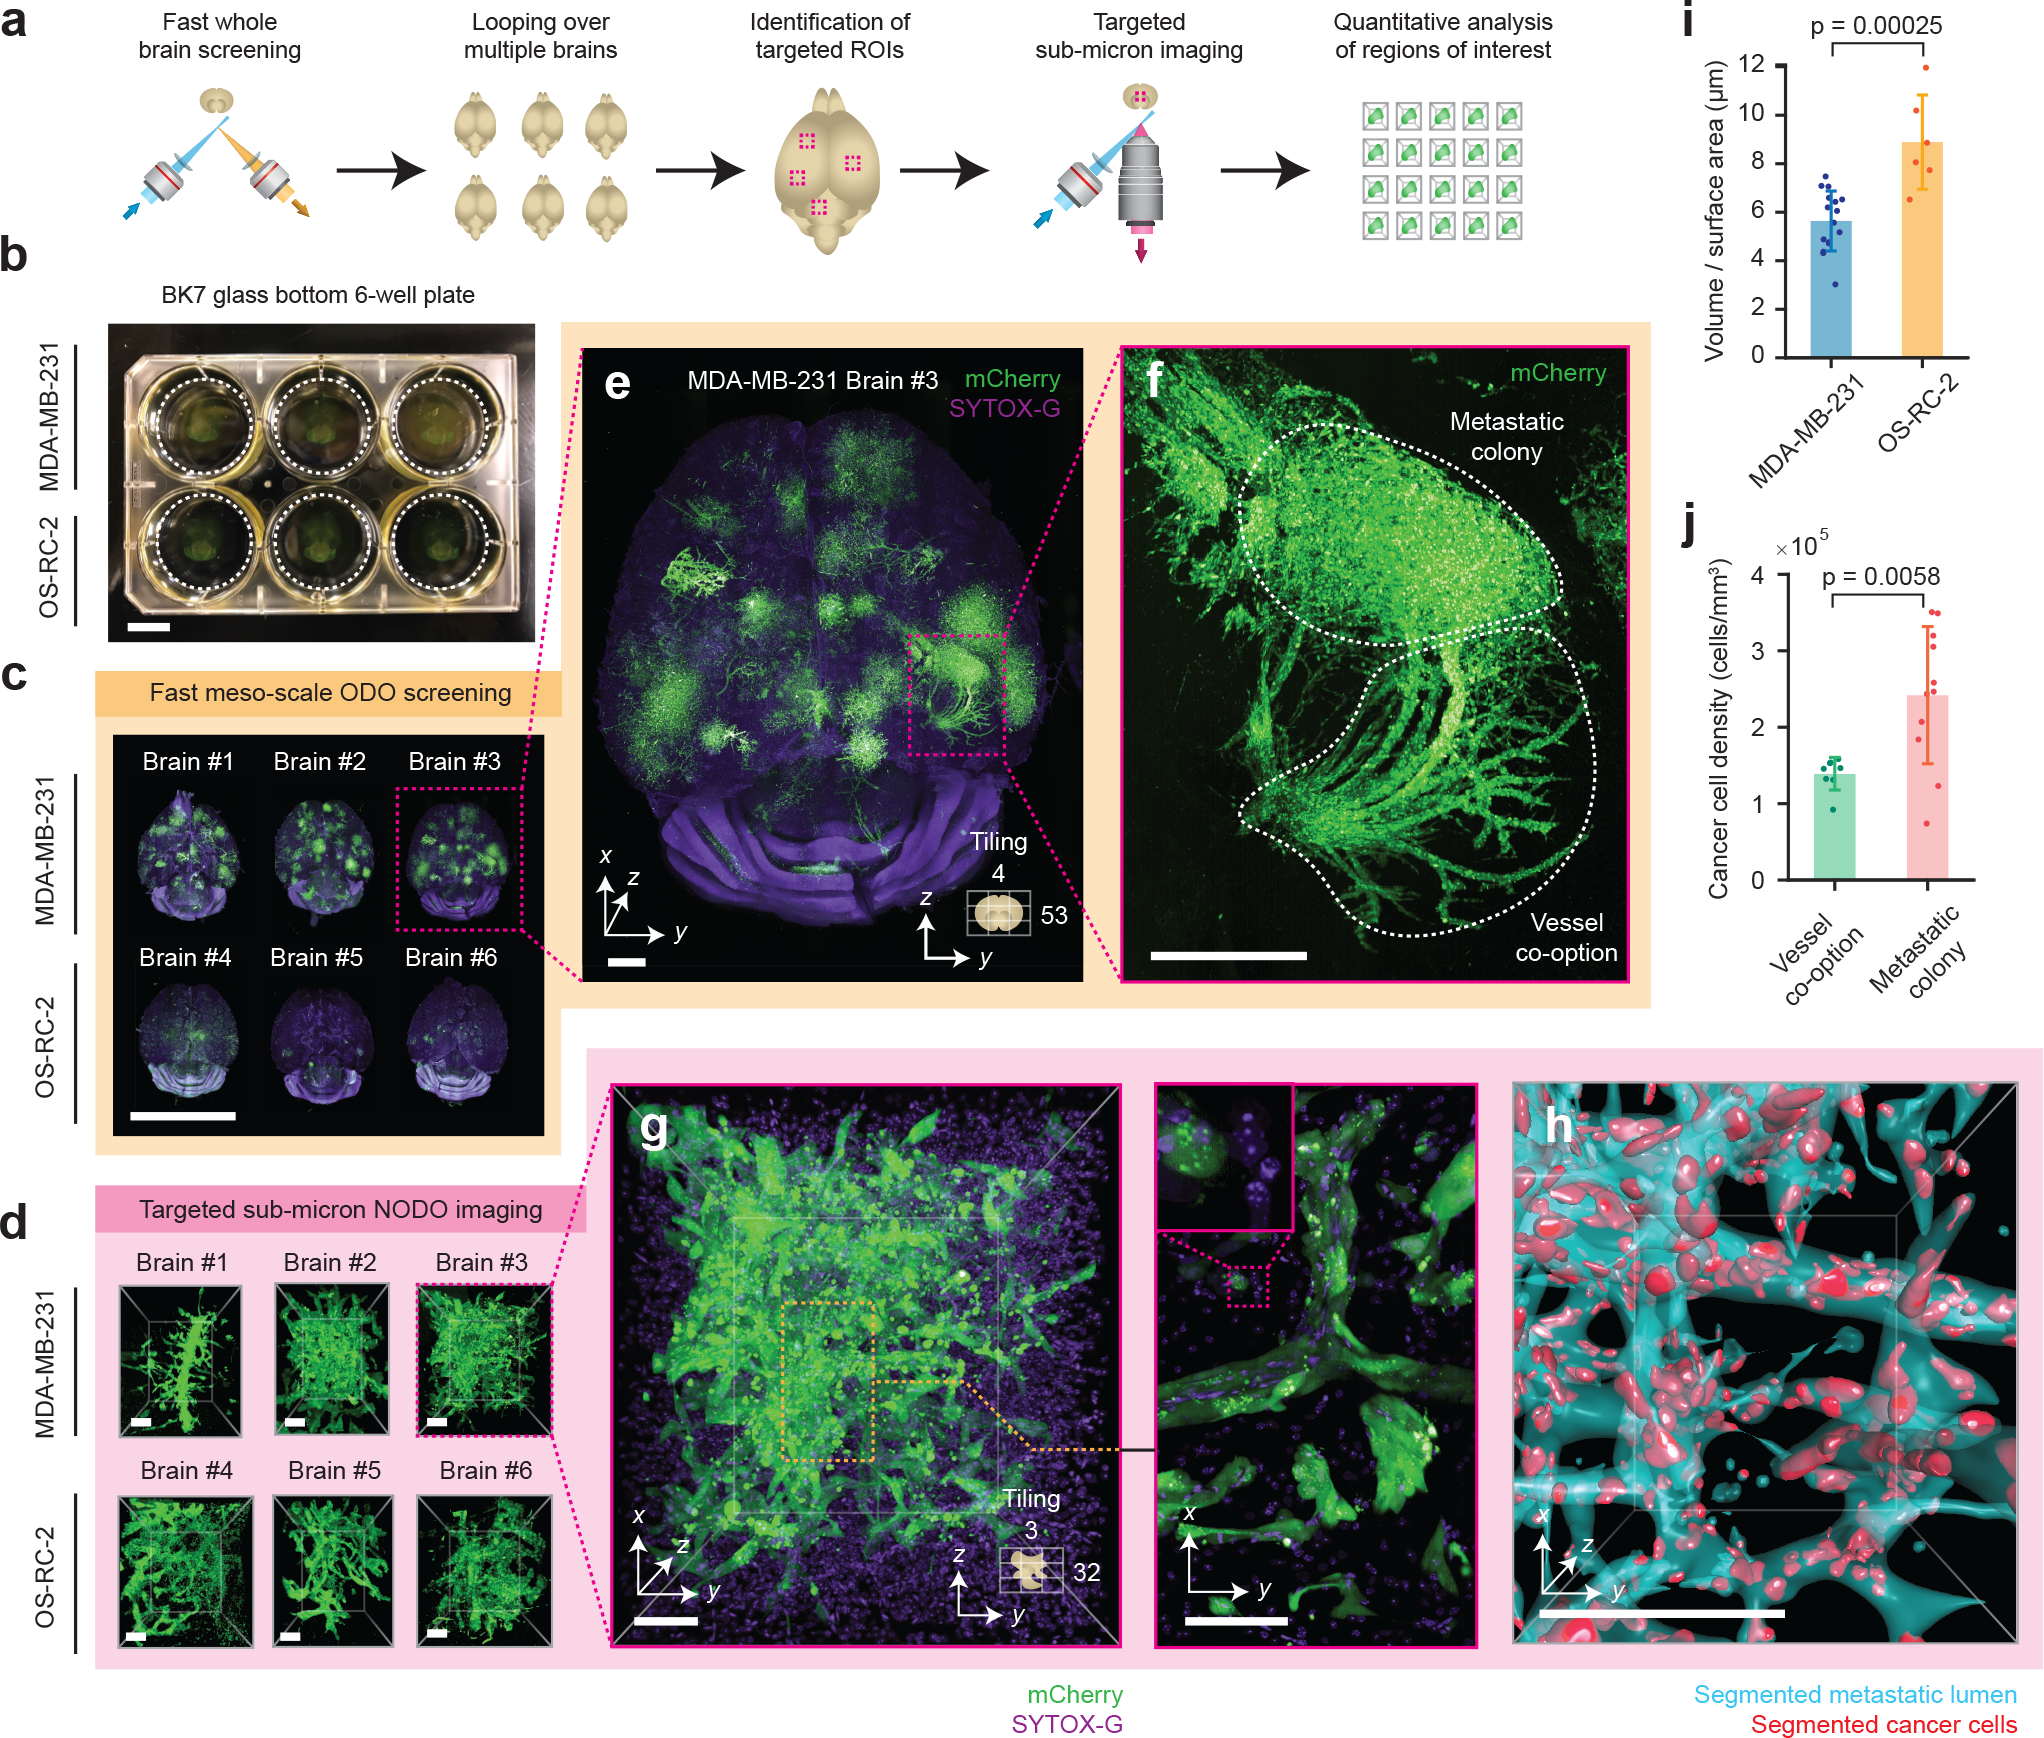
Light-sheet microscopy has emerged as the preferred means for high-throughput volumetric imaging of cleared tissues. However, there is a need for a flexible system that can address imaging applications with varied requirements in terms of resolution, sample size, tissue-clearing protocol, and transparent sample-holder material. Here, we present a 'hybrid' system that combines a unique non-orthogonal dual-objective and conventional (orthogonal) open-top light-sheet (OTLS) architecture for versatile multi-scale volumetric imaging. We demonstrate efficient screening and targeted sub-micrometer imaging of sparse axons within an intact, cleared mouse brain. The same system enables high-throughput automated imaging of multiple specimens, as spotlighted by a quantitative multi-scale analysis of brain metastases. Compared with existing academic and commercial light-sheet microscopy systems, our hybrid OTLS system provides a unique combination of versatility and performance necessary to satisfy the diverse requirements of a growing number of cleared-tissue imaging applications.


Conflict of interest statement

Competing Interests

A.K.G., N.P.R., L.D.T., and J.T.C.L. are co-founders and shareholders of Alpenglow Biosciences. L.A.G.L. and H.L. are employees of Leica Microsystems, Inc., maker of the Aivia software.

Figures

Extended Data Figure 1 |
Extended Data Figure 1 |. Regions of interests from metastatic brain specimens.
All n = 34 metastatic colonies collected from the metastatic brain specimens (3 brains from OS-RC-2 cancer cell line, 3 brains from MDA-MB-231 cancer cell line). All scale bars represent 10 μm.
Extended Data Figure 2 |
Extended Data Figure 2 |. Multi-scale 3D pathology of human prostate tissue.
(a) Fast meso-scale screening results for a multi-cm-sized piece of human prostate tissue stained with TO-PRO-3 Iodide (nuclear) and Eosin. Representative high-resolution regions of interests for two different foci of cancer are shown in (b) and (c). The insets demonstrate the ability to clearly resolve sub-nuclear features in cancer nuclei. Scale bar lengths are as follows: (a) 1 cm, (b) and (c) 10 μm. The imaging data in (a-c) was acquired from in a single experiment.
Extended Data Figure 3 |
Extended Data Figure 3 |. Assessment of 3D cell proliferation assays with iDISCO.
(a) Screening of an intact mouse prostate cleared using iDISCO, labeled with TOPRO3 Iodide (nuclear) and an EduClick cell-proliferation marker. A higher-resolution region of interest focused on a prostate gland is shown in (b). An additional zoomed-in view showing the ability to resolve individual proliferating nuclei (c). Scale bars lengths are as follows: (a) 1 mm, (b) 200 μm, and (c) 100 μm. The imaging data in (a-c) was acquired from in a single experiment.
Extended Data Figure 4 |
Extended Data Figure 4 |. Imaging of non-rodent and non-human tissues.
(a) Hybrid open-top light-sheet imaging of a ClearSee-cleared Arabidopsis specimen. (b) Higher-resolution imaging of the Arabidopsis root. (c) Meso-scale imaging of a large multi-cm Axolotl cleared with DEEP-Clear. Scale bars lengths are as follows: (a) 1 mm, (b) 100 μm, and (c) 1 cm. The imaging data in (a-c) was acquired from in a single experiment.
Extended Data Figure 5 |
Extended Data Figure 5 |. Imaging of immunostained and endogenously fluorescent CUBIC-cleared mouse brains.
Hybrid OTLS imaging of whole mouse brains. (a-c) with endogenously preserved GCaMP6s fluorescence, and immunostained with (d) anti-ChAT antibody + SYTOX-G or (e) anti-Parvalbumin (PV) antibody + SYTOX-G by CUBIC-HistoVision. Scale bar lengths are as follows: (a-b) 1 mm, (c) 10 μm, (d-e) 2 mm. The imaging data in (a-e) was acquired from in a single experiment.
Extended Data Figure 6 |
Extended Data Figure 6 |. Large-scale imaging of thick human tissues.
(a) Slab of human brain tissue after CUBIC clearing. A mouse brain is shown for size comparison. (b) ODO imaging results of the entire 3-mm thick brain slab. Autofluorescence is shown in black and white, and the amyloid small molecule stain (pFTAA) is shown in green. (c) Zoom-in views of an amyloid-rich region reveal perivascular accumulation. Scale bar lengths are as follows: (b) 1 cm. The imaging data in (a-c) was acquired from in a single experiment.
Extended Data Figure 7 |
Extended Data Figure 7 |. NODO imaging quality versus imaging depth in a CUBIC-cleared mouse brain.
(a) Multiple two-channel regions of interest (ROIs) were acquired from a CUBIC-cleared mouse brain at various imaging depths (z = 1 – 8 mm). (b-e) xy views for ROIs at various depths are shown. The corresponding xz views of each ROI are shown in (f-i). The high-magnification insets show fine sub-nuclear details and demonstrate that there is minimal degradation in image quality as a function of depth. All scalebars denote 10 μm. The imaging data in (b-i) was acquired from in a single experiment.
Extended Data Figure 8 |
Extended Data Figure 8 |. NODO imaging quality versus imaging depth in a PEGASOS-cleared mouse brain.
(a) A single ROI was acquired from a PEGASOS-cleared mouse brain. (b) xz view of the ~5 mm deep ROI, demonstrating near-consistent image quality versus depth. (c-g) xy views for ROIs at various depths are shown. The high-magnification insets show fine sub-nuclear details and demonstrate that there is minimal degradation in image quality as a function of depth. Scale bar lengths are as follows: (b) 100 μm, (c-g) 10 μm. The imaging data in (b-g) was acquired from in a single experiment.
Extended Data Figure 9 |
Extended Data Figure 9 |. NODO imaging quality versus imaging depth in an ECi-cleared mouse brain.
(a) Multiple regions of interest (ROIs) were acquired from an ECi-cleared mouse brain at various imaging depths (z = 0 – 5 mm). (b-f) xy views for ROIs at various depths are shown. The corresponding xz views of each ROI are shown in (g-k). The high-magnification insets show fine sub-nuclear details and demonstrate that there is minimal degradation in image quality as a function of depth. All scalebars denote 10 μm. The imaging data in (b-k) was acquired from in a single experiment.
Figure 1 |
Figure 1 |. Hybrid open-top light-sheet (OTLS) microscopy.
(a-d) Optical layouts of conventional, open-top, single-objective, and theta light-sheet microscopy systems. Aspects of each microscope architecture, including number and orientation of objectives, lateral constraints on specimen size, maximum imaging depth, and tolerance to index mismatch are highlighted. (e-f) Our hybrid microscope architecture consists of three objectives positioned below the specimen. One objective is used for light-sheet illumination, and the other two objectives are used for ODO and NODO imaging. By using a motorized stage, tiled imaging is possible with both paths over a large 12 × 7.5 × 1 cm (XYZ) imaging volume, accommodating multiple intact cleared organs and large tissue slabs mounted in an array of specimen holders. (g) In combination, the ODO and NODO paths enable imaging over a tunable lateral resolution range of 0.5 – 10.7 μm at imaging speeds of ~5 mm3 to 10 cm3 per hour. The current set points of the system are highlighted. (h) At these set points, the mean ± standard deviation full-width half-maximum (FWHM) resolutions (xyz) for the ODO path are 4.09 ± 1.07, 4.41 ± 0.83, and 5.48 ± 1.08 μm (n = 109 beads), and for the NODO path are 0.45 ± 0.07, 0.46 ± 0.06, and 2.91 ± 0.31 μm (n = 437 beads). (i) Representative ODO imaging results of an entire intact CUBIC-cleared mouse brain with arterial (αSMA) and nuclear (SYTOX-G) staining. The ODO imaging path is able to clearly resolve vasculature in both the xy and xz planes (insets). The size and direction of tiling is annotated. (j-k) Targeted NODO imaging of a sub-region centered on a branching arteriole resolves individual smooth muscle cells and sub-nuclear features that are not resolved by ODO imaging. Scale-bar lengths are as follows: (i) 1 mm (insets, 500 μm), (j) 100 μm, and (k) 10 μm. All images are displayed without deconvolution. The imaging data in (i-k) was acquired from a single mouse brain in a single experiment.
Figure 2 |
Figure 2 |. Fast meso-scale screening and targeted sub-micrometer imaging in cleared tissues.
(a) Fast meso-scale screening is performed of an entire intact ECi-cleared Slc17a7-Cre mouse brain with brain-wide axonal projections. (b) A depth-coded region of interest shows dense projections in the midbrain. (c) xy and xz zoom-in views illustrate the near-isotropic resolution of the hybrid OTLS microscope. Line profiles through individual axons demonstrate an ODO lateral and axial resolution of 4–5 μm at a large depth within the cleared specimen. (d-e) Targeted sub-micrometer imaging is performed of a region of interest around a cortical pyramidal neuron. (f-g) Zoom-ins of a dendrite and axon demonstrate sufficient lateral resolution to visualize individual spines and varicosities. (h) A line profile through an individual axon demonstrates a NODO lateral resolution of 0.42 μm within the cleared specimen. Scale-bar lengths are as follows: (a-b) 1 mm, (c) 10 μm, (d-e) 100 μm, and (f-g) 5 μm. All images are displayed without deconvolution. The imaging data in (a-g) was acquired from a single mouse brain in a single experiment.
Figure 3 |
Figure 3 |. Multi-scale OTLS microscopy for quantitative analysis of brain metastases.
(a) Hybrid OTLS microscopy workflow for multi-scale imaging of multiple specimens. (b) n = 6 whole mouse brains containing metastatic lesions from two different cancer cell lines (MDA-MB-231 and OS-RC-2) were placed into a glass-bottom 6-well plate and mounted onto the hybrid OTLS microscope system for multi-scale imaging. (c) The ODO imaging path was used to rapidly screen multiple intact mouse brains containing metastatic colonies. (d) n = 34 total metastatic regions of interest (ROI) across all brains were identified and subsequently imaged at sub-micrometer resolution using the NODO imaging path (only one ROI per brain is shown for illustrative purposes). Visual inspection of a single brain with MDA-MB-231 metastases in (e) revealed multiple colonies distributed throughout the brain, with signs of vessel co-option (f-g) that were not observed for OS-RC-2 metastases. (h) To quantify these phenotypic differences between the MDA-MB-231 and OS-RC-2 metastases, the lumens spaces within the metastatic regions (cyan) and cancer cells (red) were computationally segmented and analyzed. (i) The volume to surface area ratio was computed for MDA-MB-231 ROIs (n = 16), and OS-RC-2 ROIs (n = 6). Quantification of the resulting segmentation masks revealed statistically different 3D growth patterns (p-value = 0.00025) between the two cancer cell lines, consistent with a previous report (i-j) [42]. (j) For MDA-MB-231 ROIs, the cancer cell density in ROIs of metastatic colonies (n = 11) and vessel co-option (n = 8) was found to be statistically different (p-value = 0.0058). The centerline and error bars in (i-j) denote the mean and standard deviation respectively, with the associated data points plotted. p-values in (i-j) were calculated using a two-sample t-test. Scale-bar lengths are as follows: (b-c) 1 cm, (d) 100 μm, (e) 1 mm, (f) 500 μm, and (g-h) 100 μm. All images are displayed without deconvolution. The imaging data in (c) was acquired from in a single experiment.

Comment in

  • Imaging cleared tissues made easy.
    Kanatani S, Uhlén P. Kanatani S, et al. Nat Methods. 2022 May;19(5):527-529. doi: 10.1038/s41592-022-01424-3. Nat Methods. 2022. PMID: 35545718 No abstract available.

References

References (Main Text)

    1. Chung K, et al. , Structural and molecular interrogation of intact biological systems. Nature, 2013. 497(7449): p. 332–7. - PMC - PubMed
    1. Tanaka N, et al. , Whole-tissue biopsy phenotyping of three-dimensional tumours reveals patterns of cancer heterogeneity. Nature Biomedical Engineering, 2017. 1(10): p. 796. - PubMed
    1. Richardson DS and Lichtman JW, Clarifying Tissue Clearing. Cell, 2015. 162(2): p. 246–57. - PMC - PubMed
    1. Pan C, et al. , Shrinkage-mediated imaging of entire organs and organisms using uDISCO. Nat Methods, 2016. 13(10): p. 859–67. - PubMed
    1. Renier N, et al. , iDISCO: a simple, rapid method to immunolabel large tissue samples for volume imaging. Cell, 2014. 159(4): p. 896–910. - PubMed

References (Online Methods)

    1. Barner LA, et al. , Solid immersion meniscus lens (SIMlens) for open-top light-sheet microscopy. Optics Letters, 2019. 44(18): p. 4451–4454. - PMC - PubMed
    1. Keller PJ, et al. , Fast, high-contrast imaging of animal development with scanned light sheet-based structured-illumination microscopy. Nat Methods, 2010. 7(8): p. 637–42. - PMC - PubMed
    1. Dunsby C, Optically sectioned imaging by oblique plane microscopy. Optics Express, 2008. 16(25): p. 20306–20316. - PubMed
    1. Botcherby EJ, et al. , An optical technique for remote focusing in microscopy. Optics Communications, 2008. 281(4): p. 880–887.
    1. Millett-Sikking A, et al. High NA single-objective light-sheet. 2019; Available from: https://andrewgyork.github.io/high_na_single_objective_lightsheet/index.....

Publication types