

QTL mapping of drought-related traits in the hybrids of Populus deltoides 'Danhong'×Populus simonii 'Tongliao1'
- PMID: 35545765
- PMCID: PMC9092850
- DOI: 10.1186/s12870-022-03613-w
QTL mapping of drought-related traits in the hybrids of Populus deltoides 'Danhong'×Populus simonii 'Tongliao1'
Abstract
Background: Poplar trees provide a large amount of wood material, but many parts of the world are arid or semi-arid areas because of insufficient annual precipitation, which seriously affects the growth of poplar trees. Populus simonii 'Tongliao1' shows strong tolerance to stress environments, and Populus deltoides 'Danhong' shows a stronger growth rate in a suitable environment. To identify drought tolerance-related QTLs and genes, an F1 population derived from the cross between the 'Danhong' and 'Tongliao 1' Populus was assessed under drought stress.
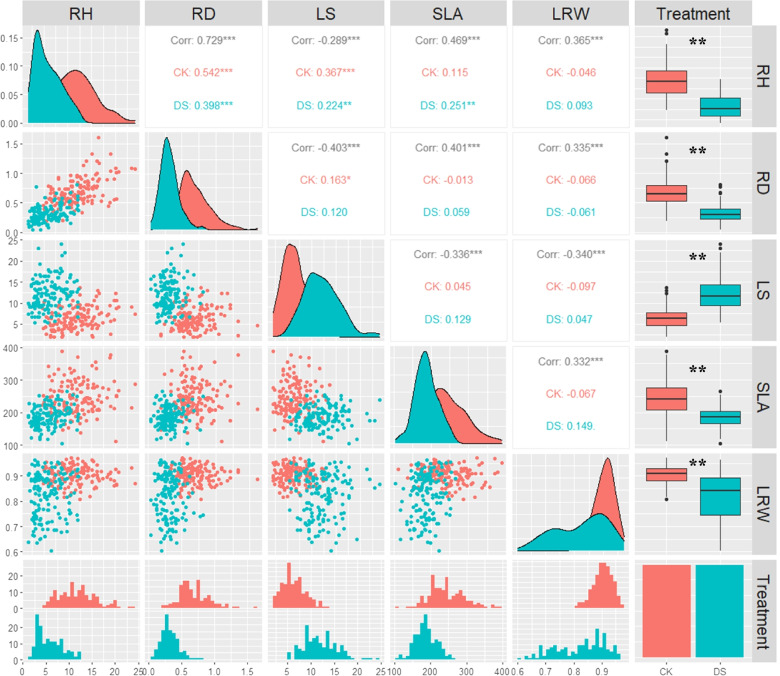
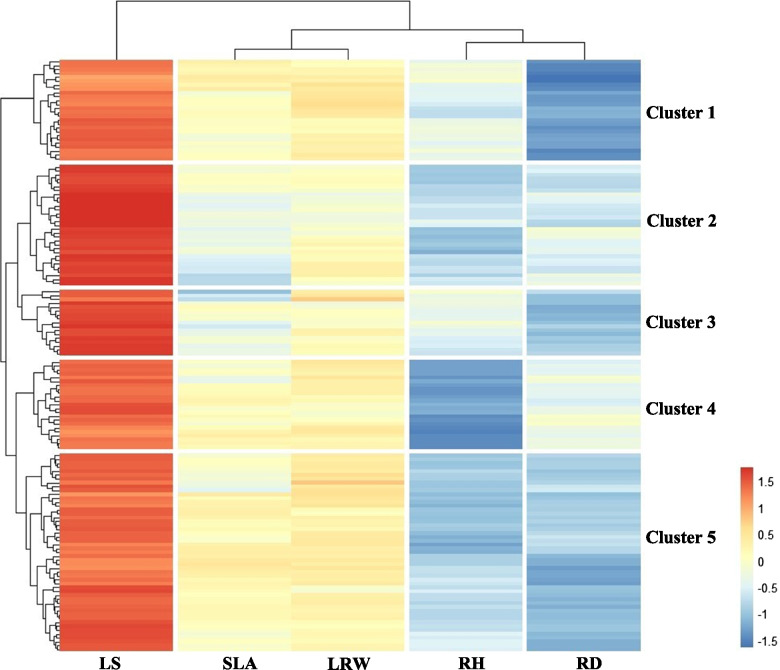
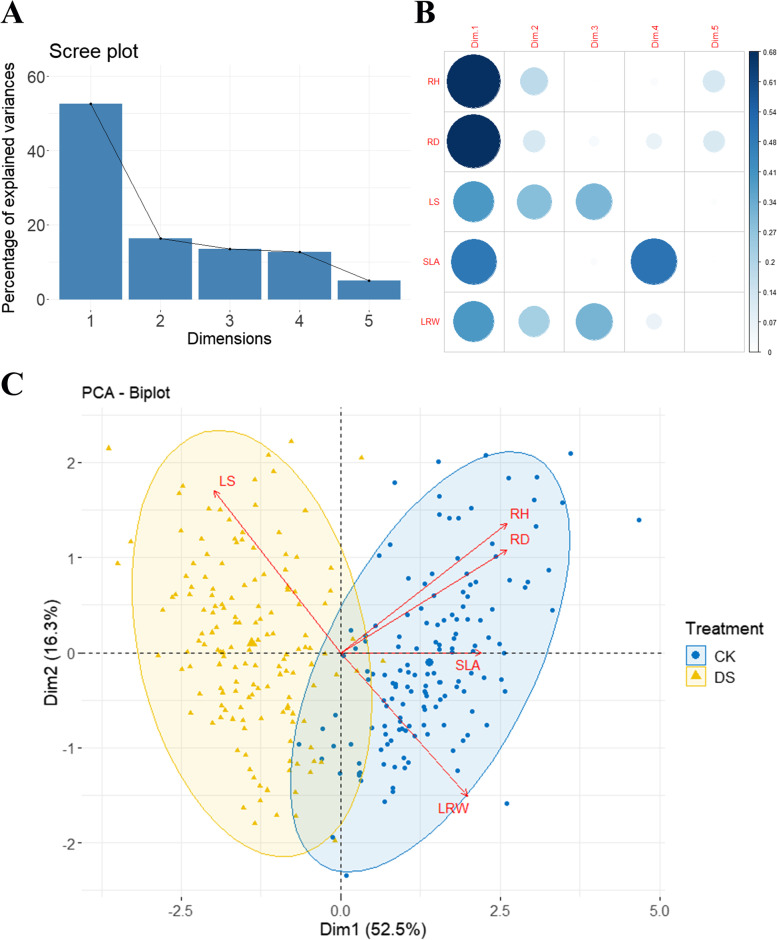
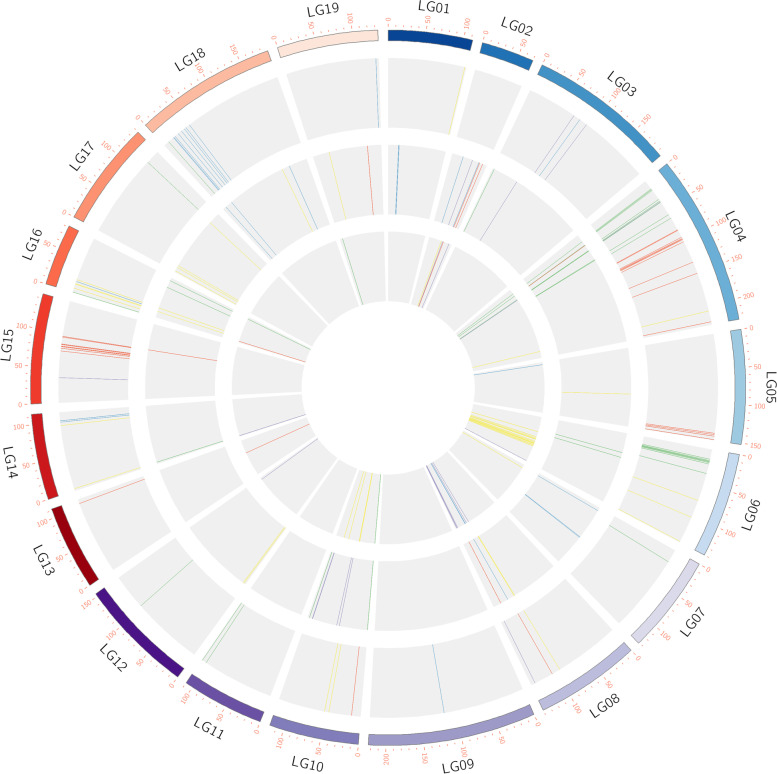
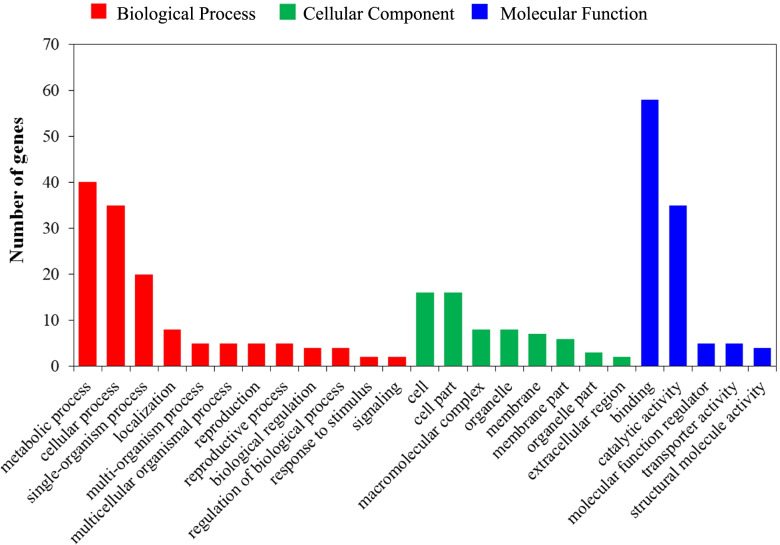
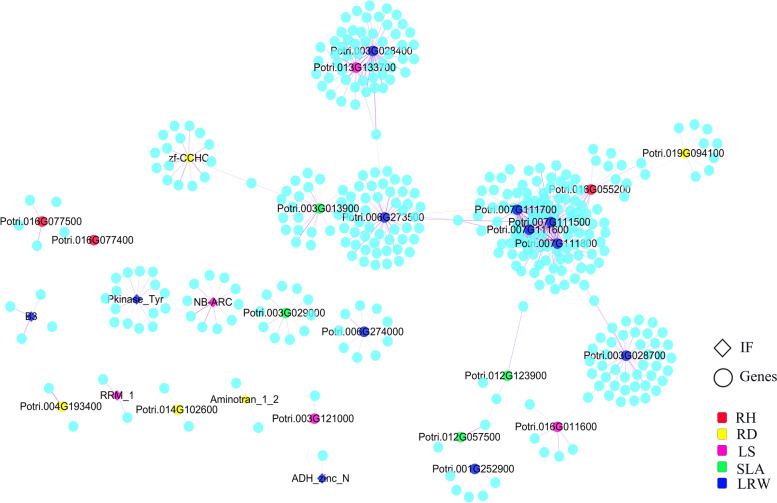
Results: We measured drought-related traits such as the relative height growth, relative diameter growth, leaf senescence number, specific leaf area, and leaf relative water content in the population under control and drought environments. The results showed that drought stress reduced the plant height relative growth, ground diameter relative growth, specific leaf area and leaf relative water content and increased the number of leaf drops. A total of 208 QTLs were identified by QTL mapping analysis, and they consisted of 92, 63 and 53 QTLs under control, drought stress treatment and drought index conditions, respectively. A molecular identification marker for drought tolerance, np2841, which was associated with a QTL (qDLRWC-LG10-1) for relative leaf water content, was initially developed. We mined 187 candidate genes for QTL regions of five traits under a drought environment. The reference genome annotation for Populus trichocarpa and a homologous gene analysis of Arabidopsis thaliana identified two candidate genes, Potri.003G171300 and Potri.012G123900, with significant functions in response to drought stress. We identified five key regulatory genes (Potri.006G273500, Potri.007G111500, Potri.007G111600, Potri.007G111700, and Potri.007G111800) related to drought tolerance through the poplar coexpression network.
Conclusion: In this study, our results indicate that the QTLs can effectively enhance the drought tolerance of poplar. It is a step closer towards unravelling the genetic basis of poplar drought tolerance-related traits, and to providing validated candidate genes and molecular markers for future genetic improvement.
Keywords: Coexpression network; Crossbreeding; Drought stress; Drought-related traits; Populus; QTL mapping.
© 2022. The Author(s).
Conflict of interest statement
The authors declare no conflicts of interest.
Figures
References
-
- Pinosio S, Giacomello S, Faivre-Rampant P, Taylor G, Jorge V, Le Paslier MC, Zaina G, Bastien C, Cattonaro F, Marroni F, et al. Characterization of the poplar Pan-genome by genome-wide identification of structural variation. Mol Biol Evol. 2016;33(10):2706–2719. doi: 10.1093/molbev/msw161. - DOI - PMC - PubMed
-
- Allen CD, Macalady AK, Chenchouni H, Bachelet D, McDowell N, Vennetier M, Kitzberger T, Rigling A, Breshears DD, Hogg EH, et al. A global overview of drought and heat-induced tree mortality reveals emerging climate change risks for forests. For Ecol Manag. 2010;259(4):660–684. doi: 10.1016/j.foreco.2009.09.001. - DOI
-
- He F, Wang H-L, Li H-G, Su Y, Li S, Yang Y, Feng C-H, Yin W, Xia X. PeCHYR1, a ubiquitin E3 ligase from Populus euphratica, enhances drought tolerance via ABA-induced stomatal closure by ROS production in Populus. Plant Biotechnol J. 2018;16(8):1514–1528. doi: 10.1111/pbi.12893. - DOI - PMC - PubMed
MeSH terms
Substances
Grants and funding
- 2021YFD2200201/National Key Research and Development Program of China
- 2021YFD2200201/National Key Research and Development Program of China
- 2021YFD2200201/National Key Research and Development Program of China
- 2021YFD2200201/National Key Research and Development Program of China
- 2021YFD2200201/National Key Research and Development Program of China
- 2021YFD2200201/National Key Research and Development Program of China
- 32071797, 31570669/National Natural Science Foundation
- 32071797, 31570669/National Natural Science Foundation
- 32071797, 31570669/National Natural Science Foundation
- 32071797, 31570669/National Natural Science Foundation
- 32071797, 31570669/National Natural Science Foundation
- 32071797, 31570669/National Natural Science Foundation
- 2018ZX08020002/National Key Program on Transgenic Research
- 2018ZX08020002/National Key Program on Transgenic Research
- 2018ZX08020002/National Key Program on Transgenic Research
- 2018ZX08020002/National Key Program on Transgenic Research
- 2018ZX08020002/National Key Program on Transgenic Research
- 2018ZX08020002/National Key Program on Transgenic Research
LinkOut - more resources
Full Text Sources
