. 2022 Jun 28;7(3):e0015622.
doi: 10.1128/msystems.00156-22. Epub 2022 May 12.

Pseudomonas aeruginosa Alters Peptidoglycan Composition under Nutrient Conditions Resembling Cystic Fibrosis Lung Infections

Affiliations

Pseudomonas aeruginosa Alters Peptidoglycan Composition under Nutrient Conditions Resembling Cystic Fibrosis Lung Infections

Erin M Anderson et al. mSystems. .

Abstract

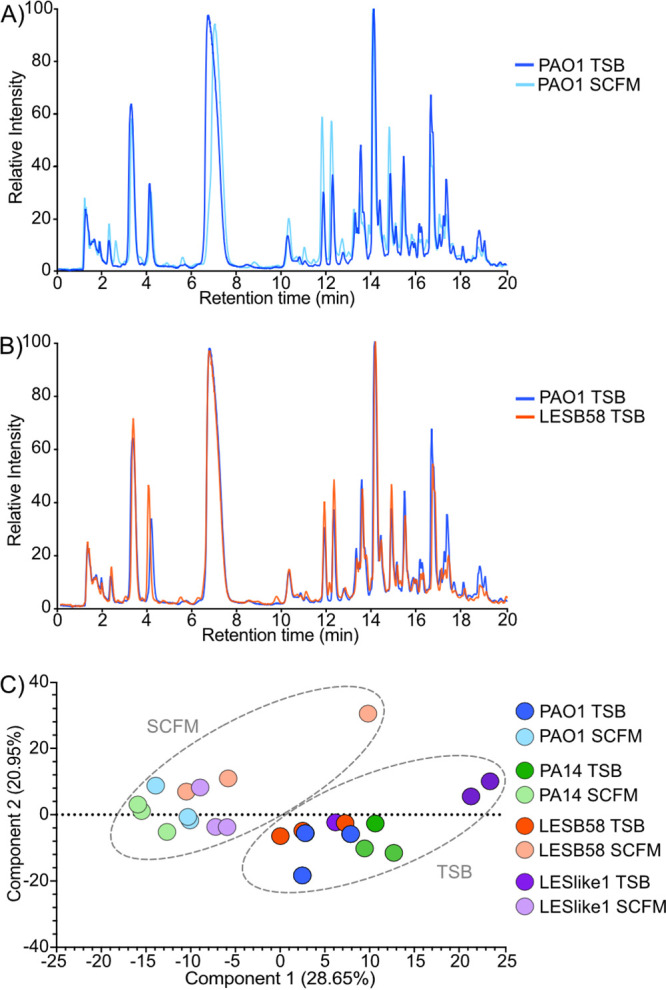
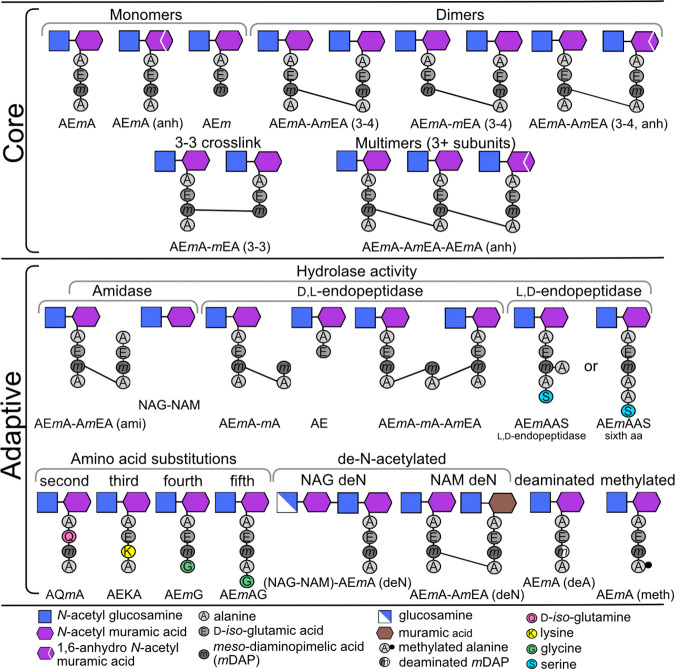
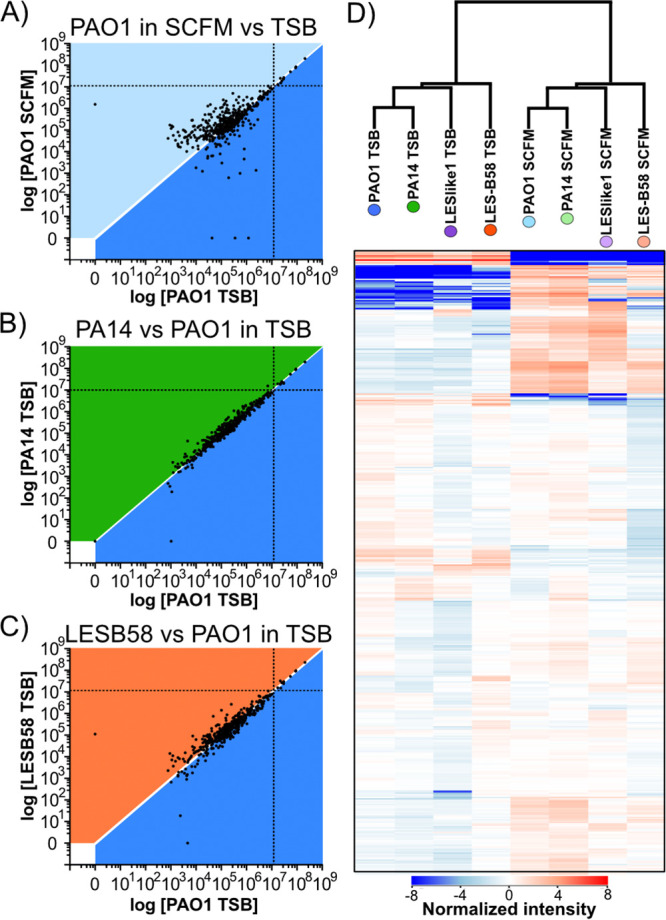
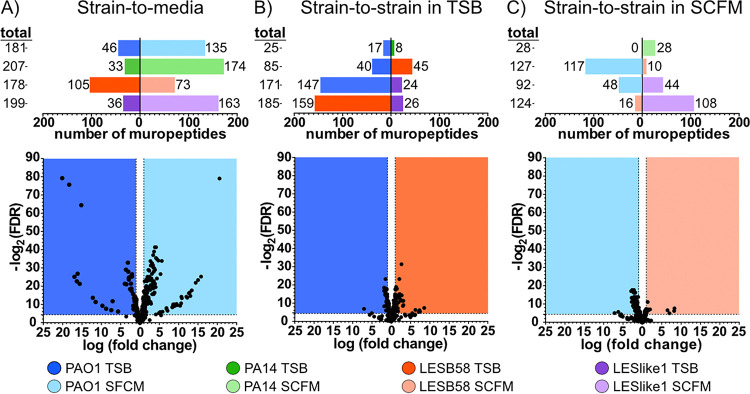
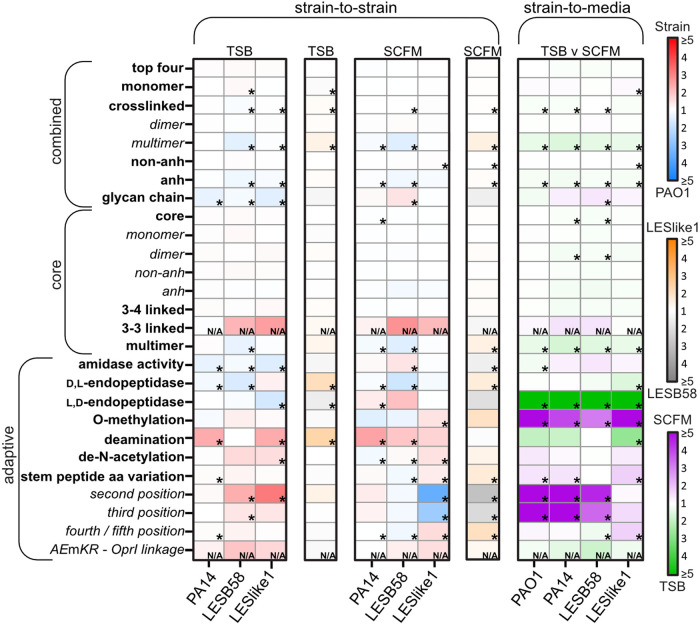
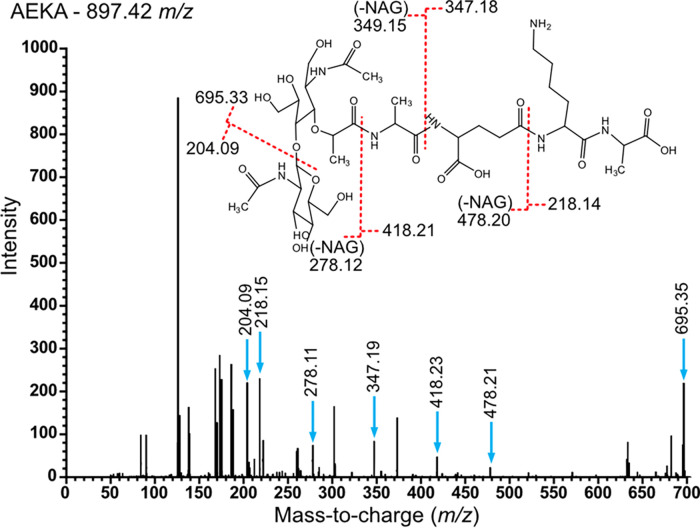
Epidemic strains of Pseudomonas aeruginosa are highly virulent opportunistic pathogens with increased transmissibility and enhanced antimicrobial resistance. Understanding the cellular mechanisms behind this heightened virulence and resistance is critical. Peptidoglycan (PG) is an integral component of P. aeruginosa cells that is essential to its survival and a target for antimicrobials. Here, we examined the global PG composition of two P. aeruginosa epidemic strains, LESB58 and LESlike1, and compared them to the common laboratory strains PAO1 and PA14. We also examined changes in PG composition when the strains were cultured under nutrient conditions that resembled cystic fibrosis lung infections. We identified 448 unique muropeptides and provide the first evidence for stem peptides modified with O-methylation, meso-diaminopimelic acid (mDAP) deamination, and novel substitutions of mDAP residues within P. aeruginosa PG. Our results also present the first evidence for both d,l- and l,d-endopeptidase activity on the PG sacculus of a Gram-negative organism. The PG composition of the epidemic strains varied significantly when grown under conditions resembling cystic fibrosis (CF) lung infections, showing increases in O-methylated stem peptides and decreases in l,d-endopeptidase activity as well as an increased abundance of de-N-acetylated sugars and l,d-transpeptidase activity, which are related to bacterial virulence and antibiotic resistance, respectively. We also identified strain-specific changes where LESlike1 increased the addition of unique amino acids to the terminus of the stem peptide and LESB58 increased amidase activity. Overall, this study demonstrates that P. aeruginosa PG composition is primarily influenced by nutrient conditions that mimic the CF lung; however, inherent strain-to-strain differences also exist. IMPORTANCE Using peptidoglycomics to examine the global composition of the peptidoglycan (PG) allows insights into the enzymatic activity that functions on this important biopolymer. Changes within the PG structure have implications for numerous physiological processes, including virulence and antimicrobial resistance. The identification of highly unique PG modifications illustrates the complexity of this biopolymer in Pseudomonas aeruginosa. Analyzing the PG composition of clinical P. aeruginosa epidemic strains provides insights into the increased virulence and antimicrobial resistance of these difficult-to-eradicate infections.

Keywords: Liverpool epidemic strain; Pseudomonas aeruginosa; antibiotic resistance; peptidoglycan; peptidoglycomics.


Conflict of interest statement

The authors declare no conflict of interest.

Figures

FIG 1
FIG 1
Gross peptidoglycan variations between samples. (A) The total ion chromatograph (TIC) from Q-TOF mass spectrometry of one technical replicate of PAO1 grown in TSB (dark blue) overlaid with the TIC of one technical replicate of PAO1 grown in SCFM (light blue). (B) The same TIC of PAO1 grown in TSB (dark blue) in panel A overlaid with one technical replicate of LESB58 grown in TSB (dark orange). (C) The principal-component analysis comparing all samples. Individual strains are designated by a color: PAO1 (blue), PA14 (green), LESB58 (orange), and LESlike1 (purple). The two growth media are designated by the intensity of color: TSB (dark) and SCFM (light). The gray dashed circles highlight the principal components that cluster together based on growth media.
FIG 2
FIG 2
Graphical representation of the muropeptides identified in the peptidoglycan (PG) of P. aeruginosa in this study. Muropeptides were grouped as part of the core or adaptive PG. The six muropeptides at the top of the table represent the core of the PG on which modifications occurred. Modifications considered still part of the core were the change to a 3–3 cross-link and production of multimers. Adaptative PG were modifications to the core that occurred either singly or in combination.
FIG 3
FIG 3
Abundance variations of muropeptides across samples. (A to C) Representative scatterplots of the log raw intensity values between samples. Each dot represents the raw intensity value of a single putative muropeptide measured within each sample plotted on the x and y axes. The white line where x = y represents intensity values that were similar in both samples. Each section is colored to represent where intensity values would represent an increase in abundance in one sample, with PAO1 grown in TSB (dark blue) compared to PAO1 grown in SCFM (light blue) (A), PA14 grown in TSB (dark green) (B), or LESB58 grown in TSB (dark orange) (C). The black vertical and horizontal dotted lines are the raw intensity value, which represents 1% of the total PG in the sample designated on the x and y axes, respectively. (D) Hierarchical clustering analysis on intensity values that were normalized to the median intensity across all samples. Red represents an increase in intensity and blue represents a decrease in intensity from the median. Each column represents a sample, and each band represents a single putative muropeptide within the sample. Muropeptides were clustered vertically in the column based on similarities in the intensity variations. Samples were then clustered based on overall muropeptide abundance variations. Additional scatterplots can be found in Fig. S2.
FIG 4
FIG 4
Comparison of muropeptide variation across samples. Volcano plot comparisons were conducted pairwise between samples to illustrate peptidoglycan variations that occurred due to growth media (A) or occurred between strains when grown in TSB (B) or SCFM (C). (Top) Number of muropeptides that had a significantly high fold change (FDR < 0.05; FC > 2) between two samples. The total numbers of muropeptides are listed on the left side of the panel, whereas the bars indicate the numbers of muropeptides that were increased in abundance in each sample. The bottom panel is a representative volcano plot used to produce the top panel, illustrating the level of FDR and FC for each putative muropeptide (dot). Additional volcano plots can be found in Fig. S3.
FIG 5
FIG 5
Heat map of the abundance fold changes between strain-to-strain and strain-to-medium conditions. Each box represents a group of muropeptides that contain the specified modification indicated on the left. Within the strain-to-strain comparisons, red to blue represents the comparison of each strain (red) indicated at the bottom to PAO1 (blue), whereas gold to silver represents the comparison between LESB58 (gold) and LESlike1 (silver). For the strain-to-medium comparison, green to purple represents the comparison of growth in SCFM (purple) and TSB (green) medium within each strain indicated at the bottom. The asterisk represents a significant 1D annotation for that group of muropeptides (FDR < 0.05, s0 = 1). N/A represents a group with only 1 to 2 muropeptides; therefore, significance could not be assessed with 1D annotation.
FIG 6
FIG 6
Example MS/MS spectrum for the annotation of the putative muropeptide AEKA. (Inset) The MS/MS spectra were compared to the predicted fragmentation of the AEKA structure. The predicted m/z fragments resulting from breakage occurring at the red dotted lines on the inset were compared to the peaks found in the MS/MS spectra (blue arrows). An additional spectrum is in Fig. S4.

Similar articles

Cited by

References

    1. Cystic Fibrosis Foundation. 2020. Cystic fibrosis foundation patient registry 2019 annual data report. Cystic Fibrosis Foundation, Bethesda, MD.
    1. Botelho J, Grosso F, Peixe L. 2019. Antibiotic resistance in Pseudomonas aeruginosa–mechanisms, epidemiology and evolution. Drug Resist Updat 44:100640. doi:10.1016/j.drup.2019.07.002. - DOI - PubMed
    1. Cheng K, Smyth RL, Govan JRW, Doherty C, Winstanley C, Denning N, Heaf DP, van Saene H, Hart CA. 1996. Spread of β-lactam-resistant Pseudomonas aeruginosa in a cystic fibrosis clinic. Lancet 348:639–642. doi:10.1016/S0140-6736(96)05169-0. - DOI - PubMed
    1. Aaron SD, Vandemheen KL, Ramotar K, Giesbrecht-Lewis T, Tullis E, Freitag A, Paterson N, Jackson M, Lougheed MD, Dowson C, Kumar V, Ferris W, Chan F, Doucette S, Fergusson D. 2010. Infection with transmissible strains of Pseudomonas aeruginosa and clinical outcomes in adults with cystic fibrosis. JAMA 304:2145–2153. doi:10.1001/jama.2010.1665. - DOI - PubMed
    1. Parkins MD, Glezerson BA, Sibley CD, Sibley KA, Duong J, Purighalla S, Mody CH, Workentine ML, Storey DG, Surette MG, Rabin HR. 2014. Twenty-five-year outbreak of Pseudomonas aeruginosa infecting individuals with cystic fibrosis: identification of the prairie epidemic strain. J Clin Microbiol 52:1127–1135. doi:10.1128/JCM.03218-13. - DOI - PMC - PubMed

Publication types