. 2022 May 11;12(1):7784.
doi: 10.1038/s41598-022-11582-1.

Neurophysiological effects of human-derived pathological tau conformers in the APPKM670/671NL.PS1/L166P amyloid mouse model of Alzheimer's disease

Affiliations

Neurophysiological effects of human-derived pathological tau conformers in the APPKM670/671NL.PS1/L166P amyloid mouse model of Alzheimer's disease

S Tok et al. Sci Rep. .

Abstract

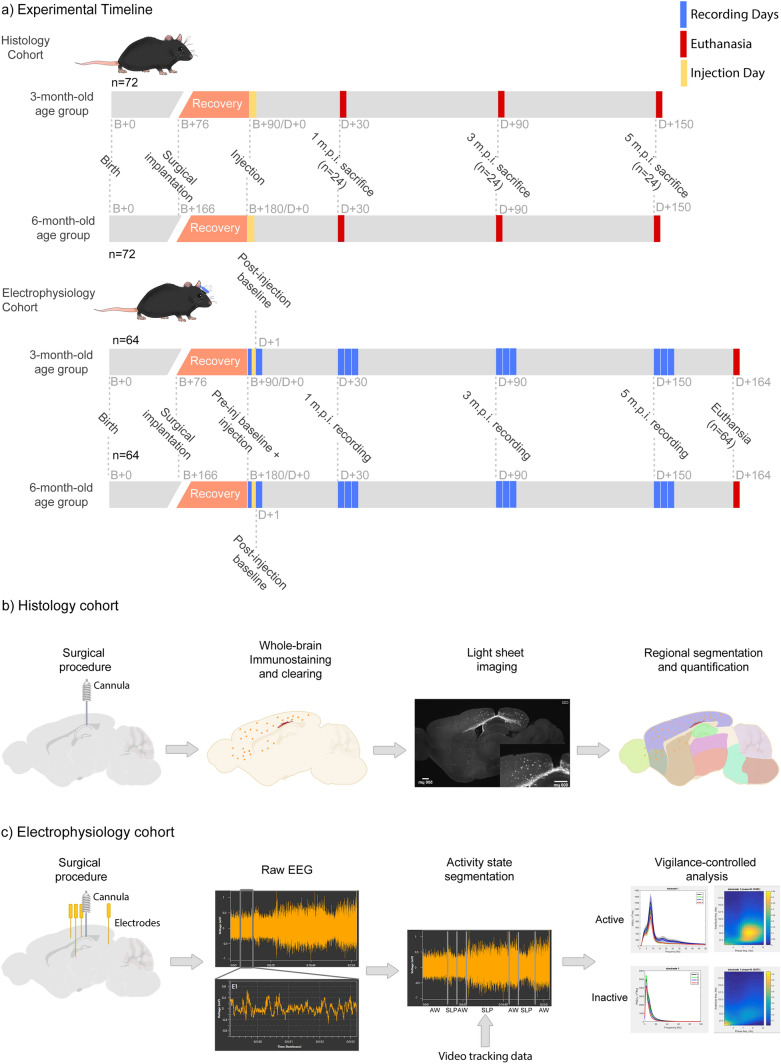
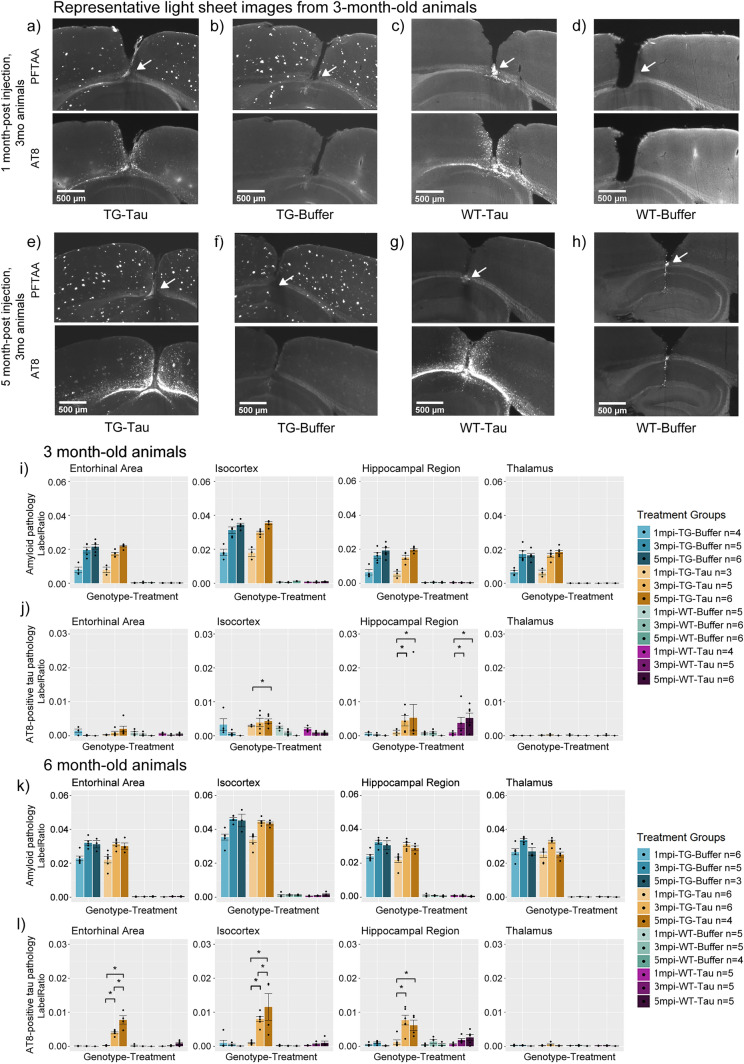
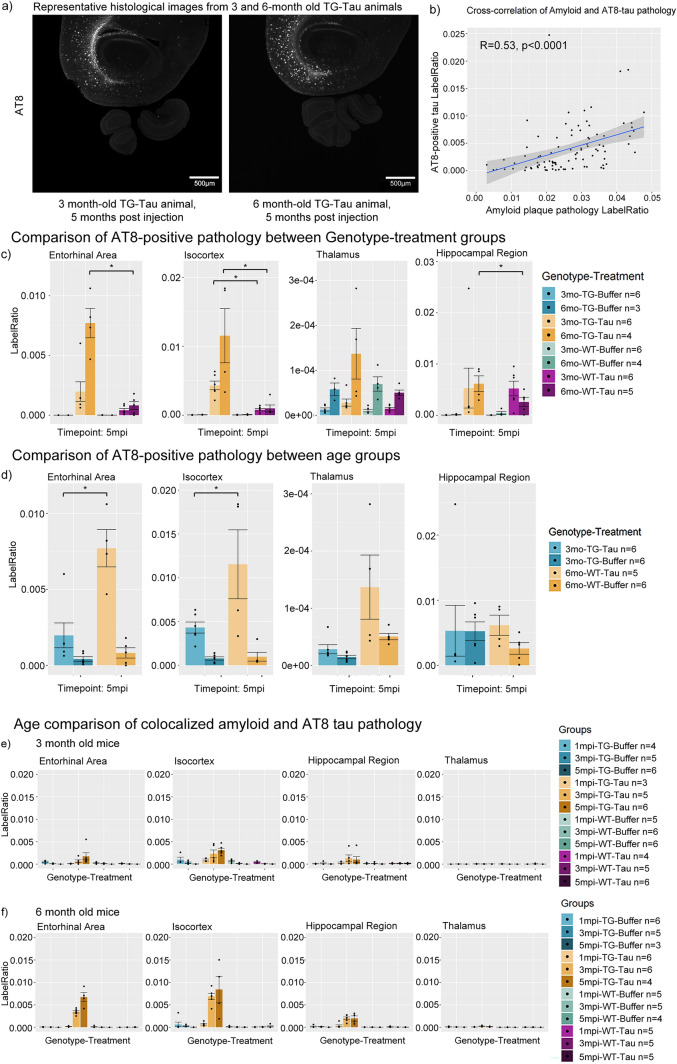
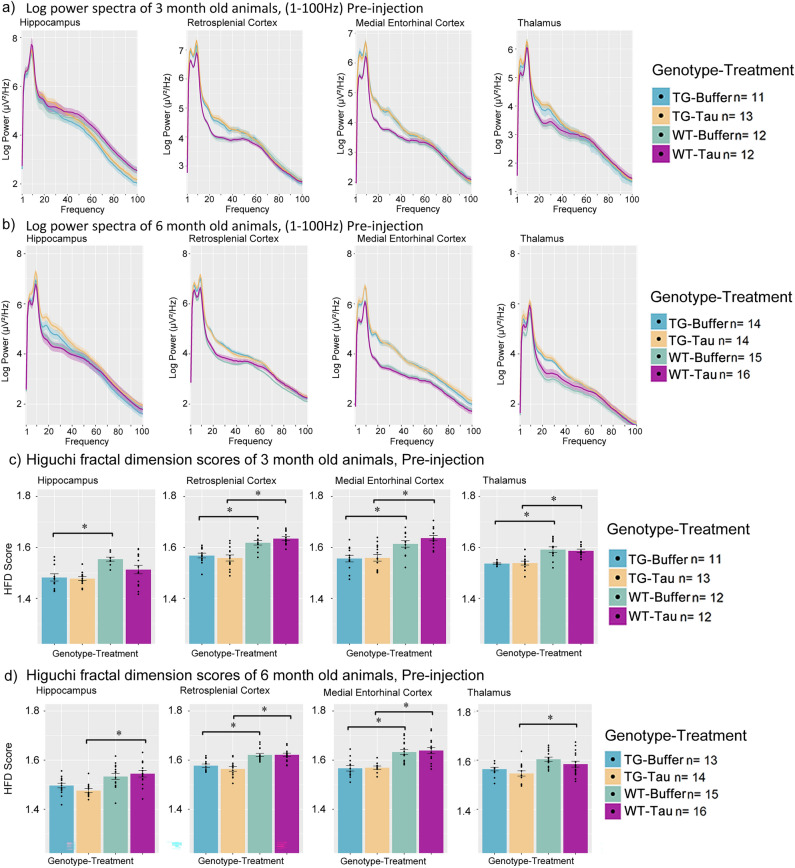
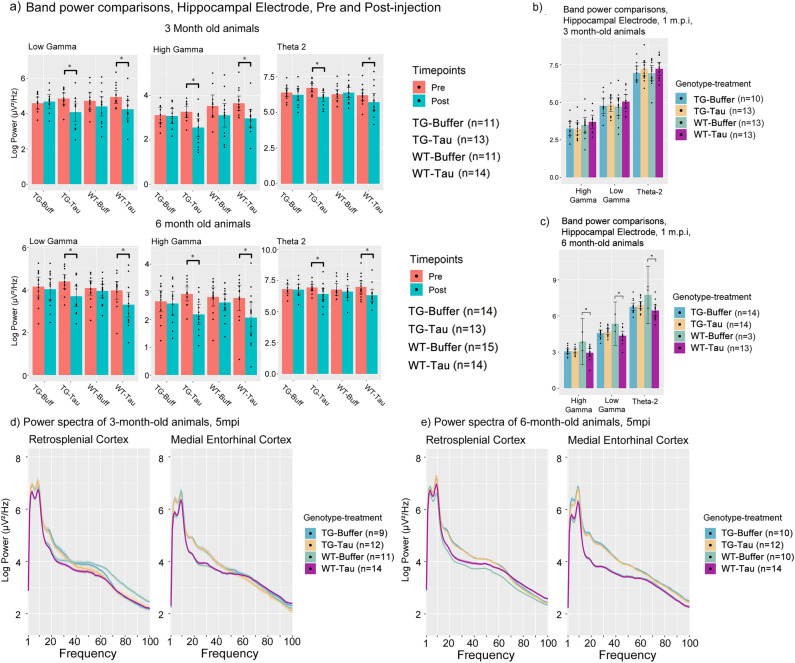
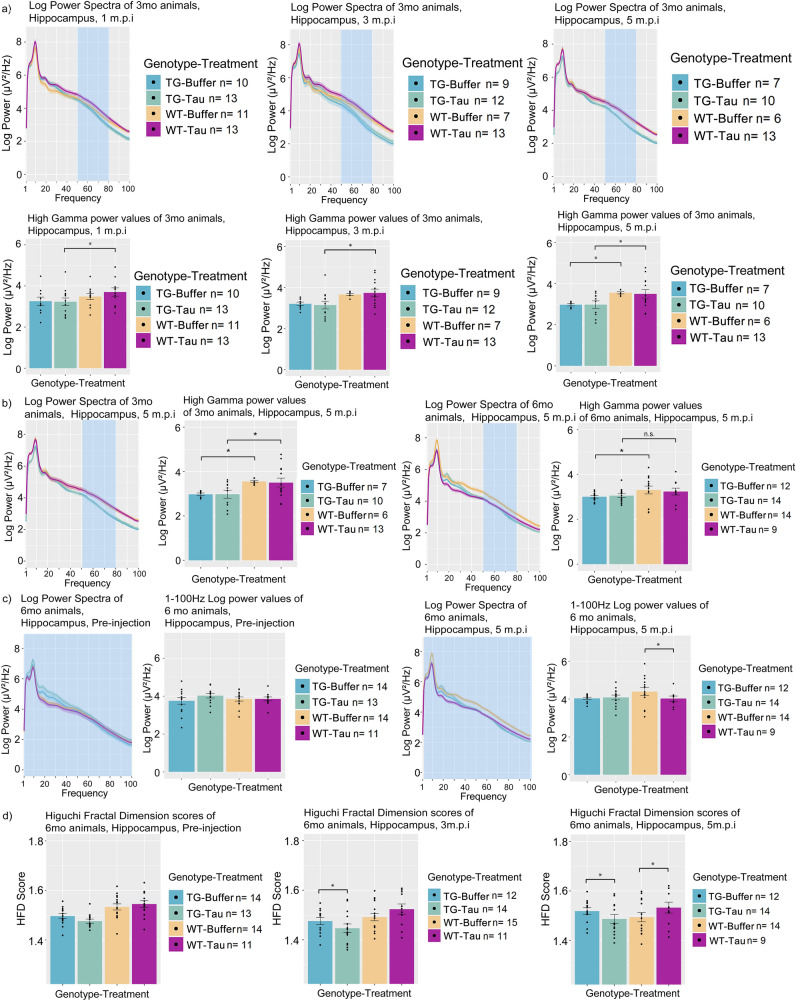
Alzheimer's Disease (AD) is a neurodegenerative disease characterized by two main pathological hallmarks: amyloid plaques and intracellular tau neurofibrillary tangles. However, a majority of studies focus on the individual pathologies and seldom on the interaction between the two pathologies. Herein, we present the longitudinal neuropathological and neurophysiological effects of a combined amyloid-tau model by hippocampal seeding of human-derived tau pathology in the APP.PS1/L166P amyloid animal model. We statistically assessed both neurophysiological and pathological changes using linear mixed modelling to determine if factors such as the age at which animals were seeded, genotype, seeding or buffer, brain region where pathology was quantified, and time-post injection differentially affect these outcomes. We report that AT8-positive tau pathology progressively develops and is facilitated by the amount of amyloid pathology present at the time of injection. The amount of AT8-positive tau pathology was influenced by the interaction of age at which the animal was injected, genotype, and time after injection. Baseline pathology-related power spectra and Higuchi Fractal Dimension (HFD) score alterations were noted in APP.PS1/L166P before any manipulations were performed, indicating a baseline difference associated with genotype. We also report immediate localized hippocampal dysfunction in the electroencephalography (EEG) power spectra associated with tau seeding which returned to comparable levels at 1 month-post-injection. Longitudinal effects of seeding indicated that tau-seeded wild-type mice showed an increase in gamma power earlier than buffer control comparisons which was influenced by the age at which the animal was injected. A reduction of hippocampal broadband power spectra was noted in tau-seeded wild-type mice, but absent in APP.PS1 animals. HFD scores appeared to detect subtle effects associated with tau seeding in APP.PS1 animals, which was differentially influenced by genotype. Notably, while tau histopathological changes were present, a lack of overt longitudinal electrophysiological alterations was noted, particularly in APP.PS1 animals that feature both pathologies after seeding, reiterating and underscoring the difficulty and complexity associated with elucidating physiologically relevant and translatable biomarkers of Alzheimer's Disease at the early stages of the disease.


Conflict of interest statement

The authors declare that they are working for Janssen Pharmaceutica NV. The authors declare no other commercial or financial relationships that could be construed as a potential conflict of interest.

Figures

Figure 1
Figure 1
Overview of experimental design and analysis. (a) Visual timeline of experimental animal cohorts and initial number of animals in each cohort. Mice were instrumented with an electrophysiological montage and cannula or only a cannula at least 2 weeks prior to AD-tau seed injections. Mice were subsequently injected at 90 or 180 days after birth with AD-tau or buffer solutions and sacrificed or recorded at different timepoints (m.p.i. refers to months post injection). (b) Histological evaluation of pathology was carried out using brain clearance and immunohistological staining, followed by light-sheet imaging and image segmentation and quantification. (c) Sagittal illustration of the recording montage and analysis pipeline prior to quantitative analysis.
Figure 2
Figure 2
Representative histological images of APP.PS1 animals and wild-type littermates at 1- and 5- m.p.i. together with quantification of amyloid and tau pathology. (a)–(d) Representative histological images of 3-month-old APP.PS1 animals injected with (a) AD-tau or (b) Buffer, and wild type littermates injected with (c) AD-tau or (d) Buffer at 1 month-post injection. (e)–(h) Representative histological images of 3-month-old APP.PS1 animals injected with (e) AD-tau or (f) Buffer and wild type littermate injected with (g) AD-tau or (h) Buffer at 5 m.p.i. White arrows indicate site of injection. Bar plots of 3-month-old animals in terms of (i) Amyloid and (j) tau pathology across 5 months-post-injection. Bar plots of 6-month-old animals in terms of (k) Amyloid and (l) tau pathology across 5 months-post-injection. Significant comparisons across time indicate a progressive increase in AT8-positive tau pathology. (m.p.i. refers to months post injection). Asterisks indicate significant comparisons (p < 0.05). White arrows indicate the site of injection (i.e., the hippocampus).
Figure 3
Figure 3
(a) Representative images of AT8 pathology at 5 m.p.i. in mice injected with AD-tau seeds at 3 and 6 months of age. (b) Cross-correlation of amyloid and tau pathology pooling the hippocampal region, isocortex and entorhinal area at both 3 and 6 months of age (R = 0.53, p < 0.0001). (c) Bar plots comparisons of AT8-positive tau pathology between genotype-treatment groups at 5 months post injection. APP.PS1 animals exhibit significantly more AT8-positive tau pathology than wild-type animals in the isocortex and entorhinal cortex. (d) Comparison of AT8-positive tau pathology in APP.PS1 animals between age groups at 5 months post injection. Older APP.PS1 animals exhibit significantly more AT8 pathology compared to younger animals when controlling for same time post-injection. (e) Bar plot comparisons of AT8-positive tau pathology colocalized with amyloid pathology in 3-month-old animals, and (f) 6-month-old animals. (m.p.i. refers to months post injection). Asterisks indicate significant comparisons (p < 0.05).
Figure 4
Figure 4
Power spectrum and fractal dimension baseline measures of 3-month-old APP.PS1 and wild-type animals across the hippocampus, retrosplenial cortex, medial entorhinal cortex and thalamus. Log power spectra of APP.PS1 animals and wild-type animals from 1-100 Hz at Pre-injection for (a) 3-month-old and (b) 6-month-old animals. Bar plots of fractal dimension scores of (c) 3-month-old and (d) 6-month-old animals at Pre-injection. (m.p.i. refers to months post injection). All bar plots are Mean + SEM. Asterisks indicate significant comparisons (p < 0.05).
Figure 5
Figure 5
A comparison of power values immediately after and before AD-tau injection as well as power values at 1 m.p.i. (a) Log power bar plots from 3-and 6-month-old animals showing immediate changes in Theta 2, Low and High Gamma power at Pre-injection (Pre) and Post-injection (Post). (b) Bar plot comparisons of 3-month-old animals for each of the bands investigated for pre- and post-injection changes in power spectra at 1 m.p.i. (c) Bar plot comparisons of 6-month-old animals for each of the bands investigated for pre- and post-injection changes in power spectra at 1 m.p.i. (Due to the impact of Covid-19 lockdowns, several datapoints from the 6-month-old 1 m.p.i. timepoint for WT- Buffer group could not be obtained, thus resulting in n = 3). Log Power spectra from 1 to 100 Hz of the retrosplenial cortex of (d) 3-month-old animals and (e) 6-month-old animals at 5 months post injection. (m.p.i. refers to months post injection). All bar plots are Mean + SEM. Asterisks indicate significant comparisons (p < 0.05).
Figure 6
Figure 6
Longitudinal power spectra comparisons and Higuchi fractal dimension score comparisons (a) Log power spectra and accompanying bar plots from 3-month-old animals showing longitudinal change in high gamma power across 5 m.p.i. and treatment-genotype groups. Blue regions indicate the region of the power spectra used for the plotting of bar plots. (b) Bar plot comparisons of 3-month-old and 6-month-old animals for high gamma power. (c) Whole power spectra (1-100 Hz) comparison between 6-month-old animals at 5 m.p.i. and pre-injection. (d) Higuchi fractal dimension score bar plots of the hippocampus of 6-month-old animals at pre-injection, 3 and 5 m.p.i. (m.p.i. refers to months post injection). All bar plots are Mean + SEM. Asterisks indicate significant comparisons (p < 0.05).

References

    1. Braak H, Braak E. Neuropathological stageing of Alzheimer-related changes. Acta Neuropathol. (Berl.) 1991;82:239–259. doi: 10.1007/BF00308809. - DOI - PubMed
    1. Thal DR, Rüb U, Orantes M, Braak H. Phases of a beta-deposition in the human brain and its relevance for the development of AD. Neurology. 2002;58:1791–1800. doi: 10.1212/WNL.58.12.1791. - DOI - PubMed
    1. Ahnaou, A., Walsh, C., Manyakov, N. V., Youssef, S. A. & Drinkenburg, W. H. Early electrophysiological disintegration of hippocampal neural networks in a novel locus coeruleus tau-seeding mouse Model of Alzheimer’s disease. Neural Plast.2019, (2019). - PMC - PubMed
    1. Bazzigaluppi P, et al. Early-stage attenuation of phase-amplitude coupling in the hippocampus and medial prefrontal cortex in a transgenic rat model of Alzheimer’s disease. J. Neurochem. 2018;144:669–679. doi: 10.1111/jnc.14136. - DOI - PubMed
    1. Nakazono T, et al. Impaired in vivo gamma oscillations in the medial entorhinal cortex of knock-in Alzheimer model. Front. Syst. Neurosci. 2017;11:48. doi: 10.3389/fnsys.2017.00048. - DOI - PMC - PubMed

Publication types