. 2023 Jan;6(1):e1625.
doi: 10.1002/cnr2.1625. Epub 2022 May 11.

The early-life stress induced by oxytocin inhibition in p53 knockout mouse dams increases adulthood tumorigenesis in first and second generations

Affiliations

The early-life stress induced by oxytocin inhibition in p53 knockout mouse dams increases adulthood tumorigenesis in first and second generations

Massimo Stendardo et al. Cancer Rep (Hoboken). 2023 Jan.

Abstract

Background: Early-life stress due to poor parental care has been suggested to increase cancer risk, though, so far, no experimental evidence established a link between defective parental behavior and spontaneous tumorigenesis in progeny. Essential maternal behavior is regulated, in particular, by the oxytocin (OT) hormonal circuit, which in turn responds to stimuli from the offspring and impinges on the central nervous systems.

Methods: By providing L-368,899 OT receptor (OTR) inhibitor to lactating mothers, we set up a model of defective maternal care in p53 knockout mice.

Results: The progeny of these dams showed, later in life, higher cortisol levels, shortened life span and increased tumorigenic potential of bone marrow cells (BMC). Notably, these phenotypes were transmitted to the following generation.

Conclusions: Therefore, the inhibition of OT function in mothers is a novel paradigm of early-life stress that is inherited across generations and increases cancer risk in tumor-prone mice.

Keywords: cancer risk factor; early-life stress; oxytocin; p53 KO mice; parental care.


Conflict of interest statement

The authors have stated explicitly that there are no conflicts of interest in connection with this article.

Figures
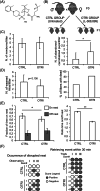
FIGURE 1
FIGURE 1
Effect of OTR inhibition on maternal behavior and fertility. (A), molecular structure of the L‐368,899 OTR inhibitor (Tocris bioscience). (B) Scheme of the matings, indicating the two experimental groups, treated (OTRI) or not (CTRL) with L‐368,899 and the two derived progeny groups. (C), average numerosity of litters at birth (left panel) and average number of cannibalized or abandoned puppies per litter from the birth to the weaning (right panel) in the two groups (n = 12 litters; *p < .05). (D), average number of weaned mice per litter (n = 12 litters; p = .136 for the effect of the treatment—left panel) and right panel, percentage of litters with at least one dead pup in the two groups (n = 12). (E), average fraction (left panel) of time spent in the nest (white bars) or out of the nest (gray bars) by the dams of the CTRL or OTRI groups (n = 8 dams for two replicated observations; *p < .05) and resulting ratio of time (right panel) spent on or off the nest (**p ± <.01). (F), scores of the tests investigating the occurrence of disrupted nest (left panel, n = 3 dams observed in triplicates, p = .051) and of recomposed nest within 30 min after dismantling it (right panel, n = 4 dams observed in triplicates, *p < .05) in the two groups as indicated
FIGURE 2
FIGURE 2
Effect of OTR inhibition on progeny growth and serum cortisol concentration. (A), average body weights of 2 weeks old puppies of the two groups from 4 litters each. (B), body weight of males (left panel; including unclear sex individuals at time 2 weeks) and females (right panel) mice of OTRI (red curves) and CTRL (black curves) groups (n = 9 mice); group effect at weaning (time point 3 weeks) for both sex = 0.054. (C), average daily food consumption per mouse at 1 and 2 months of age for the two groups. (D), basal glycemia in 3 months old p53−/− mice in the two groups (n = 4). (E), average serum cortisol levels in basal conditions (in two consecutive bleedings). (F), average serum cortisol levels before and after restraint challenge (F) in 3 months old p53−/− male mice (n = 4), (*p < .05 and **p < .01 for the effects of groups)
FIGURE 3
FIGURE 3
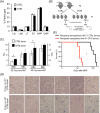
Effect of OTR inhibition on progeny survival and tumor spectrum. Kaplan–Meier survival curves of p53−/− males (A, reporting the estimates of median survival—MS and average life span—AvMS, ***Gehan‐Breslow‐Wilconox test p = .0009 or longrank Mantel‐Cox test p = .0003) and females (B, *Gehan‐Breslow‐Wilconox Test p = .015) of the OTRI (red lines) or CTRL (black lines); The dashed thick black curve in the panel A indicate the survival data of a parallel cohort of p53−/− male mice belonging to the breeding colony as further external control. C, thymus and spleen weights and tumor mass description from the necroscopic reports of OTRI and CTRL p53−/− male mice spontaneously dead during the survival experiments. D, morphology of the largest thymus masses and spleens collected from the mice in the two groups (left panel). Representative immunohistochemical images (right panel) of thymus (HE and anti‐Ki‐67 antibody) and spleen (HE and anti‐AIF‐1 antibody), from the OTRI and CTRL p53−/− mice
FIGURE 4
FIGURE 4
Composition and tumorigenic potential upon transplantation of OTRI and CTRL BMC. (A), flow cytometric analysis of bone marrow subpopulations in OTRI and CTRL p53−/− mice; lineage markers negative (Lin), LinSca‐1+c‐Kit+ (LSK), Linc‐Kit+Sca‐1+Flk2CD34 long‐term (LT) and Linc‐Kit+Sca‐1+Flk2CD34+ short‐term (ST) hemopoietic stem cells, Linc‐Kit+Sca‐1+Flk2+ multipotent (MPP) and Linc‐Kit+Sca‐1CD34+ common myeloid (CMP) progenitors. (B), scheme of the bone marrow transplantation (BMT) experiment of OTRI and CTRL p53−/− groups of mice. (C) Average white (WBC) and red (RBC) blood cell counts, in peripheral blood of recipient mice at 20 or 40 days after BMC transplantation with OTRI (black bars) and CTRL (white bars) donor mice (n = 6, *p < .05). (D) Representative images of Giemsa stain of peripheral blood smears collected at 20 days from the 6 recipient mice transplanted with BMC from the OTRI and CTRL. (E), Kaplan–Meier survival curves of recipient mice after bone marrow transplantation with BMC from the OTRI (red lines) or CTRL (black lines) mice (n = 6, *Gehan‐Breslow‐Wilconox Test p = .014)
FIGURE 5
FIGURE 5
Phenotypic analysis of second generation of OTRI treated dams. (A), scheme of the genealogy of OTRI and CTRL groups with the different generations investigated (F0, breeders treated with the OTR inhibitor; F1, first generation and F2, second generation) and the transplantation experiment (BMT) from donors of the F2. (B), ratio of time spent on or off the nest (left panel) by the OTRI and CTRL F1 p53+/− groups of dams (n = 4; **p < .01); occurrence of recomposed nest (right panel) within 30 min after the dismantling in the OTRI and CTRL F1 p53+/− dams (n = 4 dams/group observed in triplicates, **p < .01). (C), average serum cortisol levels before and after restraint challenge in 3 months old F2 mice (n = 4 **p < .01) originated from the OTRI and CTRL groups. (D), survival curves of F2 p53−/− males (n = 8, blue line) of the OTRI group and of the F1 OTRI (red line) and CTRL (black line) p53−/− males (*Gehan‐Breslow‐Wilconox Test p = .0203 or longrank Mantel‐Cox test p = .008 for the comparison OTRI F2 vs. CTRL F1; for the comparison of OTRI F2 vs. OTRI F1 Gehan‐Breslow‐Wilconox Test p = .07). (E), survival curves of recipient mice after bone marrow transplantation with BMC from the F2 OTRI (blue line, n = 6) or F1 OTRI (red lines) or CTRL (black lines) p53−/− male mice (*Gehan‐Breslow‐Wilconox Test p = .013 for the comparison F2 OTRI donors vs. F1 CTRL donors; for the comparison OTRI F2 donors vs. OTRI F1 donors Gehan‐Breslow‐Wilconox Test p = ns)

Similar articles

References

    1. Schuler LA, Auger AP. Psychosocially influenced cancer: diverse early‐life stress experiences and links to breast cancer. Cancer Prev Res. 2010;3:1365‐1370. - PMC - PubMed
    1. Chen E, Brody GH, Miller GE. Childhood close family relationships and health. Am Psychol. 2017;72:555‐566. - PMC - PubMed
    1. Holman DM, Ports KA, Buchanan ND, et al. The association between adverse childhood experiences and risk of cancer in adulthood: a systematic review of the literature. Pediatrics. 2016;138:S81‐S91. - PMC - PubMed
    1. Demakakos P, Chrousos GP, Biddulph JP. Childhood experiences of parenting and cancer risk at older ages: findings from the English longitudinal study of ageing (ELSA). Int J Public Health. 2018;63:823‐832. - PMC - PubMed
    1. Renzi C, Vadilonga V, Gandini S, et al. Stress exposure in significant relationships is associated with lymph node status in breast cancer. PLoS One. 2016;11:e0149443. - PMC - PubMed

Publication types