. 2022 May 11;8(1):39.
doi: 10.1038/s41522-022-00294-z.

Patatin-like phospholipase CapV in Escherichia coli - morphological and physiological effects of one amino acid substitution

Affiliations

Patatin-like phospholipase CapV in Escherichia coli - morphological and physiological effects of one amino acid substitution

Fengyang Li et al. NPJ Biofilms Microbiomes. .

Abstract

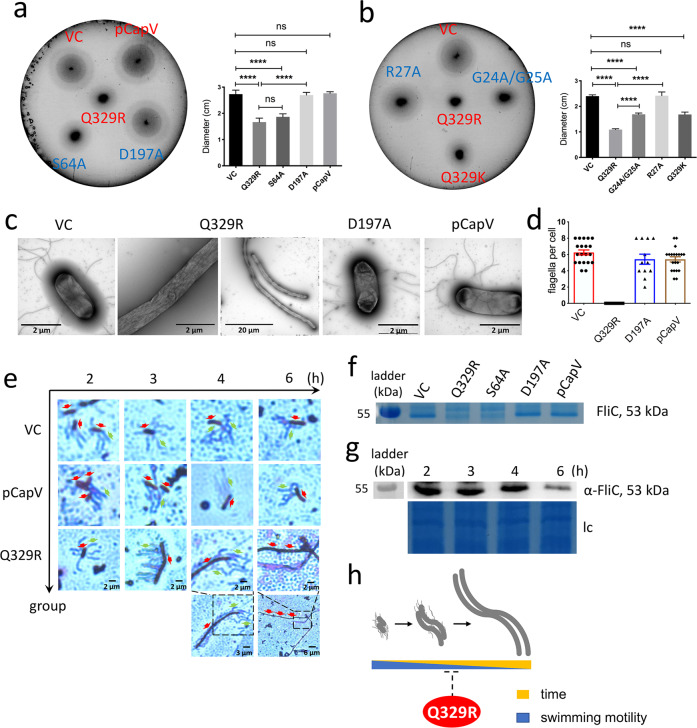
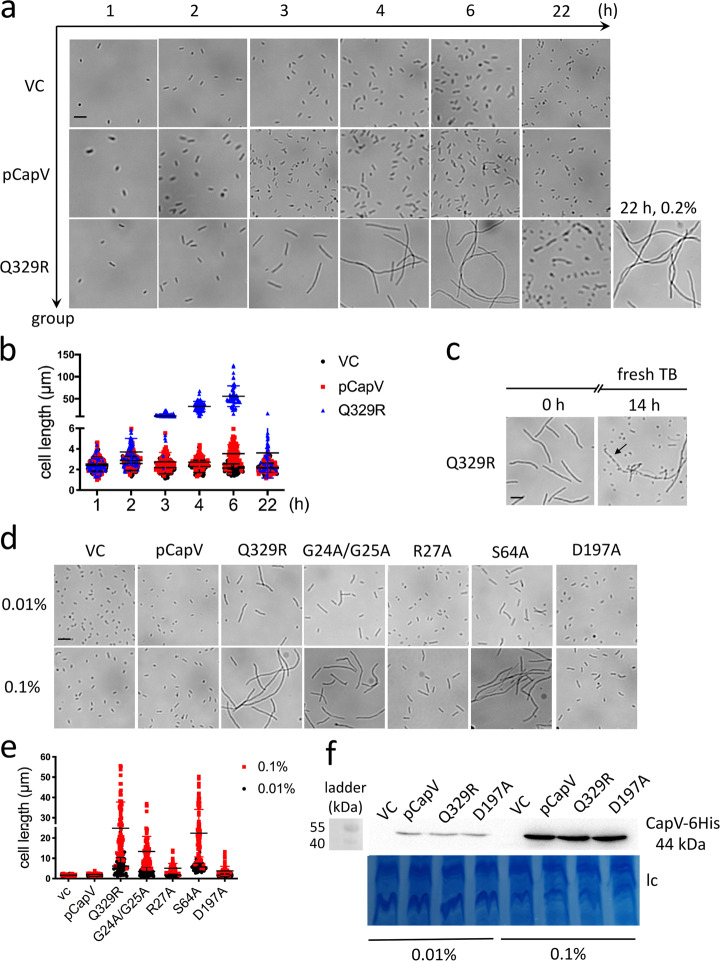
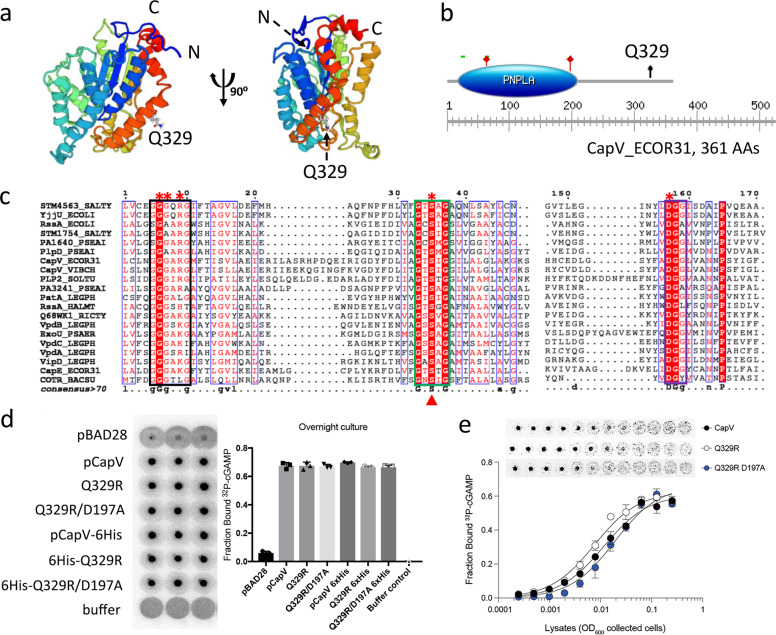
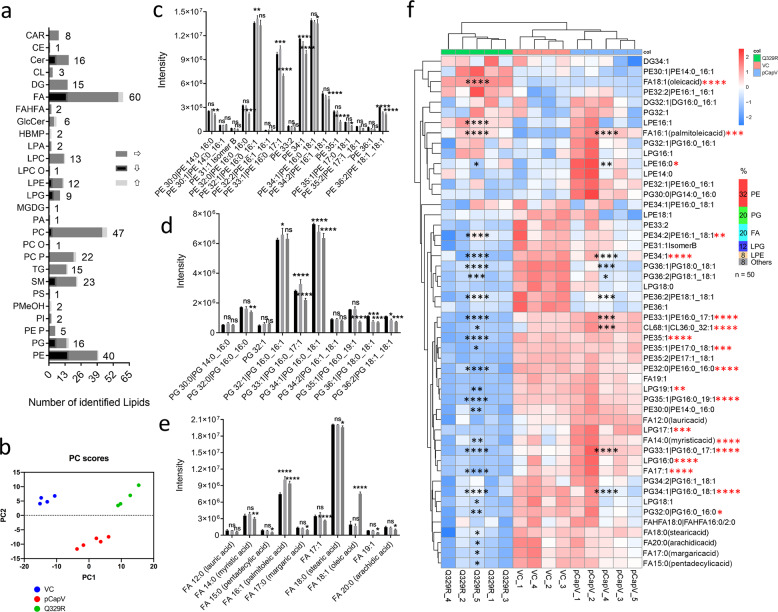
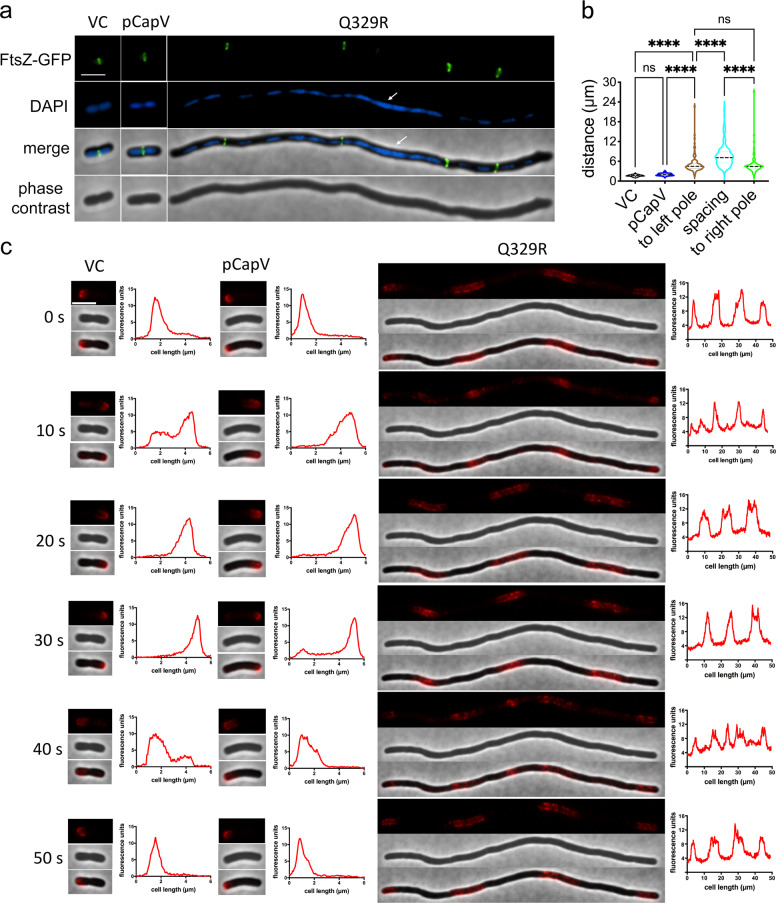
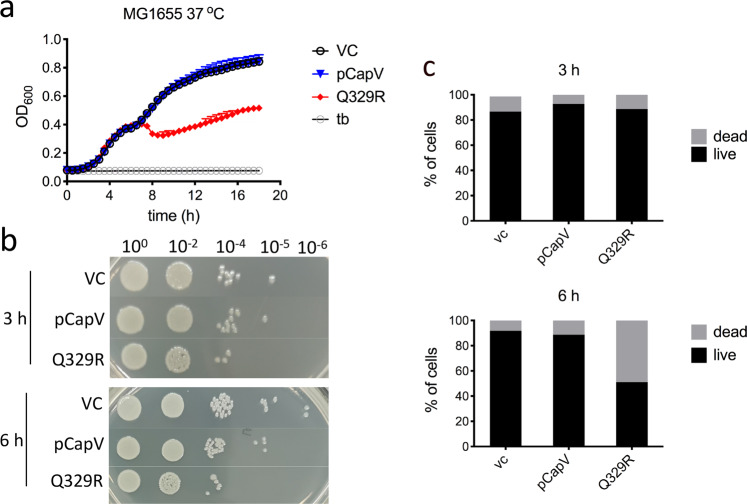
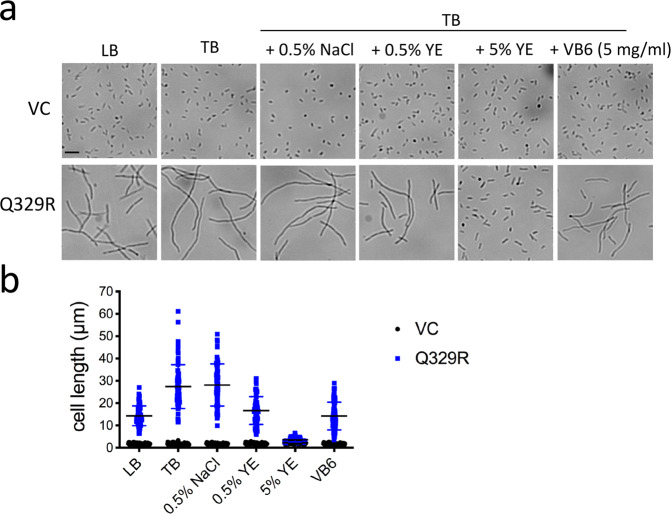
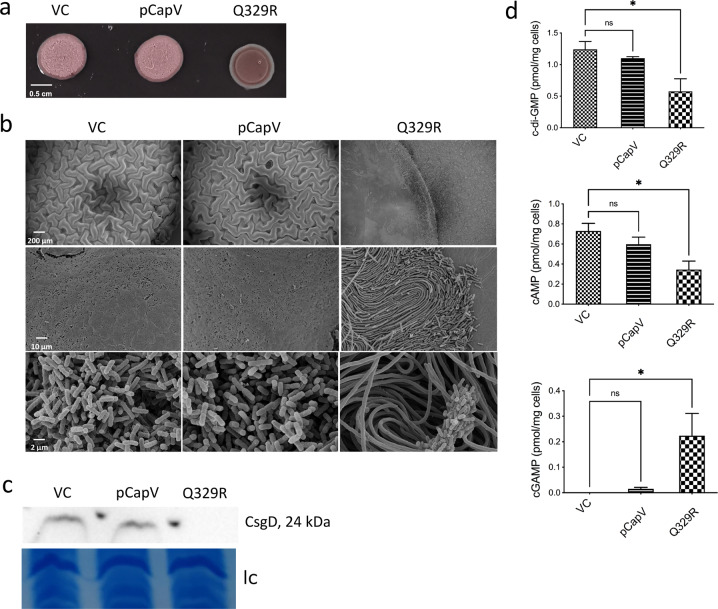
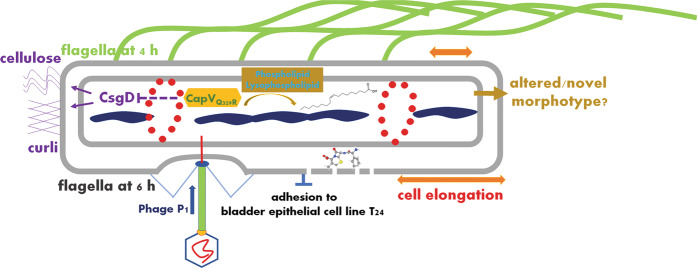
In rod-shaped bacteria, morphological plasticity occurs in response to stress, which blocks cell division to promote filamentation. We demonstrate here that overexpression of the patatin-like phospholipase variant CapVQ329R, but not CapV, causes pronounced sulA-independent pyridoxine-inhibited cell filamentation in the Escherichia coli K-12-derivative MG1655 associated with restriction of flagella production and swimming motility. Conserved amino acids in canonical patatin-like phospholipase A motifs, but not the nucleophilic serine, are required to mediate CapVQ329R phenotypes. Furthermore, CapVQ329R production substantially alters the lipidome and colony morphotype including rdar biofilm formation with modulation of the production of the biofilm activator CsgD, and affects additional bacterial traits such as the efficiency of phage infection and antimicrobial susceptibility. Moreover, genetically diverse commensal and pathogenic E. coli strains and Salmonella typhimurium responded with cell filamentation and modulation in colony morphotype formation to CapVQ329R expression. In conclusion, this work identifies the CapV variant CapVQ329R as a pleiotropic regulator, emphasizes a scaffold function for patatin-like phospholipases, and highlights the impact of the substitution of a single conserved amino acid for protein functionality and alteration of host physiology.


Conflict of interest statement

The authors declare no competing interests.

Figures

Fig. 1
Fig. 1. CapVQ329R inhibits apparent swimming motility and production of the flagellin subunit FliC of E. coli MG1655.
a, b Flagella-dependent swimming motility of wild-type E. coli MG1655 vector control (VC) and upon overexpression of wild-type CapV, its mutants (red) and mutants of CapVQ329R (blue). In total, 3 µl of a OD600 = 5 cell suspension were inoculated into soft agar plates containing 1% tryptone, 0.5% NaCl, and 0.25% agar, and the swimming diameter was measured after 6 h at 37 °C. c Flagella production of a representative E. coli MG1655 VC cell and upon overexpression of CapV, CapVQ329R (Q329R) and CapVQ329R/D197A (D197A) as observed by TEM. d Quantification of the number of flagella per cell upon overexpression of CapV and CapVQ329R after visualization by TEM (c). The number of evaluated cells n = 20. Cells were grown in TB medium for 6 h at 37 °C. e Production of surface-associated flagellin of E. coli MG1655 VC, upon overexpression of CapV and CapVQ329R. f Assessment of flagellin subunit FliC expression by colloidal Coomassie staining from E. coli MG1655 culture supernatants after shearing of flagella upon expression of CapV, CapVQ329R, CapVQ329R/D197A and CapVQ329R/S64A. Cells were grown in TB medium at 37 °C for 6 h. g Assessment of flagellin subunit FliC expression over time in E. coli MG1655 overexpressing CapVQ329R. Samples were harvested at different time points in the growth phase for Western blot analysis of FliC. lc, loading control. h Proposed development of filamentation and flagella inhibition of E. coli MG1655 upon CapVQ329R expression over time. Bars represent mean values from three biologically independent replicates with error bars to represent SD. Differences between mean values were assessed by two-tailed Student’s t test: ns, not significant; *P < 0.05, **P < 0.01, and ***P < 0.001 compared to E. coli MG1655 VC. Vector control VC = pBAD28. pCapV = CapV cloned in pBAD28; Q329R = CapVQ329R cloned in pBAD28. S64A = CapV Q329R/S64A cloned in pBAD28. D197A = CapV Q329R/D197A cloned in pBAD28. R27A = CapVQ329R/R27A cloned in pBAD28. G24A/G25A = CapVQ329R/G24A/G25A cloned in pBAD28.
Fig. 2
Fig. 2. CapVQ329R promotes cell filamentation upon overexpression in E. coli MG1655.
a Light microscopy pictures of cell morphology of E. coli MG1655 VC and upon overexpression of CapV and CapVQ329R (Q329R) in TB medium at different time points at 37 °C. b Quantification of cell length of E. coli MG1655 VC and upon overexpression of CapV and CapVQ329R in TB medium at different time points. The quantification is based on results from at least three independent experiments with the assessment of 70 cells from each group. c Cell morphology 3 h after addition of fresh TB medium to filamentous E. coli MG1655 cells overexpressing CapVQ329R. Arrowheads indicate invaginations at proposed future division sites. d, e, f Assessment of cell length upon overexpression of CapV, CapVQ329R and CapVQ329R derivatives in E. coli MG1655 upon induction with different l-arabinose concentrations. Light microscopy pictures (d), quantification of cell length (e) and protein expression level (lc = loading control) (f) upon induction with 0.01% and 0.1% l-arabinose in TB at 37 °C for 4 h. The quantification is based on results from at least three independent experiments with the assessment of 70 cells from each group. Bar, 5 µm. Vector control VC = pBAD28. pCapV = CapV cloned in pBAD28; Q329R = CapVQ329R cloned in pBAD28. G24A/G25A = CapVQ329R/G24A/G25A cloned in pBAD28. R27A = CapVQ329R/R27A cloned in pBAD28. S64A = CapVQ329R/S64A cloned in pBAD28. D197A = CapVQ329R/D197A cloned in pBAD28.
Fig. 3
Fig. 3. Bioinformatic analysis of the patatin-like phospholipase CapV of E. coli ECOR31 and capacity to bind cyclic AMP-GMP.
a Predicted structural model of the CapV from E. coli ECOR31 shown as ribbon representation. The structural model was built with the I-TASSER server, the result was processed with SWISS-MODEL. The model was based on the coordinates of the 22% identical protein FabD from Solanum cardiophyllum (PDB: 1oxwC). b The graphical representation and schematic indication of the positions of the conserved motifs (indicated by the green bar) and putative active site residues S64 and D197 (marked by red stars) in the PNPLA domain of the 361 aa CapV from E. coli ECOR31 (from L19 to F210). Black arrow, Q329. The graph was assessed by ExPASy_Prosite. c Sequence alignment of CapV from E. coli ECOR31 and selected known phospholipases from other species establishes the conserved motifs of the PNPLA domain, G–G-G-x-[K/R]-G, G-x-S-x-G, and D–G-[A/G], boxed in black, green, and purple, respectively. Entirely conserved residues are shown in white on a red background. Conserved residues are boxed. Putative catalytic residues of CapV are indicated with filled red triangles. The residues in CapVQ329R mutated to alanine are marked with red asterisks above the sequence. The consensus sequence at the bottom indicates in uppercase letter residues with 100% identity and in lowercase letter residues with higher than 70% conservation. Alignment was performed using CLUSTALW, and the result was processed with ESPript 3.0. Sequence identity as in the Methods section. d 32P-cAMP-GMP-DRaCALA of E. coli cell lysates expressing CapV, CapVQ329R, and CapVQ329R/D197A. VC = pBAD28; pCapV = CapV cloned in pBAD28; Q329R = CapVQ329R cloned in pBAD28. D197A = CapVQ329R/D197A cloned in pBAD28. e Assessment of affinity for cAMP-GMP of CapV, CapVQ329R, and CapVQ329R/D197A expressed in E. coli MG1655. 32P-cAMP-GMP was mixed with twofold dilutions of cell extracts starting at a fourfold dilution.
Fig. 4
Fig. 4. CapV and CapVQ329R overexpression alter the steady-state lipid profile of E. coli MG1655.
a The number of identified lipid species in CapV and CapVQ329R induced filamentous cells compared to E. coli MG1655 vector control (VC) by untargeted charged surface hybrid column-quadrupole time-of-flight mass spectrometry (CSH-QTOF MS) analysis. For abbreviation of lipid compounds consult “Methods”. b Principle component analysis of lipid abundance upon overexpression of wild-type CapV and CapVQ329R variant proteins in E. coli MG1655 compared to VC. Of six samples each, outliers have been removed. ce Alternation and relative abundance of PE (c), PG (d), and FA (e) derivatives by untargeted CSH-QTOF MS analysis. Bars represent mean values from five independent replicates with error bars to represent SD. f Heatmap of selected 50 most significantly altered lipid species built based on hierarchical clustering. Each square represents one sample of each group. The color scale presenting the difference of each log2 transformed peak intensity value to the log2 transformed mean for each lipid species and the percentage of each lipid class is indicated on the right of the heatmap. Heatmap analysis was performed on the Tutools platform (https://www.cloudtutu.com), a free online data analysis website. Differences between mean values were assessed by two-tailed Student’s t test: ns, not significant; *P < 0.05, **P < 0.01, ***P < 0.001 and ****P < 0.0001; black stars in c, d, e and f: compared to MG1655 VC; red stars in f: statistical significance between E. coli MG1655 pCapV and E. coli MG1655 pCapVQ329R. VC = pBAD28. pCapV = CapV cloned in pBAD28; Q329R = CapVQ329R cloned in pBAD28.
Fig. 5
Fig. 5. Cell division and chromosomal segregation, but not FtsZ-ring formation, is impaired in filamentous cells.
a Phase-contrast and fluorescence images of FtsZ-GFP expressing cells (E. coli MG1655 derivative BS001 harboring vector control (VC), pCapV and pCapVQ329R). Cells were cultured in TB medium at 37 °C for 4 h, stained with DAPI, and assessed immediately under fluorescence microscopy. Large fragments of unsegregated nucleoids are indicated by white arrows. Bar, 3 µm. b Quantification of the average distance between two adjacent FtsZ rings upon overexpression of CapV and CapVQ329R, refers to Table 1. c Time-lapse analysis of mCherry-MinC expressing cells (E. coli MG1655 derivative PB318 harboring VC, pCapV and pCapVQ329R). A representative elongated cell is displayed. Graphs on the right of fluorescence images display the line profiles of fluorescent signals emanating from the cell. Arbitrary fluorescent units are obtained, analyzed by the Fiji ImageJ 1.8.0 software, and are plotted on the y axis; cell length (in µm) is plotted on the x axis. Bar, 3 µm. VC = pBAD28. pCapV = CapV cloned in pBAD28; Q329R = CapVQ329R cloned in pBAD28.
Fig. 6
Fig. 6. CapVQ329R, but not CapV is cytotoxic to E. coli MG1655 in the early stationary phase.
a Growth curves of E. coli MG1655 upon CapV and CapVQ329R overexpression induced by 0.1% l-arabinose in TB at 37 °C. Each data point represents the mean ± SD of six biological replicates. tb = TB medium. b Colony-spotting assay on agar plates. Cells were grown at 37 °C and harvested at different time points. Cell viability determined by spotting serial dilutions (100–10−6) on LB plates to assess colony-forming units. c Quantification of Live/Dead staining of E. coli MG1655 cells after 3 h and 6 h in TB medium at 37 °C. n = 1200. VC = pBAD28. pCapV = CapV cloned in pBAD28; Q329R = CapVQ329R cloned in pBAD28.
Fig. 7
Fig. 7. Vitamin B6 (pyridoxine) restricts cell filamentation of E. coli MG1655 induced by CapVQ329R.
a Light microscopy pictures of E. coli MG1655 cell morphology and, b quantification of cell length in LB and TB medium supplemented with 0.5% NaCl, 0.5% YE, 5% YE, and VB6 (pyridoxine, 5 mg/ml), respectively. The quantification is based on results from at least three independent experiments with the assessment of 70 cells from each group. Bar, 5 µm. VC = pBAD28. Q329R = CapVQ329R cloned in pBAD28.
Fig. 8
Fig. 8. CapVQ329R expression modulates rdar biofilm formation, CsgD expression, and cyclic (di)nucleotides levels in E. coli strain No. 12.
a Rdar morphotype in wild-type E. coli No. 12 vector control (VC) and upon overexpression of CapV and its mutant CapVQ329R. Cells were grown on a salt-free LB agar plate for 24 h at 37 °C. b Scanning electron microscopy of plate-grown colonies. Colony morphotypes grown on a salt-free LB agar plate were fixed after 24 h of growth at 37 °C. c CsgD production upon overexpression of CapV and CapVQ329R in E. coli strain No. 12 compared to VC. Only colony morphotypes from the same plate and signals from the same western blot are compared. d LC-MS/MS quantification of in vivo amounts of c-di-GMP, cAMP, and cAMP-GMP upon overexpression of CapV and CapVQ329R in E. coli strain No. 12 compared to VC. Data are displayed as absolute amounts referred to the original cell suspension. VC = pBAD28. pCapV = CapV cloned in pBAD28; Q329R = CapVQ329R cloned in pBAD28.
Fig. 9
Fig. 9. Summary of morphological and physiological changes caused by the production of the patatin-like phospholipase variant CapVQ329R in E. coli.
Overexpression of CapVQ329R in E. coli MG1655 causes substantial morphological and physiological changes which lead to cell elongation with extensive filamentation as a consequence, disparate FtsZ-ring formation, impaired nucleoid segregation, and condensation. a change in the overall lipid profile of the cells, downregulation of flagella expression and motility, downregulation of rdar biofilm morphology and production of its activator CsgD and enhanced susceptibility to infection by the myophage P1 and the cell wall inhibiting antibiotic cephalexine. In the clinical isolate E. coli No. 12, reduced adhesion to the bladder epithelial cell line T24 has been observed. In strains not producing the rdar morphotype at 37 °C, a potentially novel biofilm morphotype has been observed. Cephalexin structure from PubChem (https://pubchem.ncbi.nlm.nih.gov/compound/Cephalexin); structure of oleic acid from Wikipedia (https://en.wikipedia.org/wiki/Oleic_acid).

Similar articles

Cited by

References

    1. Cabeen MT, Jacobs-Wagner C. Bacterial cell shape. Nat. Rev. Microbiol. 2005;3:601–610. doi: 10.1038/nrmicro1205. - DOI - PubMed
    1. Jones TH, Vail KM, McMullen LM. Filament formation by foodborne bacteria under sublethal stress. Int. J. Food Microbiol. 2013;165:97–110. doi: 10.1016/j.ijfoodmicro.2013.05.001. - DOI - PubMed
    1. Utsumi R, Nakamoto Y, Kawamukai M, Himeno M, Komano T. Involvement of cyclic AMP and its receptor protein in filamentation of an Escherichia coli fic mutant. J. Bacteriol. 1982;151:807–812. doi: 10.1128/jb.151.2.807-812.1982. - DOI - PMC - PubMed
    1. Justice SS, et al. Differentiation and developmental pathways of uropathogenic Escherichia coli in urinary tract pathogenesis. Proc. Natl Acad. Sci. USA. 2004;101:1333–1338. doi: 10.1073/pnas.0308125100. - DOI - PMC - PubMed
    1. Heinrich K, Leslie DJ, Morlock M, Bertilsson S, Jonas K. Molecular basis and ecological relevance of Caulobacter cell filamentation in freshwater habitats. mBio. 2019;10:e01557–01519. doi: 10.1128/mBio.01557-19. - DOI - PMC - PubMed

Publication types

MeSH terms