. 2022 Aug;27(8):3396-3409.
doi: 10.1038/s41380-022-01600-z. Epub 2022 May 11.

High-fat diet-induced diabetes couples to Alzheimer's disease through inflammation-activated C/EBPβ/AEP pathway

Affiliations

High-fat diet-induced diabetes couples to Alzheimer's disease through inflammation-activated C/EBPβ/AEP pathway

Pai Liu et al. Mol Psychiatry. 2022 Aug.

Abstract

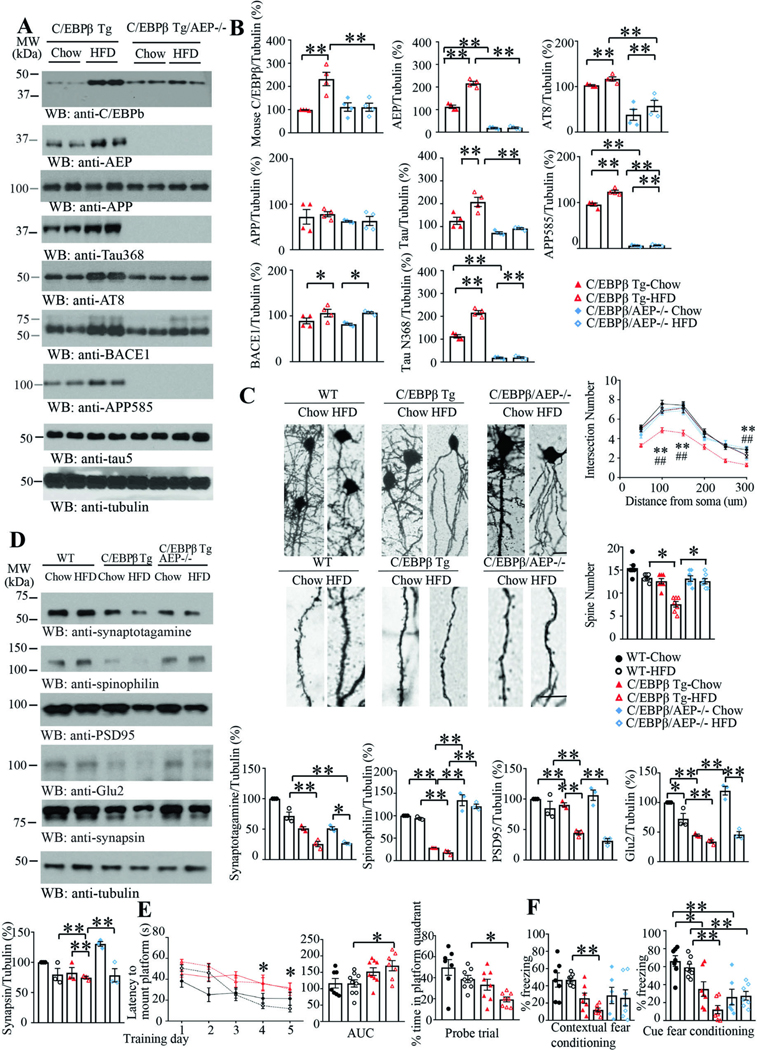
Diabetes is a risk factor for Alzheimer's disease (AD), which is also called type 3 diabetes with insulin reduction and insulin resistance in AD patient brains. However, the molecular mechanism coupling diabetes to AD onset remains incompletely understood. Here we show that inflammation, associated with obesity and diabetes elicited by high-fat diet (HFD), activates neuronal C/EBPβ/AEP signaling that drives AD pathologies and cognitive disorders. HFD stimulates diabetes and insulin resistance in neuronal Thy1-C/EBPβ transgenic (Tg) mice, accompanied with prominent mouse Aβ accumulation and hyperphosphorylated Tau aggregation in the brain, triggering cognitive deficits. These effects are profoundly diminished when AEP is deleted from C/EBPβ Tg mice. Chronic treatment with inflammatory lipopolysaccharide (LPS) facilitates AD pathologies and cognitive disorders in C/EBPβ Tg but not in wild-type mice, and these deleterious effects were substantially alleviated in C/EBPβ Tg/AEP -/- mice. Remarkably, the anti-inflammatory drug aspirin strongly attenuates HFD-induced diabetes and AD pathologies in neuronal C/EBPβ Tg mice. Therefore, our findings demonstrate that inflammation-activated neuronal C/EBPβ/AEP signaling couples diabetes to AD.


Conflict of interest statement

COMPETING INTERESTS

The authors declare no competing interests.

Figures

Fig. 1
Fig. 1. High-Fat Diet (HFD) induces diabetes in Thy1-C/EBPβ transgenic mice.
A Growth curves of 3-month-old wild-type, C/EBPβ transgenic mice, and C/EBPβ/AEP −/− transgenic mice fed with chow diet or HFD. Body weight was measured biweekly and expressed as mean ± SEM (n = 7–10; *P < 0.05, **P < 0.01, WT-HFD versus C/EBPβ-HFD, P < 0.05, P < 0.01 C/EBPβ-Chow versus C/EBPβ-HFD, one-way ANOVA and Bonferroni’s post hoc test). B Insulin tolerance test in wild-type, C/EBPβ transgenic mice, and C/EBPβ transgenic mice with AEP knockout (6–7 months old) that have been fed with HFD for 12 weeks after overnight fasting. Blood glucose level was monitored at different time intervals after intraperitoneal injection of glucose (2 g/kg). Data present mean ± SEM (n = 7–8; *p < 0.05, **p < 0.01, WT-HFD versus C/EBPβ-HFD, P < 0.05, P < 0.01 C/EBPβ-Chow versus C/EBPβ-HFD, one-way ANOVA and Bonferroni’s post hoc test). C Glucose tolerance test in wild-type, C/EBPβ transgenic mice, and C/EBPβ transgenic mice with AEP knockout (6–7 months old) that have been fed with HFD for 12 weeks after overnight fasting. Blood glucose level was monitored at different time intervals after intraperitoneal injection of glucose (2 g/kg). Data presented mean ± SEM (n = 7–8; *p < 0.05, **p < 0.01, WT-HFD versus C/EBPβ-HFD, P < 0.05, P < 0.01 C/EBPβ-Chow versus C/EBPβ-HFD, one-way ANOVA and Bonferroni’s post hoc test). D, E Area under the curve (AUC) for ITT and GTT (n = 7–8; *P < 0.05, **P < 0.01 one-way ANOVA and Bonferroni’s multiple comparison test). F, G Circulating insulin concentrations of fed and fasting wild-type, C/EBPβ transgenic mice, and C/EBPβ/AEP −/− mice (6–7 months old) that have been fed with chow diet or HFD for 12 weeks (n = 3). Results were expressed as mean ± SEM (*P < 0.05, **P < 0.01; one-way ANOVA and Bonferroni’s multiple comparison test). H Serum leptin levels in fed condition (n = 3; * P < 0.05, **P < 0.01; one-way ANOVA and Bonferroni’s multiple comparison test). I Brain insulin levels in fed condition (n = 3; *P < 0.05, **P < 0.01; one-way ANOVA and Bonferroni’s multiple comparison test). J Thiamine and Thiamine diphosphate levels in whole blood collected from wild-type and C/EBPβ transgenic mice fed with chow diet or HFD. (Mean ± SEM, n = 3, one-way ANOVA and Bonferroni’s multiple comparison test, *p < 0.05, **p < 0.01).
Fig. 2
Fig. 2. High-Fat Diet (HFD) impairs insulin signaling and diminishes AMPK/ACC pathways in Thy1-C/EBPβ transgenic mice.
Analysis of AMPK/ACC and insulin signaling pathway in wild-type, C/EBPβ Tg mice and C/EBPβ/AEP −/− mice (6–7 months old) that have been fed with chow diet or HFD for 12 weeks. Extracts of inguinal WAT (A), BAT (B), muscle (C), and liver (D) were prepared and immunoblotted with phosphor–Thr172-AMPK, phosphor–Ser79-ACC, total AMPK, and ACC. Muscle (E) and liver (F) IR were further immunoblotted with phosphor-IR (Tyr1146), IRS, phosphor-IRS (Tyr608), AKT, and phosphor-AKT (Ser473) antibodies. (Mean ± SEM, n = 4, one-way ANOVA and Bonferroni’s multiple comparison test, *p < 0.05, **p < 0.01).
Fig. 3
Fig. 3. Knockout of AEP from Thy1-C/EBPβ transgenic mice alleviates HFD-induced neuro-inflammation and AD pathologies.
A, B Analysis of insulin signaling pathway in the brain from wild-type and C/EBPβ Tg and C/EBPβ/AEP −/− mice, (6–7 months old) that have been fed with chow diet or HFD for 12 weeks. Extracts of the brain tissues were prepared and immunoblotted with phosphor–Thr172-AMPK, phosphor–Ser79-ACC, total AMPK, ACC, AMPK (Thr172), IR, phosphor-IR (Tyr1146), IRS, phosphor-IRS (Tyr608), AKT, phosphor-AKT (Ser473), GSK, GSK (Ser9) antibodies. (Mean ± SEM, n = 4, one-way ANOVA and Bonferroni’s multiple comparison test, *p < 0.05, **p < 0.01). C AEP enzymatic activity assay (Mean ± SEM, n = 3, one-way ANOVA and Bonferroni’s multiple comparison test, *p < 0.05, **p < 0.01). D–F ELISA analysis of neuroinflammation factors IL-1β, IL-6, TNFα in the brain lysates from the above mice. (Mean ± SEM, n = 3 mice for each group, one-way ANOVA and Bonferroni’s multiple comparison test. *p < 0.05, **p < 0.01). G Western blot assays demonstrated HFD-induced activation of C/EBPβ and C/EBPβ-mediated upregulation of AEP, Tau and BACE1 in the hippocampus compared to Chow diet treatment. HFD enhanced the levels of C/EBPβ downstream proteins in C/EBPβ Tg mice, leading to cleavages of APP (N585) and Tau (N368) by activated AEP, and Tau hyperphosphorylation (AT8). The relative abundance of various indicated proteins was quantified (Mean ± SEM, n = 4, one-way ANOVA and Bonferroni’s multiple comparison test, *p < 0.05, **p < 0.01). H Immunofluorescent co-staining of Iba-1 and GFAP on the hippocampal sections of chow diet or HFD-treated WT, C/EBPβ Tg and C/EBPβ/AEP −/− mice. Microglia activation and gliosis were highly enriched in HFD-treated C/EBPβ Tg mice. Scale bar: 50 μm. The quantification of Iba-1 and gliosis were analyzed (I, J). (Mean ± SEM, n = 3, one-way ANOVA and Bonferroni’s multiple comparison test, *p < 0.05, **p < 0.01). K Immunohistochemistry analysis of hyperphosphorylated Tau (top panel), Aβ (middle panel), and Gallyas-Braak silver staining (lower panel) in the hippocampus of HFD and chow diet-treated WT, C/EBPβ transgenic mice, and C/EBPβ/AEP −/− mice (scale bar: 50 μm). The abundance of hyperphosphorylated Tau, Aβ, and proteinaceous inclusions are quantified (Mean ± SEM, n = 3 mice for each group, one-way ANOVA and Bonferroni’s multiple comparison test. *p < 0.05, **p < 0.01) L,M ELISA analysis of mouse Aβ40/42 in the brain lysates from the above mice. (Mean ± SEM, n = 3 mice for each group, one-way ANOVA. *p < 0.05, **p < 0.01).
Fig. 4
Fig. 4. Deletion of AEP from Thy1-C/EBPβ transgenic mice ameliorates HFD-triggered synaptic degeneration and cognitive dysfunctions.
A, B Knockout of AEP in C/EBPβ transgenic mice repressed HFD-triggered the upregulation of AEP, Tau and BACE1, along with increased APP and Tau fragmentation by active AEP, and hyperphosphorylated Tau (AT8). The relative abundance of various indicated proteins was quantified (Mean ± SEM, n = 4, one-way ANOVA and Bonferroni’s multiple comparison test, *p < 0.05, **p < 0.01). C Golgi staining showed the neurite crossings and dendritic spines from the apical dendritic layer of the CA1 region. Sholl analysis of the neurites crossing (upper, Scale bar: 5 μm). (top, *p < 0.05, **p < 0.01, WT-HFD versus C/EBPβ-HFD, P < 0.05, P < 0.01 C/EBPβ/AEP−/−-HFD versus C/EBPβ-HFD, one-way ANOVA and Bonferroni’s post hoc test). Quantitative analysis of the spine density. (bottom, mean ± SEM, n = 6 for each group, one-way ANOVA and Bonferroni’s multiple comparison test, *p < 0.05, **p < 0.01). D Western blot assays demonstrated HFD-induced synaptic proteins downregulation in the hippocampus of C/EBPβ Tg mice. This decline was rescued by AEP KO in the transgenic mice. (Mean ± SEM, n = 3, one-way ANOVA and Bonferroni’s multiple comparison test, *p < 0.05, **p < 0.01). E Morris water maze analysis as the percentage of time spent in the target quadrant in the probe trial (right) and the latency time (left, AUC: area under the curve) to the platform in the training days. (Mean ± SEM, n ≥ 7 mice for each group, *p < 0.05, **p < 0.01, WT-HFD versus C/EBPβ-HFD, one-way ANOVA and Bonferroni’s multiple comparison test). F Fear conditioning tests. Contextual (left) and cued (right) fear conditioning in mice after chow or HFD treatment. (Mean ± SEM, n ≥ 6–7 mice for each group, one-way ANOVA and Bonferroni’s multiple comparison test, *p < 0.05, **p < 0.01).
Fig. 5
Fig. 5. LPS triggers APP and Tau cleavage and neuro-inflammation in Thy1-C/EBPβ transgenic mice via activating C/EBPβ/AEP signaling.
A Western blot assays demonstrated LPS-induced activation of C/EBPβ and C/EBPβ-mediated upregulation of AEP, APP, Tau and BACE1 in the hippocampus compared to PBS treatment. LPS stimulation enhanced the levels of C/EBPβ downstream proteins, leading to cleavages of APP and Tau (N368) by activated AEP, and Tau hyperphosphorylation (AT8) in C/EBPβ transgenic mice. Knockdown of C/EBPβ diminished these events. The relative abundance of various indicated proteins was quantified (Mean ± SEM, n = 4, one-way ANOVA and Bonferroni’s multiple comparison test, *p < 0.05, **p < 0.01). B AEP enzymatic activity assay (Mean ± SEM, n = 4, one-way ANOVA and Bonferroni’s multiple comparison test, *p < 0.05, **p < 0.01). C Neuroinflammation in LPS-treated C/EBPβ transgenic mice. IL-1β, IL-6 and TNFα were quantified by the ELISA from the brain lysates. (Mean ± SEM, n = 4, one-way ANOVA and Bonferroni’s multiple comparison test, **p < 0.01). D Immunoblotting analysis of the brain lysates from LPS-treated C/EBPβ transgenic mice. Deletion of AEP from C/EBPβ Tg mice reduced LPS-triggered biochemical effects. The quantification of protein levels are in Supplementary Fig 6H. E,F Immunofluorescent co-staining of Iba-1 and GFAP on the hippocampal sections of vehicle or LPS-treated WT, C/EBPβ transgenic mice, C/EBPβ ± and C/EBPβ/AEP −/− mice. Microglia activation and gliosis were highly enriched in LPS-treated C/EBPβ transgenic mice and reduced in LPS-treated C/EBPβ transgenic mice with AEP knockout (E). Scale bar: 50 μm. The quantification of Iba-1 and gliosis were analyzed (F). (Mean ± SEM, n ≥ 7, one-way ANOVA and Bonferroni’s multiple comparison test, *p < 0.05, **p < 0.01).
Fig. 6
Fig. 6. LPS induces AD pathologies and cognitive deficits in Thy1-C/EBPβ transgenic mice.
A Immunohistochemistry analysis of Aβ in the cortex and hippocampus of LPS-treated C/EBPβ transgenic mice. Numerous senile plaques were identified in both the dorsal and ventral brain sections. Asterisks indicated intracellular Aβ around the plaques (Scale bar on the top: 500 μm; scale bar at the bottom: 50 μm). B Quantitative analysis of average senile plaques in vehicle or LPS-treated WT, C/EBPβ transgenic mice and C/EBPβ ± mice. (Mean ± SEM, n = 8, one-way ANOVA and Bonferroni’s multiple comparison test, **p < 0.01). C Immunofluorescent co-staining of brain sections with anti-Aβ and Thioflavin S. Scale bar: 50 μm. D Quantification of Aβ40 and 42 from the formic acid (FA, insoluble fractions) and diethylamine (DEA, soluble fractions) fractions from the animals. (Mean ± SEM, n = 4, one-way ANOVA and Bonferroni’s multiple comparison test, *p < 0.05, **p < 0.01). E, F Immunohistochemistry of hyperphosphorylated Tau in the cortex and hippocampus of animals. Tau phosphorylation was analyzed with anti-AT8 (E). The intraneuronal NFT signals were quantified (F). (Mean ± SEM, n = 4, one-way ANOVA and Bonferroni’s multiple comparison test, *p < 0.05, **p < 0.01, scale bar: 50 μm). G Immunofluorescent staining and Silver staining. LPS-triggered AT8 and ThS co-staining in the hippocampus of C/EBPβ Tg mice. Silver staining revealed the proteinaceous inclusions.

References

    1. Akiyama H, Barger S, Barnum S, Bradt B, Bauer J, Cole GM, et al. Inflammation and Alzheimer’s disease. Neurobiol Aging. 2000;21:383–421. - PMC - PubMed
    1. Newcombe EA, Camats-Perna J, Silva ML, Valmas N, Huat TJ, Medeiros R. Inflammation: the link between comorbidities, genetics, and Alzheimer’s disease. J Neuroinflammation. 2018;15:276. - PMC - PubMed
    1. Profenno LA, Porsteinsson AP, Faraone SV. Meta-analysis of Alzheimer’s disease risk with obesity, diabetes, and related disorders. Biol Psychiatry. 2010;67:505–12. - PubMed
    1. Kuehn BM. In Alzheimer Research, Glucose Metabolism Moves to Center Stage. JAMA 2020;323:297–9. - PubMed
    1. Miklossy J, Qing H, Radenovic A, Kis A, Vileno B, Laszlo F, et al. Beta amyloid and hyperphosphorylated tau deposits in the pancreas in type 2 diabetes. Neurobiol Aging. 2010;31:1503–15. - PMC - PubMed

Publication types

Substances

LinkOut - more resources