. 2018 Aug 30;8(53):30573-30581.
doi: 10.1039/c8ra05454a. eCollection 2018 Aug 24.

Preparation of Ru(ii)@oligonucleotide nanosized polymers as potential tumor-imaging luminescent probes

Affiliations

Preparation of Ru(ii)@oligonucleotide nanosized polymers as potential tumor-imaging luminescent probes

Geng-Nan Yu et al. RSC Adv. .

Abstract

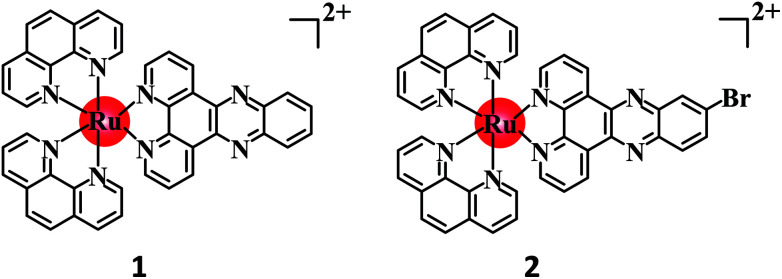
The development of Ru(ii) complexes as luminescent probes has attracted increasing attention in recent decades. In this study, the nanosized polymers of two Ru(ii) complexes [Ru(phen)2(dppz)](ClO4)2 (1, phen = 1,10-phenanthrolin; dppz = dipyrido[3,2-a:2',3'-c]phenazine) and [Ru(phen)2(Br-dppz)](ClO4)2 (2, Br-dppz = 11-bromodipyrido[3,2-a:2',3'-c]phenazine) with oligonucleotides were prepared and investigated as potential tumor-imaging probes. The formation of the nanosized polymers, which had an average width of 125-438 nm and an average height of 3-6 nm, for 1 and 2@oligonucleotides were observed through atomic force microscopy. The emission spectra indicated that the luminescence of 1 and 2 markedly increased after binding to oligonucleotides and double-strand DNA (calf thymus DNA), respectively. Moreover, further studies indicated that 1@oligonucleotides and 2@oligonucleotides can easily enter into tumor cells and selectively highlight the tumor area in the zebrafish bear xenograft tumor (MDA-MB-231). In summary, this study demonstrated that 1@oligonucleotides and 2@oligonucleotides could be developed as potential tumor-imaging luminescent probes for clinical diagnosis and therapy.


Conflict of interest statement

There are no conflicts of interest to declare.

Figures

Scheme 1
Scheme 1. Molecular structures of 1 and 2.
Fig. 1
Fig. 1. (A) AFM images of oligonucleotides after being treated by 1 (in pH 7.2 Tris–HCl KCl buffers). (B) AFM images of oligonucleotides after being treated by 2 (in pH 7.2 Tris–HCl KCl buffers). (C) AFM images of CT-DNA after being treated by 1 (in pH 7.2 Tris–HCl NaCl buffers). (D) AFM images of CT-DNA after being treated by 2 (in pH 7.2 Tris–HCl NaCl buffers). [Ru] = 100 μM, [oligonucleotides] = 100 μM, [CT-DNA] = 100 μM.
Fig. 2
Fig. 2. (A) Changes in the luminescence intensities of 1 and 2 in the absence and presence of oligonucleotides. [Ru] = 100 μM, [oligonucleotides] = 0.067n μM, n = 0, 1, 2…, (in pH 7.2 Tris–HCl KCl buffers). (B) Changes in the luminescence intensities of 1 and 2 in the absence and presence of CT-DNA. [Ru] = 100 μM, [CT-DNA] = 0.067n μM, n = 0, 1, 2…, (in pH 7.2 Tris–HCl NaCl buffers).
Fig. 3
Fig. 3. (A) The relative intensity (I/I0) of 1 and 2 with increasing concentration of oligonucleotides or CT-DNA. [Ru] = 20 μM, [oligonucleotides] = 0.067n μM, n = 0, 1, 2…, [CT-DNA] = 0.067n μM, n = 0, 1, 2…, (in pH 7.2 Tris–HCl KCl or NaCl buffers). (B) Hypochromic effect of the changes of 1 and 2 between oligonucleotides and CT-DNA, [Ru] = 20 μM, [oligonucleotides] = 100 μM, [CT-DNA] = 100 μM, (in pH 7.2 Tris–HCl KCl or NaCl buffers).
Fig. 4
Fig. 4. (A) Electronic spectra of 1 and 2 in the absence and presence of oligonucleotides in the Tris–HCl KCl buffer (pH 7.2). ([Ru] = 20 μM, [oligonucleotides] = 0.067n μM, n = 0, 1, 2…); (B) electronic spectra of 1 and 2 in the absence and presence of CT-DNA in the Tris–HCl NaCl buffer (pH 7.2). ([Ru] = 20 μM, [CT-DNA] = 0.067n μM, n = 0, 1, 2…).
Fig. 5
Fig. 5. (A) CD titration spectra of oligonucleotides with increasing amounts of 1 and 2 in the incubation buffer, [Ru] = 0, 2.660, 5.305, 7.937, 10.554, 13.158, 15.748, 18.325 μM, [oligonucleotides] = 100 μM. (B) CD titration spectra of CT-DNA with increasing amounts of 1 and 2 in the incubation buffer, [Ru] = 0, 2.660, 5.305, 7.937, 10.554, 13.158, 15.748, 18.325 μM, [CT-DNA] = 100 μM.
Fig. 6
Fig. 6. Selectively imaging tumor cells by Ru(ii)@oligonucleotide in vitro and in vivo. (A) MDA-MB-231 cells imaging of 1, 1@oligonucleotide and 1@CT-DNA at 37 °C for 24 h. (B) MDA-MB-231 cells imaging of 2, 2@oligonucleotide and 2@CT-DNA at 37 °C for 24 h. (C) Tumor area highlighted by 1@oligonucleotide and 2@oligonucleotide in zebrafish xenografts model. ([Ru] = 2.5 μM, [oligonucleotides] = 2.5 μM).

References

    1. Vo-Dinh T. Wang J. Lakowicz J. R. Vernier P. T. Sun Y. Gryczynski Z. K. Gundersen M. A. Marcu L. Proc. SPIE. 2005;5703:127. doi: 10.1117/12.591385. - DOI
    1. Antcliff R. J. Stanford M. R. Chauhan D. S. Graham E. M. Spalton D. J. Shilling J. S. Ffytche T. J. Marshall J. Ophthalmology. 2000;107:593–599. doi: 10.1016/S0161-6420(99)00087-1. - DOI - PubMed
    1. Kobayashi H. Ogawa M. Alford R. Choyke P. L. Urano Y. Chem. Rev. 2010;110:2620–2640. doi: 10.1021/cr900263j. - DOI - PMC - PubMed
    1. Tummers Q. R. Hoogstins C. E. Gaarenstroom K. N. de Kroon C. D. van Poelgeest M. I. Vuyk J. Bosse T. Smit V. T. van de Velde C. J. Cohen A. F. Low P. S. Burggraaf J. Vahrmeijer A. L. Oncotarget. 2016;7:32144–32155. doi: 10.18632/oncotarget.8282. - DOI - PMC - PubMed
    1. Zhang J. Campbell R. E. Ting A. Y. Tsien R. Y. Nat. Rev. Mol. Cell Biol. 2002;3:906–918. doi: 10.1038/nrm976. - DOI - PubMed