. 2022 Apr 25:13:852671.
doi: 10.3389/fendo.2022.852671. eCollection 2022.

HOXA10 Regulates the Synthesis of Cholesterol in Endometrial Stromal Cells

Affiliations

HOXA10 Regulates the Synthesis of Cholesterol in Endometrial Stromal Cells

Meixing Yu et al. Front Endocrinol (Lausanne). .

Abstract

Background: The expression of homeobox A10 (HOXA10) in endometrial stromal cells is regulated by steroid hormones, especially by estrogen. As a precursor molecule of estrogen, abnormal cholesterol metabolism is significantly positively correlated with endometriosis. The purpose of this study was to explore the regulation of HOXA10 on cholesterol synthesis in endometrial stromal cells.

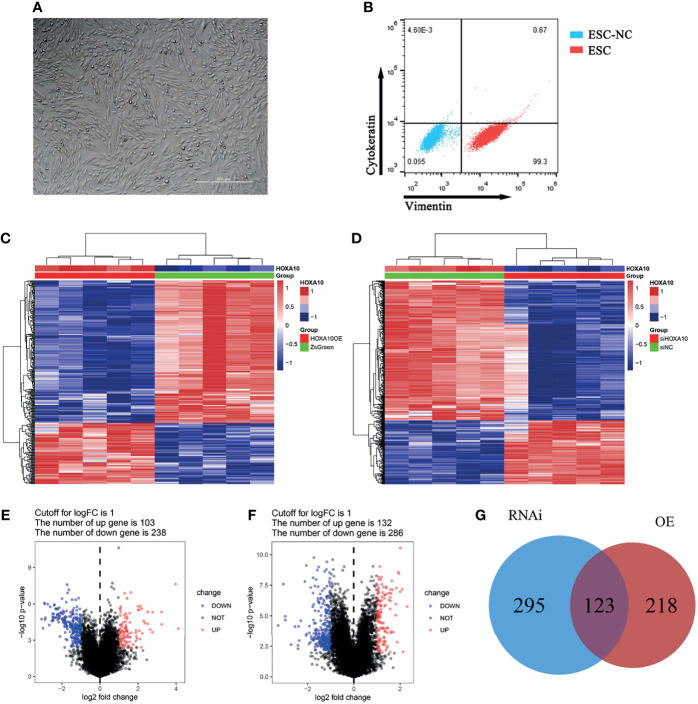
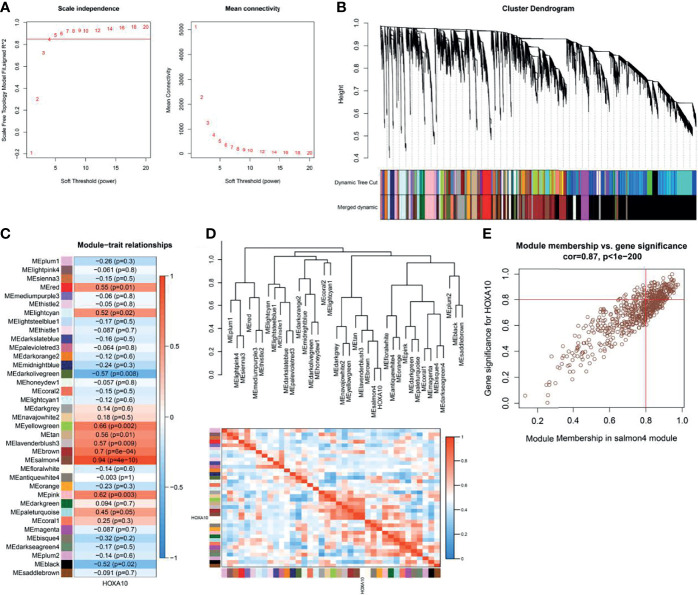
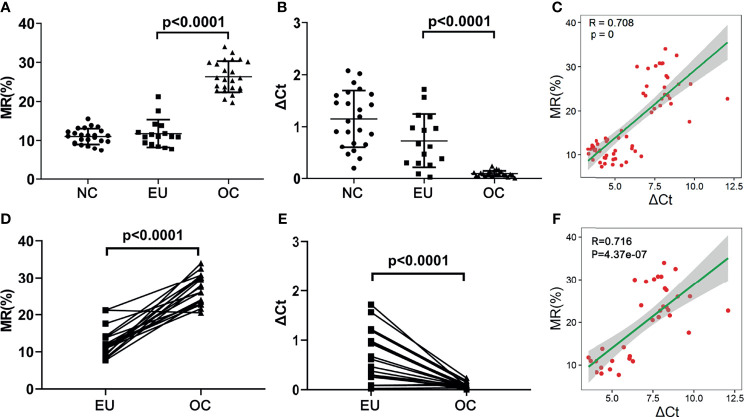
Method: mRNA expression data of eutopic endometrial stromal cell (ESC) and ovarian endometriotic cysts stromal cell (OESC) were download from the Gene Expression Omnibus (GEO) databases. Overexpression and silence of HOXA10 were conducted in cultured ESC and subjected to mRNA sequencing. The differentially expressed genes (DEGs) were selected by analyzing the sequencing data. Weighted gene co-expression network analysis (WGCNA) was applied to identify the key genes associated with HOXA10. The methylation rate of HOXA10 CpGs and the correlation between HOXA10 expression and the methylation in eutopic endometrial tissue (EU) and ovarian cyst (OC) were analyzed.

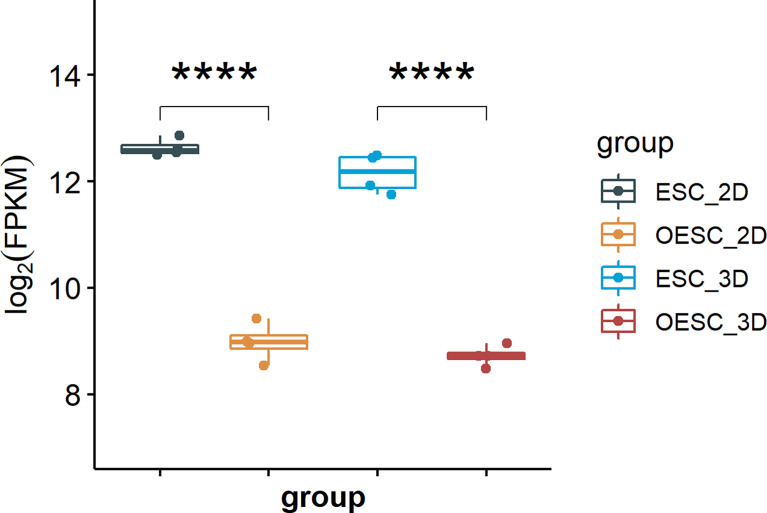
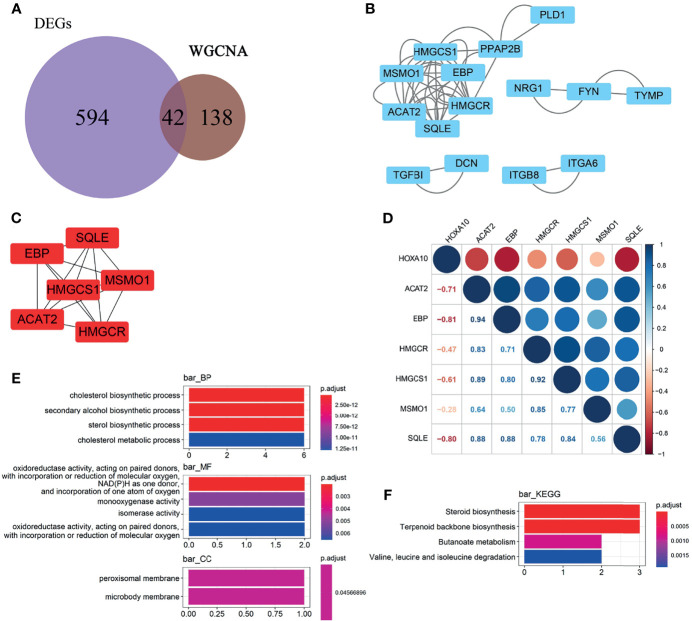
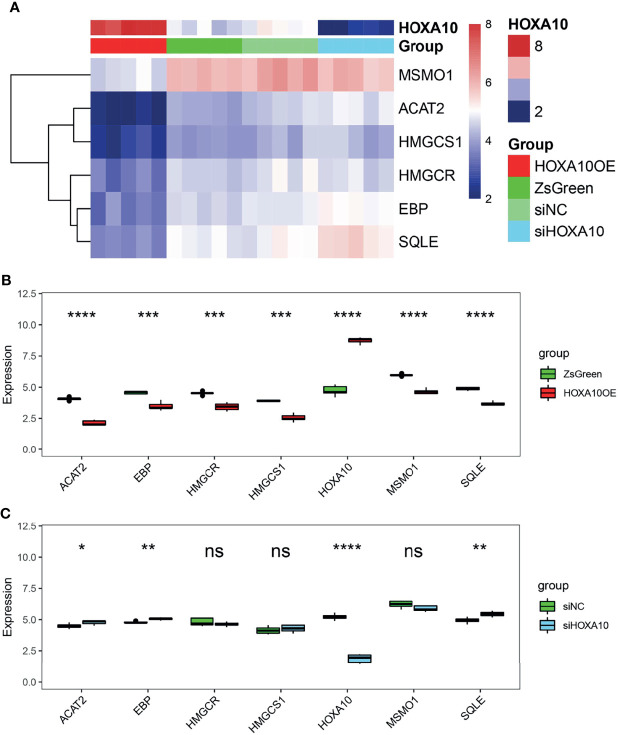
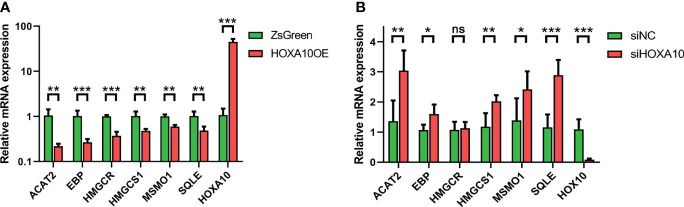
Results: HOXA10 in ESC was significantly higher expressed than that in OESC. Six key genes (HMGCR, MSMO1, ACAT2, HMGCS1, EBP, and SQLE), which were regulated by HOXA10, were identified from the salmon4 module by WGCNA. All these key genes were enriched in cholesterol synthesis. Moreover, the expression of HOXA10 was negatively related to its CpGs methylation rate.

Conclusion: In this study, six key genes that were regulated by HOXA10 were selected, and all of them were enriched in cholesterol synthesis. This finding provided a new insight into the metabolic mechanism of cholesterol in ESC. It also provided a potential treatment strategy for cholesterol metabolism maladjustment in patients with ovarian endometriosis.

Keywords: HOXA10 gene; cholesterol synthesis; endometrial stromal cell; estrogen; ovarian endometriosis.


Conflict of interest statement

The authors declare that the research was conducted in the absence of any commercial or financial relationships that could be construed as a potential conflict of interest.

Figures

Figure 1
Figure 1
The mRNA expression of HOXA10 in ESC and OESC (ESC_2D, ESC cultured in 2D system; OESC_2D, OESC cultured in 2D system; ESC_3D, ESC cultured in 3D system; OESC_3D, OESC cultured in 3D system. ****p<0.0001).
Figure 2
Figure 2
DEGs screening between HOXA10 over-expression and HOXA10 silence ESC. (A) ESC culturation. (B) ESC identification. (C) Heatmap of DEGs between HOXA10OE group and ZsGreen group. (D) Heatmap of DEGs between siHOXA10 group and siNC group. (E) Volcano plot of DEGs between HOXA10OE group and ZsGreen group. (F) DEGs between siHOXA10 group and siNC group. (G) The union of two sets of DEGs (HOXA10OE, HOXA10 over-expression ESC; ZsGreen, control for over-expression group; siHOXA10, HOXA10 silence ESC; siNC, control for silence group).
Figure 3
Figure 3
Weighted gene co-expression network analysis. (A) Selection of the optimal soft-thresholding power for the scale-free network. (B) Module clustering dendrograms. (C) Correlation analysis of the module most associated with HOXA10 (Pearson’s correlation coefficient and the corresponding p-value are shown in the horizonal bars). (D) Cluster plot of the relationship between HOXA10 and the 37 modules. (E) Scatter plot of the genes in salmon4 module showing the relationship between GS and MM (GS, gene significance; MM, module membership).
Figure 4
Figure 4
Selection and enrichment analysis of the key genes. (A) Venn diagrams showing the candidate genes between the 636 DEGs and 180 HOXA10-associated genes. (B) PPI network of the candidate genes. (C) Key genes selected by MCODE APP. (D) Correlation between the HOXA10 and the six selected key genes. (E) GO enrichment analysis of the key genes. (F) KEGG enrichment analysis of the key genes (BP, biological process; CC, cellular component; MF, molecular function).
Figure 5
Figure 5
The regulatory effect of HOXA10 on key genes. (A) Heatmap of key genes in HOXA10OE, ZsGreen, siHOXA10, and siNC groups. (B) The comparison of key genes mRNA expression in HOXA10OE and ZsGreen groups. (C) The comparison of key genes mRNA expression in siHOXA10 and siNC groups (HOXA10OE, HOXA10 over expression ESC; ZsGreen, control for over-expression group; siHOXA10, HOXA10 silence ESC; siNC, control for silence group. *p<0.05, **p<0.01, ***p<0.001, ****p<0.0001; ns, no significant difference).
Figure 6
Figure 6
Validation of mRNA expression of six key genes by qPCR. (A) The relative mRNA expressions of the six key genes in HOXA10OE and ZsGreen groups. (B) The relative mRNA expressions of the six key genes in siHOXA10 and siNC groups (HOXA10OE, HOXA10 over expression ESC; ZsGreen, control for HOXA10OE; siHOXA10, HOXA10 silence ESC; siNC, control for silence group; *p<0.05, **p<0.01, ***p<0.001. ns, no significant difference).
Figure 7
Figure 7
The MRs and mRNA expression of HOXA10 in NC, EU and OC. (A) The MRs of representative CpGs detected by ddPCR. (B) The mRNA expression of HOXA10 in EU and OC. (C) The correlation between MRs and HOXA10 mRNA expression. (D) The comparisons of MR in EU and OC from the same patients. (E) The comparisons of HOXA10 mRNA expression in EU and OC from the same patients. (F) The correlation between MRs and HOXA10 mRNA expressions in EU and OC from the same patients (MR, methylation rate; EU, eutopic endometrial tissues; OC, ovarian cyst; NC, normal control).

Similar articles

Cited by

References

    1. Giudice L. Clinical Practice. Endometriosis. N Engl J Med (2010) 362:2389–98. doi: 10.1056/NEJMcp1000274 - DOI - PMC - PubMed
    1. Andersson KL, Bussani C, Fambrini M, Polverino V, Taddei GL, Gemzell-Danielsson K, et al. . DNA Methylation of HOXA10 in Eutopic and Ectopic Endometrium. Hum Reprod (2014) 29:1906–11. doi: 10.1093/humrep/deu161 - DOI - PubMed
    1. Fuldeore MJ, Soliman AM. Prevalence and Symptomatic Burden of Diagnosed Endometriosis in the United States: National Estimates From a Cross-Sectional Survey of 59,411 Women. Gynecol Obstet Invest (2017) 82:453–61. doi: 10.1159/000452660 - DOI - PubMed
    1. Taylor HS, Giudice LC, Lessey BA, Abrao MS, Kotarski J, Archer DF, et al. . Treatment of Endometriosis-Associated Pain With Elagolix, an Oral GnRH Antagonist. N Engl J Med (2017) 377:28–40. doi: 10.1056/NEJMoa1700089 - DOI - PubMed
    1. Bulun S. Endometriosis. EN Engl J Med (2009) 360:268–79. doi: 10.1056/NEJMra0804690 - DOI - PubMed