. 2022 Apr 25:13:864631.
doi: 10.3389/fendo.2022.864631. eCollection 2022.

Knockout of Nur77 Leads to Amino Acid, Lipid, and Glucose Metabolism Disorders in Zebrafish

Affiliations

Knockout of Nur77 Leads to Amino Acid, Lipid, and Glucose Metabolism Disorders in Zebrafish

Yang Xu et al. Front Endocrinol (Lausanne). .

Abstract

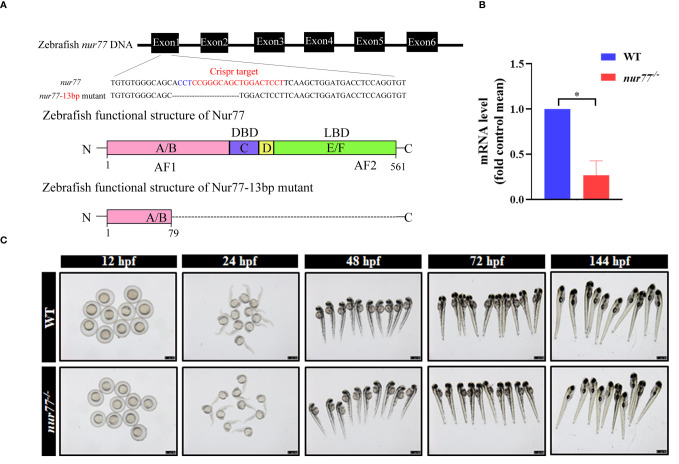
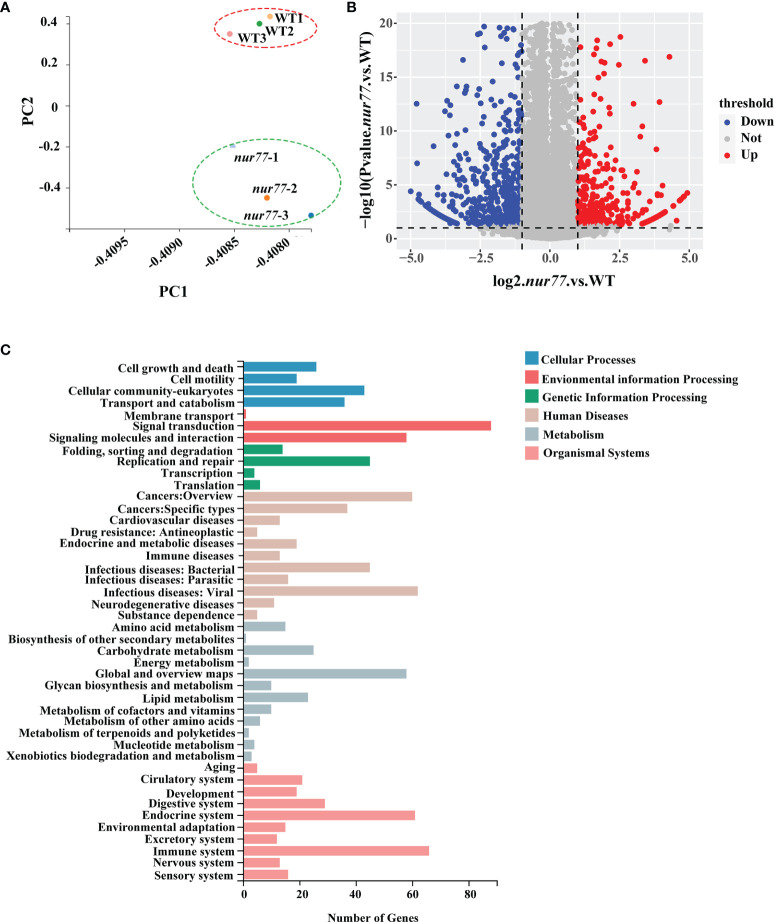
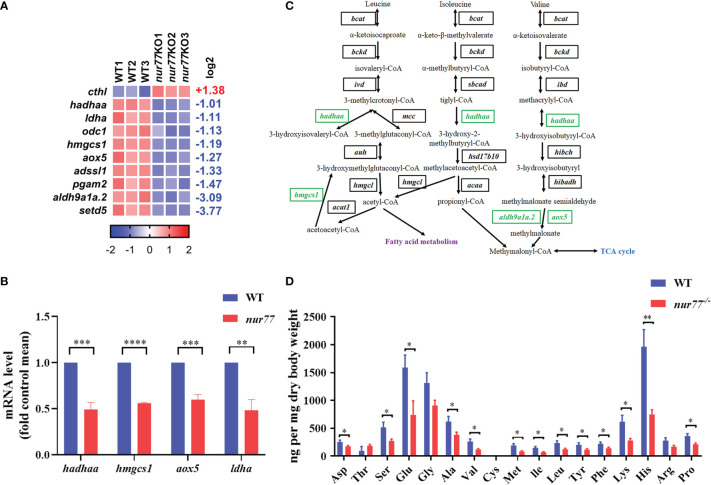
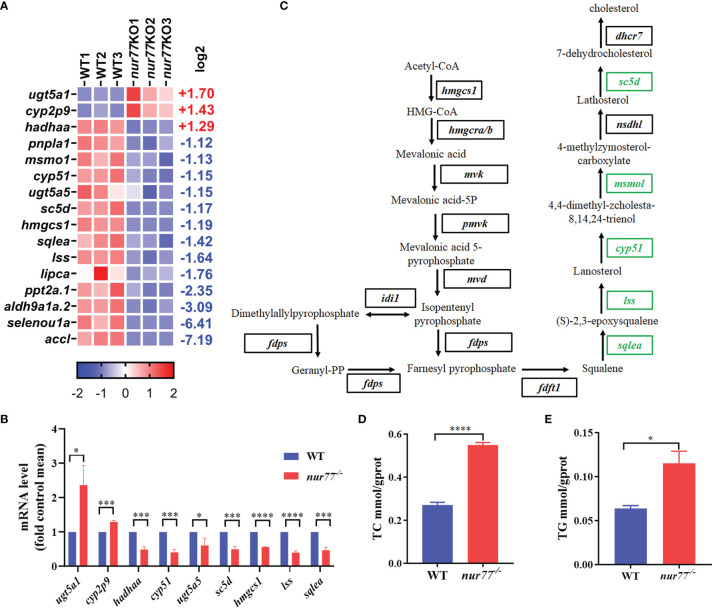
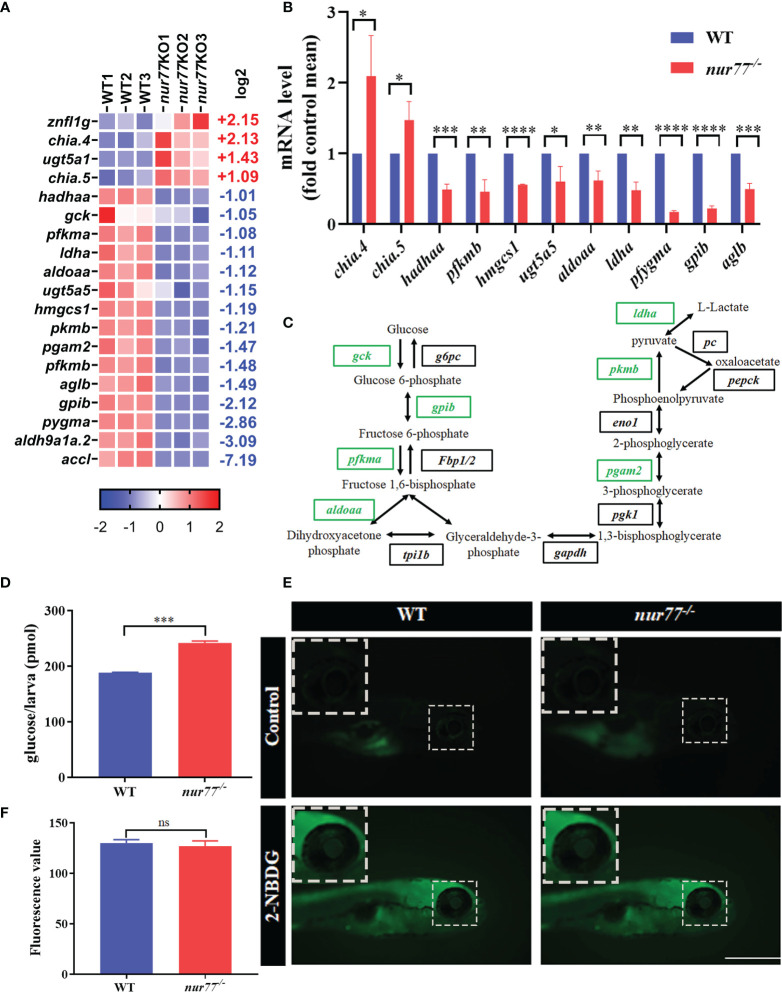
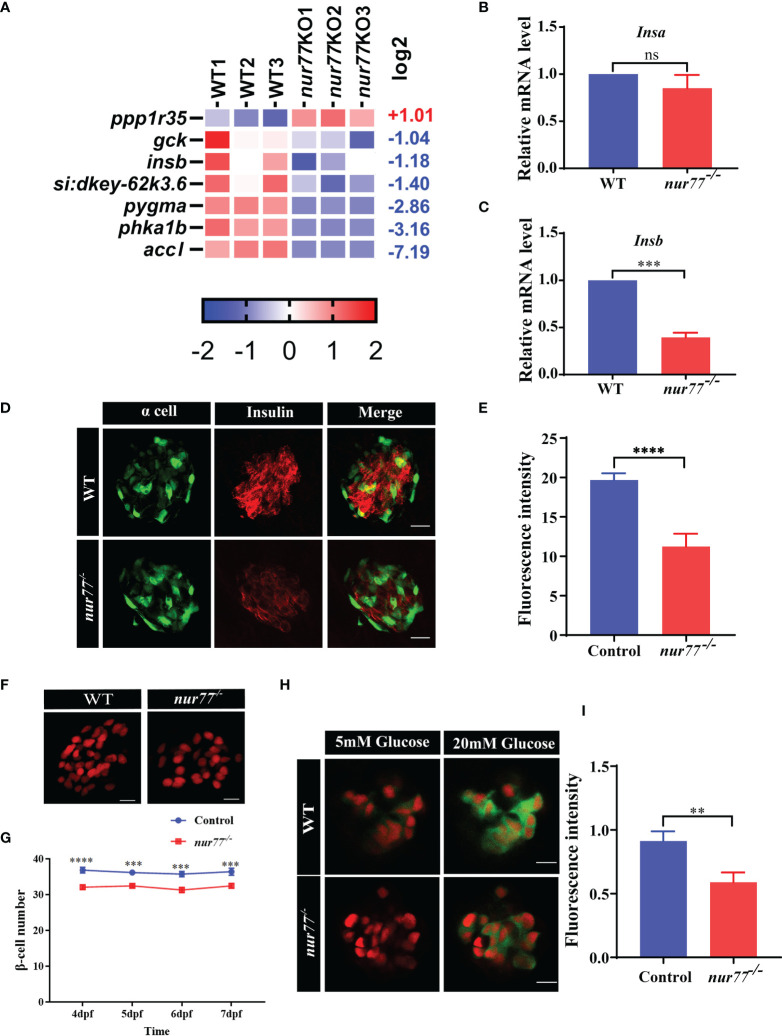
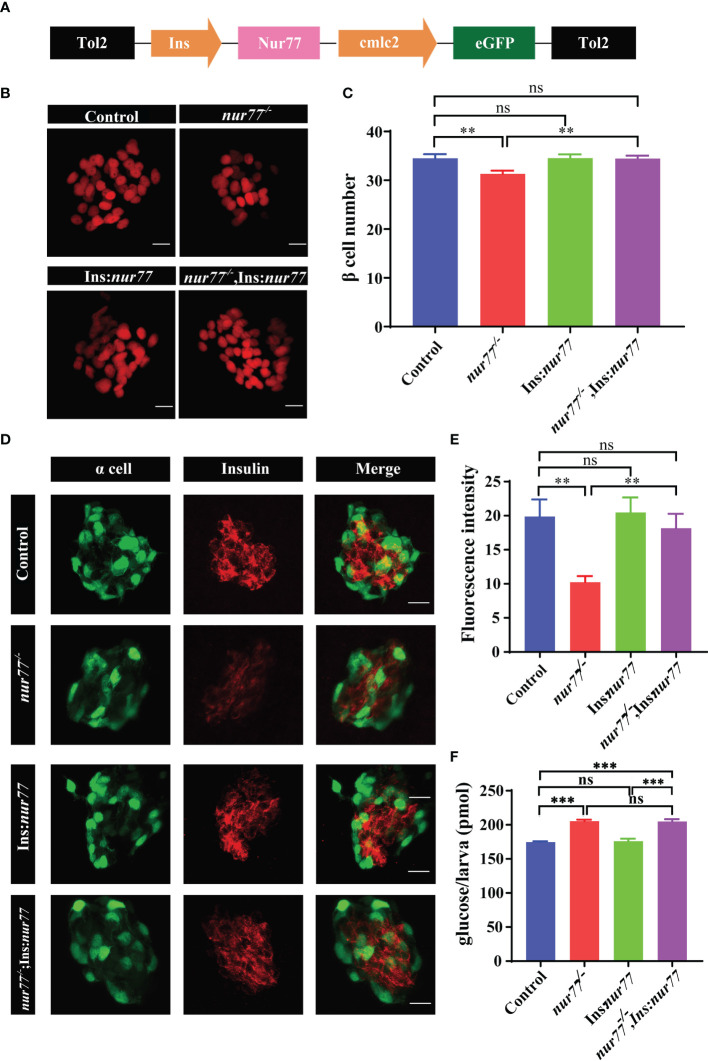
Orphan nuclear receptor Nur77 has been reported to be implicated in a diverse range of metabolic processes, including carbohydrate metabolism and lipid metabolism. However, the detailed mechanism of Nur77 in the regulation of metabolic pathway still needs to be further investigated. In this study, we created a global nur77 knockout zebrafish model by CRISPR/Cas9 technique, and then performed whole-organism RNA sequencing analysis in wildtype and nur77-deficient zebrafish to dissect the genetic changes in metabolic-related pathways. We found that many genes involved in amino acid, lipid, and carbohydrate metabolism changed by more than twofold. Furthermore, we revealed that nur77-/- mutant displayed increased total cholesterol (TC) and triglyceride (TG), alteration in total amino acids, as well as elevated glucose. We also demonstrated that the elevated glucose was not due to the change of glucose uptake but was likely caused by the disorder of glycolysis/gluconeogenesis and the impaired β-cell function, including downregulated insb expression, reduced β-cell mass, and suppressed insulin secretion. Importantly, we also verified that targeted expression of Nur77 in the β cells is sufficient to rescue the β-cell defects in global nur77-/- larvae zebrafish. These results provide new information about the global metabolic network that Nur77 signaling regulates, as well as the role of Nur77 in β-cell function.

Keywords: Nur77; glucose metabolism; lipid metabolism; transcriptomics; zebrafish; β cells.


Conflict of interest statement

The authors declare that the research was conducted in the absence of any commercial or financial relationships that could be construed as a potential conflict of interest.

Figures

Figure 1
Figure 1
Knockout of nur77 in zebrafish by Crispr/Cas9. (A) Schematic representations of Crispr-Cas9 targets and mutant alleles. nur77 consists of 6 exons (filled box). The sgRNA target exon 1, and the sequences of the target region were aligned to the selected allele. The target site was in red font, and the PAM site was in blue font. The obtained nur77−/− zebrafish mutant lacked 13 bp bases, causing protein translation to stop prematurely. (B) The validation of the expression level of nur77 by qRT-PCR analysis (n = 3); * p < 0.05 by t-test. (C) The morphology of WT and nur77−/− in developmental stages of 12, 24, 48, 72, and 144 hpf. Scale bars indicate 750 μm.
Figure 2
Figure 2
RNA-seq (RNA sequencing) analysis of nur77−/− mutant zebrafish. (A) Principal component analysis (PCA) plot of three wild-type and three nur77 −/− mutant RNA-seq datasets. Principal component 1 (PC1) and principal component 2 (PC2) were used for analysis. (B) Volcano plot of differential gene expression analysis of nur77 −/− mutant and control larvae showing the relationship between p-value and log fold changes. Red shows upregulated genes and blue downregulated genes. (C) Kyoto Encyclopedia of Genes and Genomes (KEGG) enrichment analysis of DEGs in pathways. The y-axis indicates pathways, and the x-axis indicates the number of DEGs.
Figure 3
Figure 3
Nur77 regulates amino acid metabolism in zebrafish larvae. (A) Heatmaps of transcripts in amino acid metabolism enrichment. Colors represent high (red), low (blue), or average (white) expression values based on Z-score-normalized fragments per kilobase per million mapped read (FPKM) values for each gene. The Z-score indicators are shown under each map. The fold change (log2) is shown on the right. (B) The validation of the expression levels of differentially expressed genes by qRT-PCR analysis in the categories of amino acid metabolism (n = 3). (C) Disturbed valine, leucine, and isoleucine degradation. Blocks represent transcript-encoded enzymes. Green blocks represent downregulated genes, and black blocks represent unchanged genes. (D) Amino acids compositions in WT and nur77 −/− embryos. Results are represented as means with standard errors (n = 3); * p < 0.05; ** p < 0.01; ***p < 0.001, ****p < 0.0001 by t-test.
Figure 4
Figure 4
Nur77 regulates lipid metabolism in zebrafish larvae. (A) Heatmaps of transcripts in lipid metabolism enrichment. Colors represent high (red), low (blue), or average (white) expression values based on Z-score-normalized fragments per kilobase per million mapped read (FPKM) values for each gene. The Z-score indicators are shown under each map. The fold change (log2) is shown on the right. (B) The validation of the expression levels of differentially expressed genes by qRT-PCR analysis in the categories of lipid metabolism (n = 3). (C) Disturbed cholesterol biosynthesis. Blocks represent transcript-encoded enzymes. Green blocks represent downregulated genes, and black blocks represent unchanged genes. (D) The whole-body cholesterol (TC) contents of WT and nur77 −/− zebrafish (n = 3). (E) The whole-body total triglyceride (TG) contents of WT and nur77 −/− zebrafish. Results are represented as means with standard errors (n = 3); * p < 0.05, *** p < 0.001, **** p < 0.0001 by t-test.
Figure 5
Figure 5
Nur77 regulates carbohydrate metabolism in zebrafish larvae. (A) Heatmaps of transcripts in carbohydrate metabolism enrichment. Colors represent high (red), low (blue), or average (white) expression values based on Z-score-normalized fragments per kilobase per million mapped read (FPKM) values for each gene. The Z-score indicators are shown under each map. The fold change (log2) is shown on the right. (B) The validation of the expression levels of differentially expressed genes by qRT-PCR analysis in the categories of carbohydrate metabolism (n = 3). (C) Disturbed glycolysis/gluconeogenesis. Blocks represent transcript-encoded enzymes. Green blocks represent downregulated genes, and black blocks represent unchanged genes. (D) The total free glucose contents of WT and nur77 −/− zebrafish (n = 3). (E) 2-NBDG glucose uptake of wildtype and nur77 −/− mutant larvae; the glucose uptake level is indicated by the fluorescence of lens (arrow) imaged by fluorescent microscopy. Wildtype and nur77 −/− without 2-NBDG were used for control groups (upper panel). (F) Eye fluorescence intensity was measured based on images. Quantification of fluorescence intensity for WT and nur77 −/− zebrafish larvae. Results were represented as means with standard errors (n = 3); ns, no significance; * p < 0.05, ** p < 0.01, *** p < 0.001, **** p < 0.0001 by t-test.
Figure 6
Figure 6
Nur77 regulates insulin secretion and β-cell number in zebrafish larvae. (A) Heatmaps of transcripts in insulin signaling pathway. Colors represent high (red), low (blue), or average (white) expression values based on Z-score-normalized fragments per kilobase per million mapped read (FPKM) values for each gene. (B, C) The validation of the expression levels of insulin genes by qRT-PCR analysis in WT and nur77 −/− zebrafish larvae, (B) insa (n = 3), (C) and insb (n = 3). (D, E) The insulin contents in WT and nur77 −/− zebrafish larvae. (D) Representative images of the fluorescence of α cell and β cell from control and nur77 −/−; α cells are indicated by the green fluorescence with Tg(gcg:eGFP), β cell are indicated with red fluorescence by immunostaining with insulin antibody. (E) Quantification of β-cell fluorescence intensity from control and nur77 −/−. The number of larvae (n = 12~18). (F, G) The number of pancreatic β cells in Tg(Ins:H2BmCherry) and nur77−/−;Tg(Ins:H2BmCherry) zebrafish larvae. (F) Representative images of the β-cell (red) number in Tg(Ins:H2BmCherry) and nur77−/−;Tg(Ins:H2BmCherry) at 6 dpf. (G) Quantification of β-cell number in Tg(Ins:H2BmCherry) and nur77−/−;Tg(Ins:H2BmCherry) from 4 to 7 dpf zebrafish larvae (n = 19~50). (H, I) The glucose-stimulated GCaMP6s response in β cells of Tg(Ins:H2BmCherry);Tg(Ins:GCaMP6s) and nur77−/−;Tg(Ins:H2BmCherry);Tg(Ins:GCaMP6s). (H) Representative images of GCaMP6s response in β cells of Tg(Ins:H2BmCherry);Tg(Ins:GCaMP6s) and nur77−/−;Tg(Ins:H2BmCherry);Tg(Ins:GCaMP6s) by 5 or 20 mM glucose ECS solution; green signal is GCaMP6. (I) Quantification of GCaMP6s response (GFP fluorescence intensity) in β cells of Tg(Ins:H2BmCherry);Tg(Ins:GCaMP6s) and nur77−/− nur77−/−;Tg(Ins:H2BmCherry);Tg(Ins:GCaMP6s). Results are represented as means with standard errors (n = 13~20); ns, no significance; ** p < 0.01, *** p < 0.001, **** p < 0.0001 by t-test.
Figure 7
Figure 7
Targeted expression of Nur77 in β cells restored β-cell number and insulin content in zebrafish. (A) Schematic representation of the Tg(Ins : Nur77; cmlc2:eGFP) transgenic line and the expression pattern. Expression of Nur77 was controlled by the zebrafish insulin promoter with cmlc2-driven eGFP used as an indication of transgene carriers. (B, C) Representative images (B) and quantification (C) of β-cell number in Tg(Ins:H2BmCherry), nur77−/−;Tg(Ins:H2BmCherry), Tg(Ins : Nur77);Tg(Ins:H2BmCherry) and nur77−/− ; Tg(Ins : Nur77);Tg(Ins:H2BmCherry) zebrafish larvae. The number of larvae (n = 20~30). (D, E) Representative images (D) and quantification (E) of the insulin fluorescence intensity in β cells from Tg(gcg:eGFP), nur77−/− ;(gcg:eGFP), Tg(Ins : Nur77);Tg(gcg:eGFP) and nur77−/− ; Tg(Ins : Nur77);Tg(gcg:eGFP) zebrafish larvae. Tg(gcg:eGFP) was used to indicate the pancreatic α cell, and β cell are indicated with red fluorescence by immunostaining with insulin antibody (n = 12~15). (F) The total free glucose contents in Tg(gcg:eGFP), nur77−/−;(gcg:eGFP), Tg(Ins : Nur77);Tg(gcg:eGFP) and nur77−/− ; Tg(Ins : Nur77);Tg(gcg:eGFP) zebrafish larvae (n = 3). ns, no significance; ** p < 0.01, *** p < 0.001 by one-way ANOVA.

Similar articles

Cited by

References

    1. Hazel TG, Nathans D, Lau LF. A Gene Inducible by Serum Growth Factors Encodes a Member of the Steroid and Thyroid Hormone Receptor Superfamily. Proc Natl Acad Sci USA (1988) 85:8444–8. doi: 10.1073/pnas.85.22.8444 - DOI - PMC - PubMed
    1. Safe S, Karki K. The Paradoxical Roles of Orphan Nuclear Receptor 4A (NR4A) in Cancer. Mol Cancer Res (2021) 19:180–91. doi: 10.1158/1541-7786.MCR-20-0707 - DOI - PMC - PubMed
    1. Maxwell MA, Muscat GE. The NR4A Subgroup: Immediate Early Response Genes With Pleiotropic Physiological Roles. Nucl Recept Signal (2006) 4:e002. doi: 10.1621/nrs.04002 - DOI - PMC - PubMed
    1. Kim YD, Kim SG, Hwang SL, Choi HS, Bae JH, Song DK, et al. . B-Cell Translocation Gene 2 Regulates Hepatic Glucose Homeostasis via Induction of Orphan Nuclear Receptor Nur77 in Diabetic Mouse Model. Diabetes (2014) 63:1870–80. doi: 10.2337/db13-1368 - DOI - PubMed
    1. Rodriguez-Calvo R, Tajes M, Vazquez-Carrera M. The NR4A Subfamily of Nuclear Receptors: Potential New Therapeutic Targets for the Treatment of Inflammatory Diseases. Expert Opin Ther Targets (2017) 21:291–304. doi: 10.1080/14728222.2017.1279146 - DOI - PubMed

LinkOut - more resources