Enhanced Biosynthesis of Fatty Acids Contributes to Ciprofloxacin Resistance in Pseudomonas aeruginosa
- PMID: 35547113
- PMCID: PMC9083408
- DOI: 10.3389/fmicb.2022.845173
Enhanced Biosynthesis of Fatty Acids Contributes to Ciprofloxacin Resistance in Pseudomonas aeruginosa
Abstract
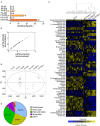
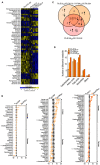
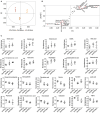
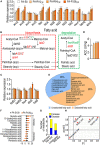
Antibiotic-resistant Pseudomonas aeruginosa is insensitive to antibiotics and difficult to deal with. An understanding of the resistance mechanisms is required for the control of the pathogen. In this study, gas chromatography-mass spectrometer (GC-MS)-based metabolomics was performed to identify differential metabolomes in ciprofloxacin (CIP)-resistant P. aeruginosa strains that originated from P. aeruginosa ATCC 27853 and had minimum inhibitory concentrations (MICs) that were 16-, 64-, and 128-fold (PA-R16CIP, PA-R64CIP, and PA-R128CIP, respectively) higher than the original value, compared to CIP-sensitive P. aeruginosa (PA-S). Upregulation of fatty acid biosynthesis forms a characteristic feature of the CIP-resistant metabolomes and fatty acid metabolome, which was supported by elevated gene expression and enzymatic activity in the metabolic pathway. The fatty acid synthase inhibitor triclosan potentiates CIP to kill PA-R128CIP and clinically multidrug-resistant P. aeruginosa strains. The potentiated killing was companied with reduced gene expression and enzymatic activity and the returned abundance of fatty acids in the metabolic pathway. Consistently, membrane permeability was reduced in the PA-R and clinically multidrug-resistant P. aeruginosa strains, which were reverted by triclosan. Triclosan also stimulated the uptake of CIP. These findings highlight the importance of the elevated biosynthesis of fatty acids in the CIP resistance of P. aeruginosa and provide a target pathway for combating CIP-resistant P. aeruginosa.
Keywords: Pseudomonas aeruginosa; antibiotic resistance; biosynthesis of fatty acids; ciprofloxacin; membrane permeability; metabolomics.
Copyright © 2022 Su, Tang, Zhu, Yang, Pan, Li and Chen.
Conflict of interest statement
The authors declare that the research was conducted in the absence of any commercial or financial relationships that could be construed as a potential conflict of interest.
Figures


Similar articles
-
Enhanced Biosynthesis of Fatty Acids Is Associated with the Acquisition of Ciprofloxacin Resistance in Edwardsiella tarda.mSystems. 2021 Aug 31;6(4):e0069421. doi: 10.1128/mSystems.00694-21. Epub 2021 Aug 24. mSystems. 2021. PMID: 34427511 Free PMC article.
-
Adaptive response of Pseudomonas aeruginosa under serial ciprofloxacin exposure.Microbiology (Reading). 2024 Apr;170(3):001443. doi: 10.1099/mic.0.001443. Microbiology (Reading). 2024. PMID: 38568202 Free PMC article.
-
Inactivation of Nitrite-Dependent Nitric Oxide Biosynthesis Is Responsible for Overlapped Antibiotic Resistance between Naturally and Artificially Evolved Pseudomonas aeruginosa.mSystems. 2021 Oct 26;6(5):e0073221. doi: 10.1128/mSystems.00732-21. Epub 2021 Sep 21. mSystems. 2021. PMID: 34546070 Free PMC article.
-
Embelin-loaded chitosan gold nanoparticles interact synergistically with ciprofloxacin by inhibiting efflux pumps in multidrug-resistant Pseudomonas aeruginosa and Escherichia coli.Environ Res. 2021 Aug;199:111321. doi: 10.1016/j.envres.2021.111321. Epub 2021 May 12. Environ Res. 2021. PMID: 33989619
-
Deficiency of quorum sensing system inhibits the resistance selection of Pseudomonas aeruginosa to ciprofloxacin and levofloxacin in vitro.J Glob Antimicrob Resist. 2017 Sep;10:113-119. doi: 10.1016/j.jgar.2017.04.008. Epub 2017 Jul 17. J Glob Antimicrob Resist. 2017. PMID: 28729210
Cited by
-
Ciprofloxacin-Loaded Inhalable Formulations against Lower Respiratory Tract Infections: Challenges, Recent Advances, and Future Perspectives.Pharmaceutics. 2024 May 11;16(5):648. doi: 10.3390/pharmaceutics16050648. Pharmaceutics. 2024. PMID: 38794310 Free PMC article. Review.
-
Metabolic Changes in Pseudomonas oleovorans Isolated from Contaminated Construction Material Exposed to Varied Biocide Treatments.Metabolites. 2024 Jun 10;14(6):326. doi: 10.3390/metabo14060326. Metabolites. 2024. PMID: 38921461 Free PMC article.
-
Metabolic state-driven nutrient-based approach to combat bacterial antibiotic resistance.NPJ Antimicrob Resist. 2025 Apr 4;3(1):24. doi: 10.1038/s44259-025-00092-5. NPJ Antimicrob Resist. 2025. PMID: 40185857 Free PMC article. Review.
-
Glutamine potentiates gentamicin to kill lab-evolved gentamicin-resistant and clinically isolated multidrug-resistant Escherichia coli.Front Microbiol. 2022 Dec 2;13:1071278. doi: 10.3389/fmicb.2022.1071278. eCollection 2022. Front Microbiol. 2022. PMID: 36532472 Free PMC article.
References
-
- Ahmed M. N., Abdelsamad A., Wassermann T., Porse A., Becker J., Sommer M. O. A., et al. . (2020). The evolutionary trajectories of P. aeruginosa in biofilm and planktonic growth modes exposed to ciprofloxacin: beyond selection of antibiotic resistance. NPJ Biofilms Microbiomes 6, 28. 10.1038/s41522-020-00138-8 - DOI - PMC - PubMed
-
- Ahmed M. N., Porse A., Sommer M. O. A., Høiby N., Ciofu O. (2018). Evolution of antibiotic resistance in biofilm and planktonic Pseudomonas aeruginosa populations exposed to subinhibitory levels of ciprofloxacin. Antimicrob. Agents Chemother. 62, e00320–e00318. 10.1128/AAC.00320-18 - DOI - PMC - PubMed
LinkOut - more resources
Full Text Sources
Molecular Biology Databases
Miscellaneous

