. 2022 Apr 25:13:886983.
doi: 10.3389/fgene.2022.886983. eCollection 2022.

Identification of Neoantigens and Construction of Immune Subtypes in Prostate Adenocarcinoma

Affiliations

Identification of Neoantigens and Construction of Immune Subtypes in Prostate Adenocarcinoma

Yukui Gao et al. Front Genet. .

Abstract

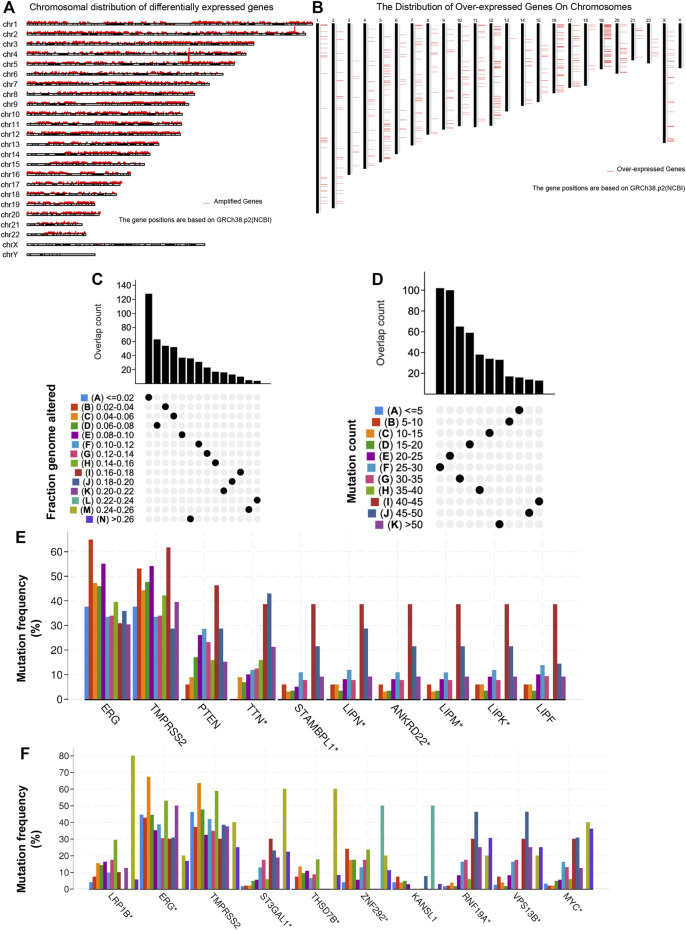
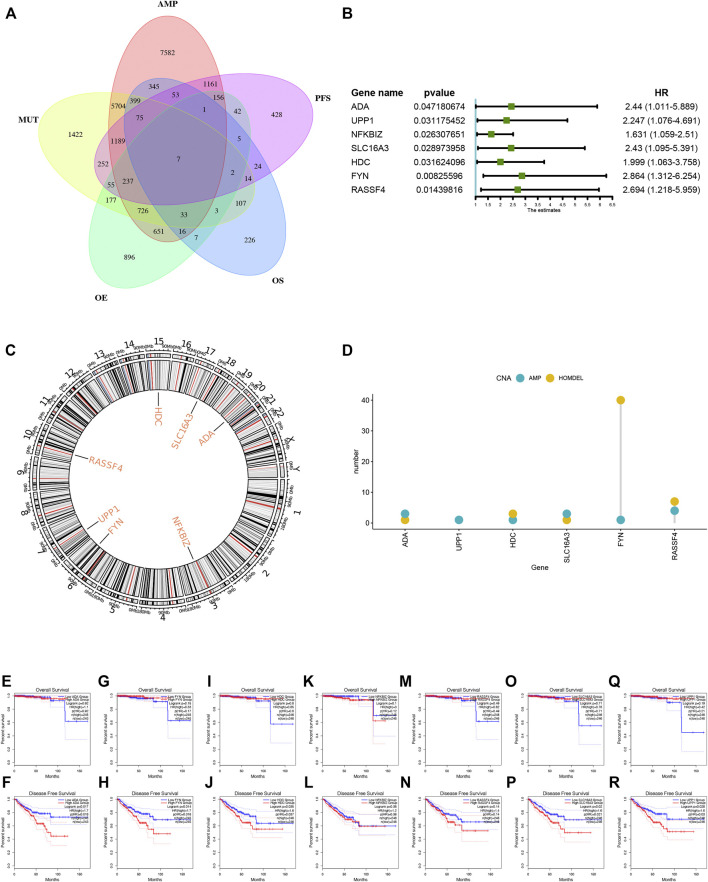
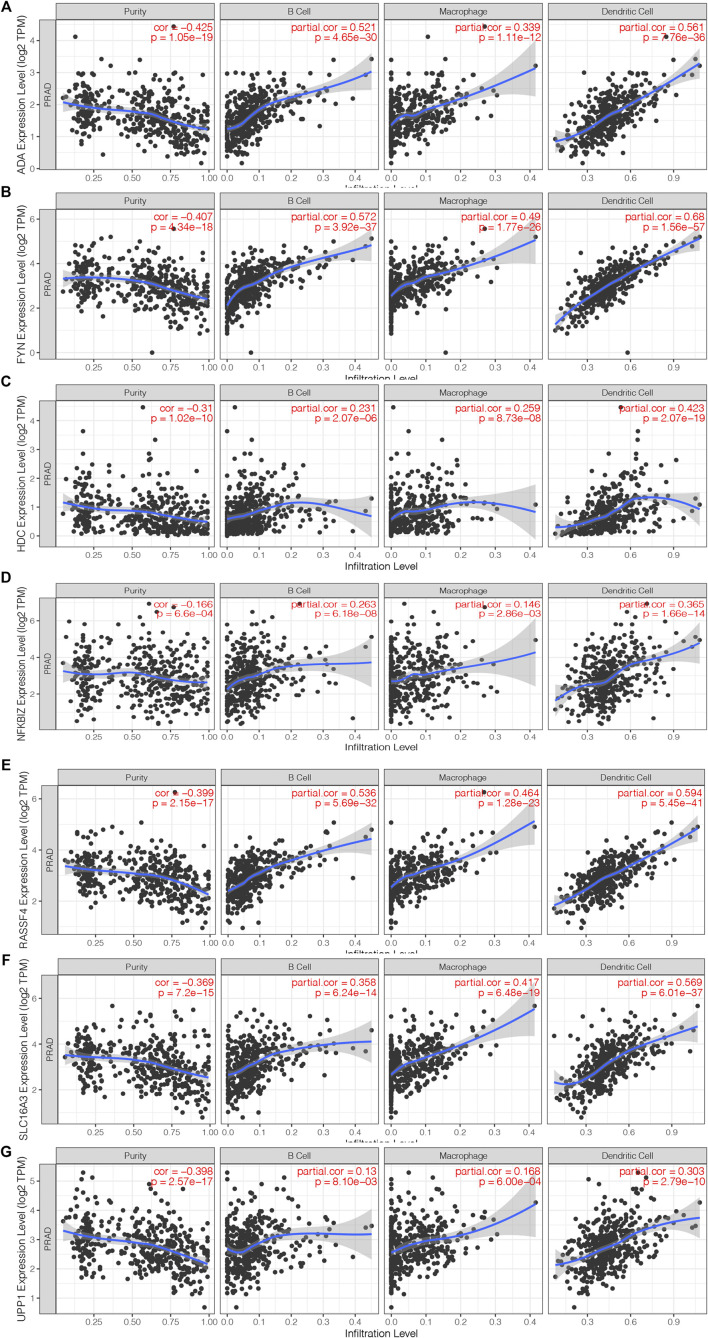
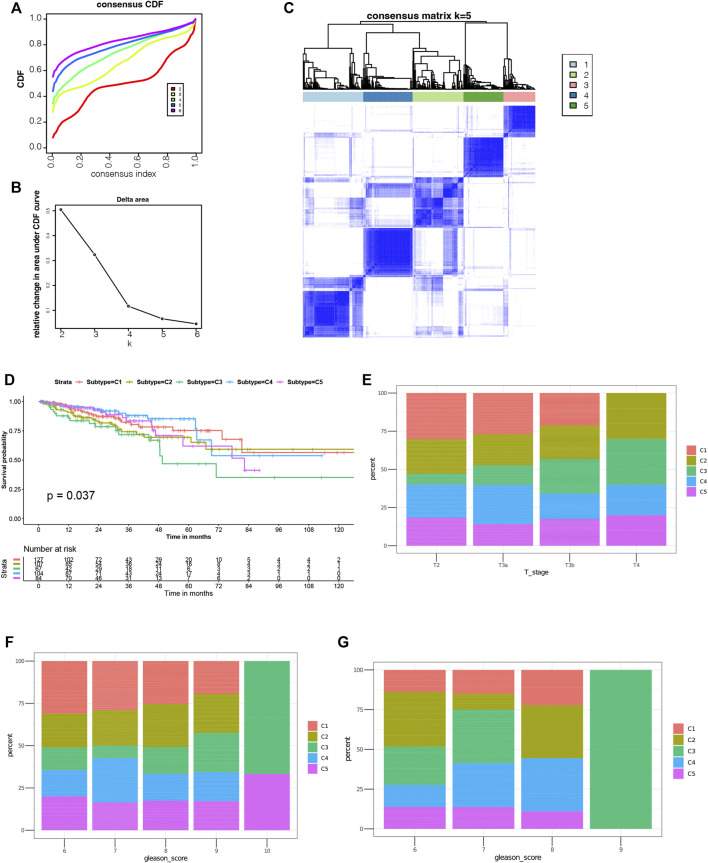
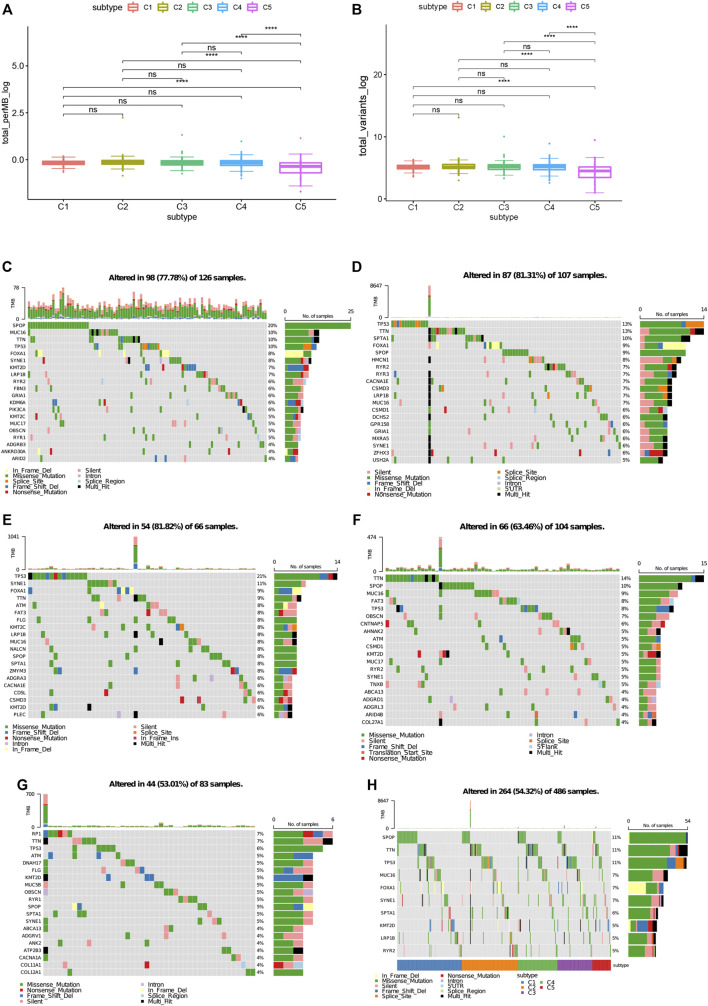
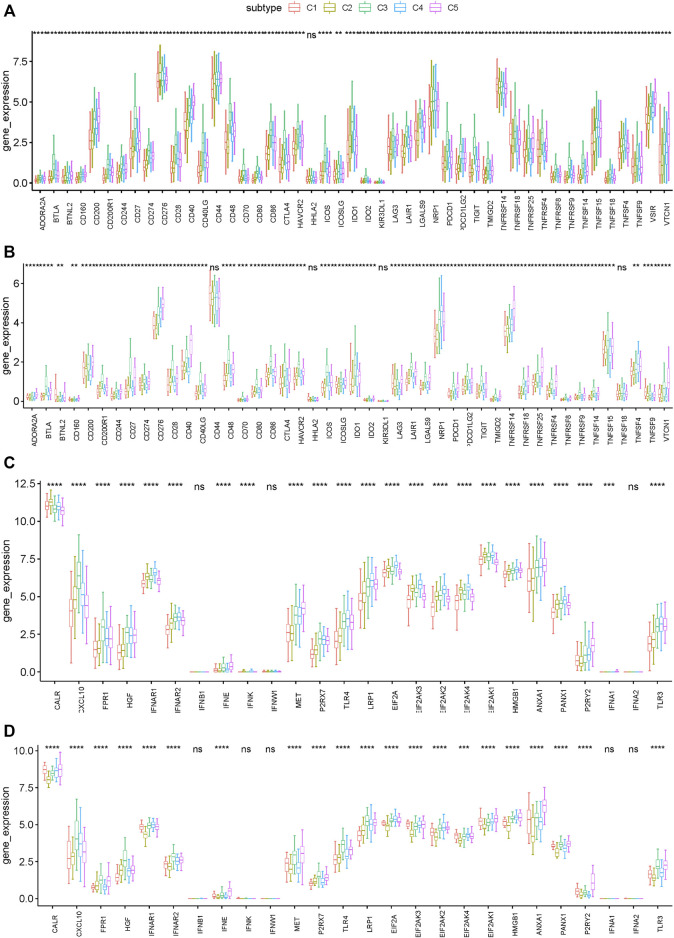
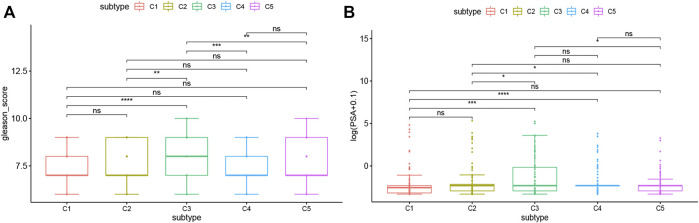
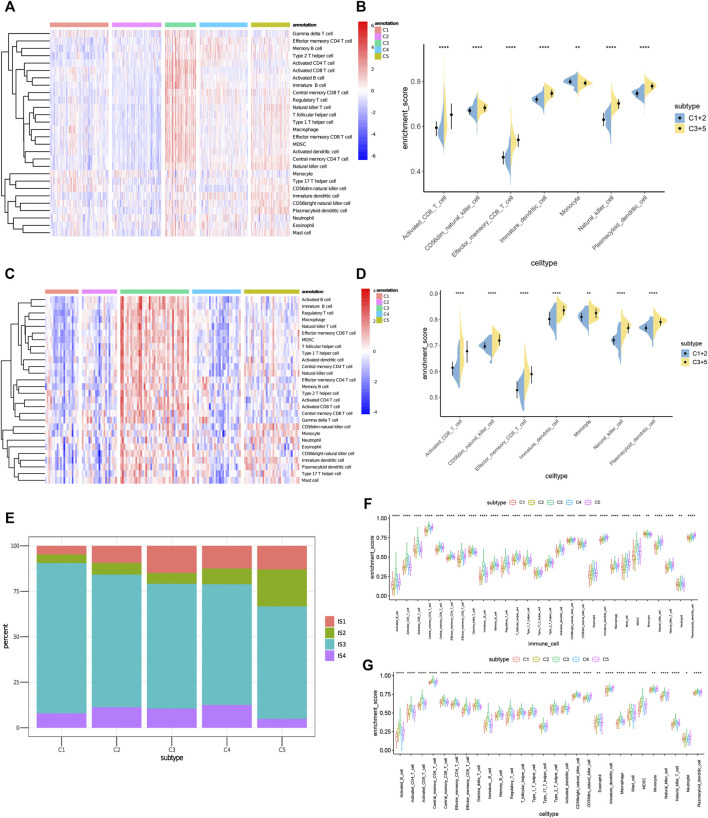
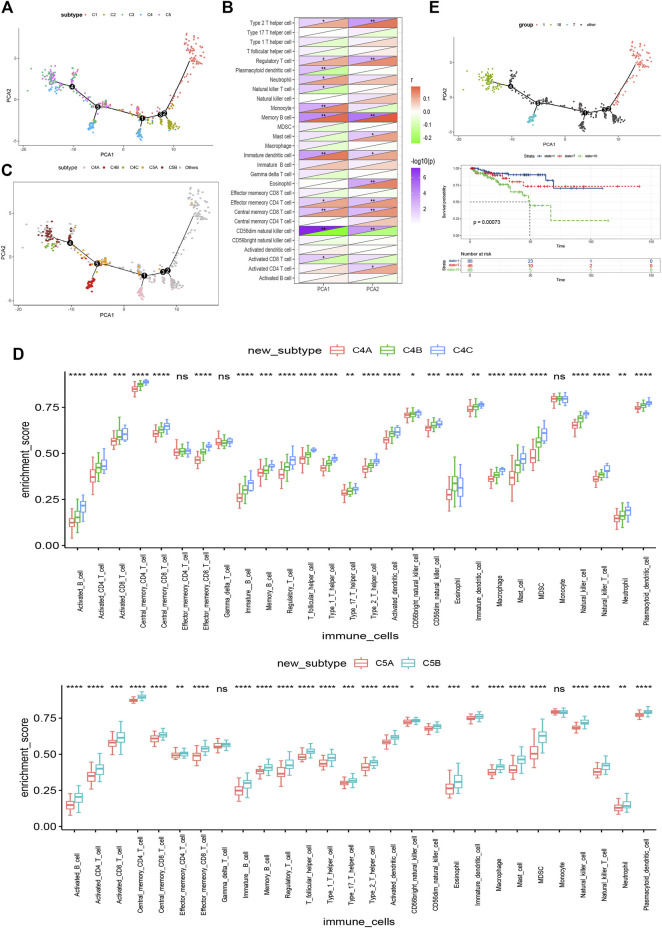
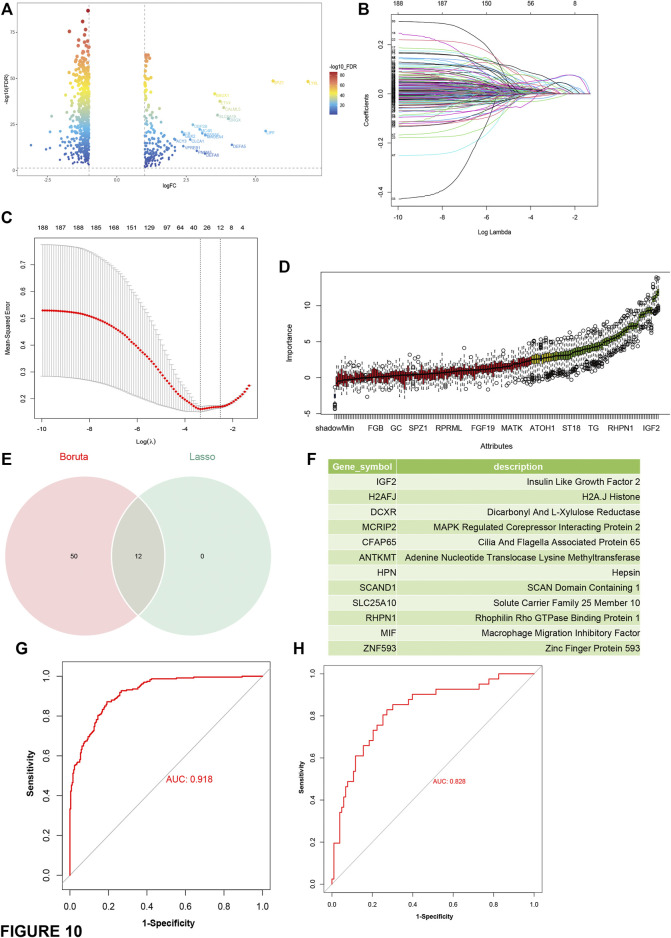
Background: Messenger ribonucleic acid (mRNA) vaccine has been considered as a potential therapeutic strategy and the next research hotspot, but their efficacy against prostate adenocarcinoma (PRAD) remains undefined. This study aimed to find potential antigens of PRAD for mRNA vaccine development and identify suitable patients for vaccination through immunophenotyping. Methods: Gene expression profiles and clinical information were obtained from TCGA and ICGC. GEPIA2 was used to calculate the prognostic index of the selected antigens. The genetic alterations were compared on cBioPortal and the correlation between potential antigen and immune infiltrating cells was explored by TIMER. ConsensusClusterPlus was used to construct a consistency matrix, and identify the immune subtypes. Graph learning-based dimensional reduction was performed to depict immune landscape. Boruta algorithm and LASSO logistic analysis were used to screen PRAD patients who may benefit from mRNA vaccine. Results: Seven potential tumor antigens selected were significantly positively associated with poor prognosis and the antigen-presenting immune cells (APCs) in PRAD, including ADA, FYN, HDC, NFKBIZ, RASSF4, SLC6A3, and UPP1. Five immune subtypes of PRAD were identified by differential molecular, cellular, and clinical characteristics in both cohorts. C3 and C5 had immune "hot" and immunosuppressive phenotype, On the contrary, C1&C2 had immune "cold" phenotype. Finally, the immune landscape characterization showed the immune heterogeneity among patients with PRAD. Conclusions: ADA, FYN, HDC, NFKBIZ, RASSF4, SLC6A3, and UPP1 are potential antigens for mRNA vaccine development against PRAD, and patients in type C1 and C2 are suitable for vaccination.

Keywords: immune landscape; immunotype; mRNA vaccine; prostate adenocarcinoma; tumor immune microenvironment.


Conflict of interest statement

The authors declare that the research was conducted in the absence of any commercial or financial relationships that could be construed as a potential conflict of interest.

Figures

FIGURE 1
FIGURE 1
Identification of potential tumor antigens in PRAD. (A) The chromosomal distribution of the aberrant copy number genes in PRAD is shown. (B) The chromosomal distribution of over-expressed genes in PRAD is shown. (C–F) Identification of potential tumor-specific antigens in PRAD. Overlapping mutated genes distributed in the fraction genome altered group (C) and mutation count group (D) are shown. Genes with the highest frequency in the mutation count groups (E) and fraction genome altered groups (F) are individually shown.
FIGURE 2
FIGURE 2
Identification of tumor antigens associated with PRAD prognosis. (A) Venn diagram identifying the potential tumor antigens with both amplified and mutated features, and significant OS and PFS prognosis (in a total of 7 candidates) in PRAD. (B) Forest maps of single factor survival analysis of 7 genes of PAAD. (C) Circos plots of 7 genes revealing the position of chromosomes. (D) The amplified and Homdel state of 7 candidate genes. (E–R) Kaplan-Meier OS and PFS curves comparing the groups with different expression of ADA (E–F), FYN (G,H), HDC (I,J), NFKBIZ (K,L), RASSF4 (M,N), SLC16A3 (O,P) and UPP1 (Q,R) in PRAD.
FIGURE 3
FIGURE 3
Identification of tumor antigens associated with antigen-presenting cells. (A–G) Correlation of 7 candidate genes with antigen presenting cells. Association of ADA (A), FYN (B), HDC (B), NFKBIZ (D), RASSF4 (E), SLC16A3 (F) and UPP1 (G) expression with the purity of infiltrating cells and amount of macrophages, dendritic cells and B cells in PRAD.
FIGURE 4
FIGURE 4
Identification of potential immune subtypes of PRAD. (A) Cumulative distribution function curve and (B) delta area of immune-related genes in TCGA cohort. (C) Sample clustering heat map. (D) Kaplan-Meier curves showing prognosis of PRAD immune subtypes in TCGA cohort. (E,F) Distribution of C1-C5 across PRAD (E) stages and (F) Gleason score in TCGA cohort. g Distribution ratio of C1-C5 across PRAD Gleason score in ICGC cohort.
FIGURE 5
FIGURE 5
Association between immune subtypes and TMB and mutation. (A) TMB and (B) mutation number in PRAD C1-C5. (C) Top highly mutated genes in PRAD immune subtypes C1. (D) Top highly mutated genes in PRAD immune subtypes C2. (E) Top highly mutated genes in PRAD immune subtypes C3. (F) Top highly mutated genes in PRAD immune subtypes C4. (G) Top highly mutated genes in PRAD immune subtypes C5. (H) Eleven highly mutated genes in PRAD immune subtypes. *p < 0.01, **p < 0.001, ***p < 0.0001, and ****p < 0.00001.
FIGURE 6
FIGURE 6
Association between immune subtypes and ICPs and ICD modulators. (A,B) Differential expression of ICP genes among the PRAD immune subtypes in (A) TCGA and (B) ICGC cohorts. (C,D) Differential expression of ICD modulator genes among the PRAD immune subtypes in (C) TCGA and (D) ICGC cohorts. *p < 0.01, **p < 0.001, ***p < 0.0001, and ****p < 0.00001.
FIGURE 7
FIGURE 7
Association between immune subtypes and Gleason score and serum PSA level. (A) Gleason score in PRAD immune subtypes in TCGA cohorts. (B) serum PSA level in PRAD immune subtypes in TCGA cohorts.
FIGURE 8
FIGURE 8
Cellular and molecular characteristics of immune subtypes. (A,C) Differential enrichment scores of 28 immune cell signatures among PRAD immune subtypes in (A) TCGA and (C) ICGC cohorts. (B,D) Differential enrichment scores of 7 prognostically relevant immune cell signatures in (B) TCGA and (D) ICGC cohorts. (E) Overlap of PRAD immune subtypes with 4 pan-cancer immune subtypes IS1-IS4. (F,G) Differential enrichment scores of 28 immune signatures among PRAD immune subtypes in (F) TCGA and (G) ICGC cohorts.
FIGURE 9
FIGURE 9
Immune landscape of PRAD. (A) Immune landscape of PRAD. each point represents a patient and the immune subtypes are color-coded. The horizontal axis represents the first principal component and the vertical axis represents the second principal component. (B) Heat map of two principal components with 28 immune cell signatures. (C) Immune landscape of the subsets of PRAD immune subtypes. (D) Differential enrichment scores of 28 immune cell signatures in the above subsets. (E) Immune landscape of samples from three extreme locations and (F) their prognostic status.
FIGURE 10
FIGURE 10
Construction and evaluation of predictors based on the most representative genes of C1 and C2 subtype. (A) Volcano plot compares gene expressions between C1 and C2 and other subtypes. Genes with log2 (fold-change) beyond 1 with adjusted p-value (FDR) lower than 0.05 were considered as significantly upregulated in C1 and C2 subtype (B) LASSO regression analysis: coefficient values at varying levels of penalty. Each curve represents a gene. (C) Ten-fold cross-validation was used to calculate the best lambda, contributing to the minimum mean cross-validated error (cvm). (D) Boruta analysis: Importance plot of the genes. Green boxes represent important features (retained), and red boxes represent unimportant features (declined). (E) Venn diagram identifying the most critical C1 and C2 specific variables that were shared by the LASSO and Boruta methods. (F) list of the most representative genes of C1 and C2. (G,H) ROC curves of predictors for distinguishing C1 and C2 subtype and other subtypes in the training cohort (TCGA) (G) and the test cohort (ICGC) (H).

Similar articles

References

    1. Abida W., Cheng M. L., Armenia J., Middha S., Autio K. A., Vargas H. A., et al. (2019). Analysis of the Prevalence of Microsatellite Instability in Prostate Cancer and Response to Immune Checkpoint Blockade. JAMA Oncol. 5 (4), 471–478. 10.1001/jamaoncol.2018.5801 - DOI - PMC - PubMed
    1. Attard G., Parker C., Eeles R. A., Schröder F., Tomlins S. A., Tannock I., et al. (2016). Prostate Cancer. The Lancet 387 (10013), 70–82. 10.1016/S0140-6736(14)61947-4 - DOI - PubMed
    1. Bhattacharya S., Dunn P., Thomas C. G., Smith B., Schaefer H., Chen J., et al. (2018). ImmPort, toward Repurposing of Open Access Immunological Assay Data for Translational and Clinical Research. Sci. Data 5, 180015. 10.1038/sdata.2018.15 - DOI - PMC - PubMed
    1. Bilusic M., Madan R. A., Gulley J. L. (2017). Immunotherapy of Prostate Cancer: Facts and Hopes. Clin. Cancer Res. 23 (22), 6764–6770. 10.1158/1078-0432.CCR-17-0019 - DOI - PMC - PubMed
    1. Boorjian S. A., Thompson R. H., Siddiqui S., Bagniewski S., Bergstralh E. J., Karnes R. J., et al. (2007). Long-term Outcome after Radical Prostatectomy for Patients with Lymph Node Positive Prostate Cancer in the Prostate Specific Antigen Era. J. Urol. 178 (3 Pt 1), 864–871. 10.1016/j.juro.2007.05.048 - DOI - PubMed