. 2022 May 9:8:49.
doi: 10.1038/s41378-022-00383-1. eCollection 2022.

A biosensing system using a multiparameter nonlinear dynamic analysis of cardiomyocyte beating for drug-induced arrhythmia recognition

Affiliations

A biosensing system using a multiparameter nonlinear dynamic analysis of cardiomyocyte beating for drug-induced arrhythmia recognition

Hao Wang et al. Microsyst Nanoeng. .

Abstract

Cardiovascular disease is the number one cause of death in humans. Therefore, cardiotoxicity is one of the most important adverse effects assessed by arrhythmia recognition in drug development. Recently, cell-based techniques developed for arrhythmia recognition primarily employ linear methods such as time-domain analysis that detect and compare individual waveforms and thus fall short in some applications that require automated and efficient arrhythmia recognition from large datasets. We carried out the first report to develop a biosensing system that integrated impedance measurement and multiparameter nonlinear dynamic algorithm (MNDA) analysis for drug-induced arrhythmia recognition and classification. The biosensing system cultured cardiomyocytes as physiologically relevant models, used interdigitated electrodes to detect the mechanical beating of the cardiomyocytes, and employed MNDA analysis to recognize drug-induced arrhythmia from the cardiomyocyte beating recording. The best performing MNDA parameter, approximate entropy, enabled the system to recognize the appearance of sertindole- and norepinephrine-induced arrhythmia in the recording. The MNDA reconstruction in phase space enabled the system to classify the different arrhythmias and quantify the severity of arrhythmia. This new biosensing system utilizing MNDA provides a promising and alternative method for drug-induced arrhythmia recognition and classification in cardiological and pharmaceutical applications.

Keywords: Electrical and electronic engineering; Micro-optics.


Conflict of interest statement

Conflict of interestThe authors declare no competing interests.

Figures

Fig. 1
Fig. 1. Schematic of the biosensing system integrating IDE impedance measurement and MNDA analysis for drug-induced arrhythmia recognition.
a The drug-induced arrhythmia of cardiomyocytes. Sertindole blocks K+ channels on the cell membrane of cardiomyocytes, and norepinephrine (NE) increases the beating rate of cardiomyocytes. They both change the electrophysiological profiles of cardiomyocytes. b The biosensing system recognized arrhythmia from cardiomyocyte mechanical beating signals by MNDA analysis. The interdigitated electrodes collected the cardiomyocyte mechanical beating signals by the impedance measurement technique. The cardiomyocyte beating signals showed significant arrhythmias with the treatment of drugs including sertindole and norepinephrine. The MNDA analysis and PCA clustering recognized and distinguished the arrhythmias from the cardiomyocyte beating signals
Fig. 2
Fig. 2. Design and implementation of the biosensing system combining IDE impedance measurements and MNDA analysis for drug-induced arrhythmia recognition.
a The fabrication procedures of IDEs for cardiomyocyte mechanical beating recording by the impedance measurement technique. b Photo of the IDE devices and optical imaging of IDEs with a microscope. The red box shows the region of optical imaging of IDEs. c Block diagram of the biosensing system for arrhythmia recognition. The DAC module generated specific frequency sinusoidal voltages for the stimulation, and the ADC module received feedback signals for the calculation of the cardiomyocyte beating signals. Several algorithms, including MNDA analysis and PCA clustering, further worked on cardiomyocyte beating signals to achieve arrhythmia recognition and classification
Fig. 3
Fig. 3. MNDA parameter calculation and evaluation.
a Cardiomyocyte mechanical beating recording before drug assay. b Delay time calculated by the correlation method. The optimal delay time is defined when the autocorrelation method decreases to 11e times its original value. cl Statistical comparisons of the MNDA parameters calculated from the beating recordings of cardiomyocyte cultures from the 11th to 14th days. The MNDA parameters consist of c delay time, d correlation dimension, e embedding dimension, f box dimension, g largest Lyapunov exponent, h Kolmogorov entropy, i comentropy, j approximate entropy, k spectral entropy, and l CO complexity. Error bars are S.D. and significant differences were performed by t test, sample number n = 10 recordings for each group, *p < 0.05, **p < 0.01, ***p < 0.001, n.s. not significant
Fig. 4
Fig. 4. Sertindole-induced arrhythmia recognition by the biosensing system using MNDA analysis.
ac Cardiomyocyte mechanical beating recording of a the control group, b the two-peak arrhythmia group, and c the three-peak arrhythmia group. The two-peak and three-peak arrhythmias were both induced by the 0.2 μM sertindole treatment. dk Statistical comparisons of the MNDA parameters among the control group, the two-peak arrhythmia group, and the three-peak arrhythmia group. The MNDA parameters include d delay time, e correlation dimension, f embedding dimension, g box dimension, h comentropy, i approximate entropy, j spectral entropy, and k CO complexity. Error bars are S.D. and significant differences were performed by t-test, n = 10 recordings for each group, *p < 0.05, **p < 0.01, ***p < 0.001, n.s. not significant. l The radar map of delay time, correlation dimension, embedding dimension, box dimension, comentropy, approximate entropy, spectral entropy, and CO complexity for the control group, the two-peak arrhythmia group, and the three-peak arrhythmia group. The approximate entropy was the most sensitive to the occurrence of arrhythmia
Fig. 5
Fig. 5. NE-induced arrhythmia recognition by the biosensing system with MNDA analysis.
ac Cardiomyocyte mechanical beating recording of a the control group, b the 80 nM NE-treated arrhythmia group, and c the 400 nM NE-treated arrhythmia group. The NE-treated arrhythmia groups both showed a faster beating rate than the control, but they did not show distorted peaks in the beating. dk Statistical comparisons of the MNDA parameters among the control group, the 80 nM NE-treated arrhythmia group, and the 400 nM NE-treated arrhythmia group. The MNDA parameters include d delay time, e correlation dimension, f embedding dimension, g box dimension, h comentropy, i approximate entropy, j spectral entropy, and k CO complexity. Error bars are S.D. and significant differences were performed by t test, n = 10 recordings for each group, *p < 0.05, **p < 0.01, ***p < 0.001, n.s. not significant. l The radar map of delay time, correlation dimension, embedding dimension, box dimension, comentropy, approximate entropy, spectral entropy, and CO complexity for the control group, the two-peak arrhythmia group, and the three-peak arrhythmia group. The approximate entropy was the most sensitive to the occurrence of the arrhythmia
Fig. 6
Fig. 6. Arrhythmia classification by the biosensing system with MNDA analysis.
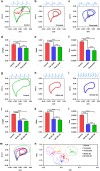
ac Two-dimensional phase space reconstruction of a the control group, b the two-peak arrhythmia group, and c the three-peak arrhythmia group. The two-peak and three-peak arrhythmias were both induced by the 0.2 μM sertindole treatment. df Statistical comparisons of the shape features of the reconstructed plotting among the control group, the two-peak arrhythmia group, and the three-peak arrhythmia group. The shape features include d length, e width, and f area of the reconstructed plot. gi Two-dimensional phase space reconstruction of g the control group, h the 80 nM NE-treated arrhythmia group, and i the 400 nM NE-treated arrhythmia group. jl Statistical comparisons of the shape features of the reconstructed plot among the control group, the 80 nM NE-treated arrhythmia group, and the 400 nM NE-treated arrhythmia group. The shape features include j length, k width, and l area of the reconstructed plot. n Two-dimensional phase space reconstructions of all types of cardiomyocyte beating recordings, including the control group (green), the two-peak arrhythmia group (red), the three-peak arrhythmia group (blue), the 80 nM NE-treated arrhythmia group (orange), and the 400 nM NE-treated arrhythmia group (purple), in one graph. The two-peak and three-peak arrhythmias were both induced by the 0.2 μM sertindole treatment. m The PCA clustering of the MNDA reconstructed plots of the control group, the two-peak arrhythmia group, the three-peak arrhythmia group, the 80 nM NE-treated arrhythmia group, and the 400 nM NE-treated arrhythmia group. Error bars are S.D. and significant differences were performed by t test, n = 10 recordings for each group, *p < 0.05, **p < 0.01, ***p < 0.001, n.s. not significant

Similar articles

References

    1. Tse G. Mechanisms of cardiac arrhythmias. J. Arrhythm. 2016;32:75–81. doi: 10.1016/j.joa.2015.11.003. - DOI - PMC - PubMed
    1. Huizar JF, Ellenbogen KA, Tan AY, Kaszala K. Arrhythmia-induced cardiomyopathy: JACC state-of-the-Art review. J. Am. Coll. Cardiol. 2019;73:2328–2344. doi: 10.1016/j.jacc.2019.02.045. - DOI - PMC - PubMed
    1. Ebrahimi Z, Loni M, Daneshtalab M, Gharehbaghi A. A review on deep learning methods for ECG arrhythmia classification. Expert. Syst. Appl.: X. 2020;7:100033.
    1. Wang HD, et al. Global, regional, and national life expectancy, all-cause mortality, and cause-specific mortality for 249 causes of death, 1980-2015: a systematic analysis for the Global Burden of Disease Study 2015. Lancet. 2016;388:1459–1544. doi: 10.1016/S0140-6736(16)31012-1. - DOI - PMC - PubMed
    1. Aune D, Schlesinger S, Norat T, Riboli E. Tobacco smoking and the risk of sudden cardiac death: a systematic review and meta-analysis of prospective studies. Eur. J. Epidemiol. 2018;33:509–521. doi: 10.1007/s10654-017-0351-y. - DOI - PMC - PubMed