

Practice Effects in Mild Cognitive Impairment Increase Reversion Rates and Delay Detection of New Impairments
- PMID: 35547623
- PMCID: PMC9083463
- DOI: 10.3389/fnagi.2022.847315
Practice Effects in Mild Cognitive Impairment Increase Reversion Rates and Delay Detection of New Impairments
Abstract
Objective: Cognitive practice effects (PEs) can delay detection of progression from cognitively unimpaired to mild cognitive impairment (MCI). They also reduce diagnostic accuracy as suggested by biomarker positivity data. Even among those who decline, PEs can mask steeper declines by inflating cognitive scores. Within MCI samples, PEs may increase reversion rates and thus impede detection of further impairment. Within an MCI sample at baseline, we evaluated how PEs impact prevalence, reversion rates, and dementia progression after 1 year.
Methods: We examined 329 baseline Alzheimer's Disease Neuroimaging Initiative MCI participants (mean age = 73.1; SD = 7.4). We identified test-naïve participants who were demographically matched to returnees at their 1-year follow-up. Since the only major difference between groups was that one completed testing once and the other twice, comparison of scores in each group yielded PEs. PEs were subtracted from each test to yield PE-adjusted scores. Biomarkers included cerebrospinal fluid phosphorylated tau and amyloid beta. Cox proportional models predicted time until first dementia diagnosis using PE-unadjusted and PE-adjusted diagnoses.
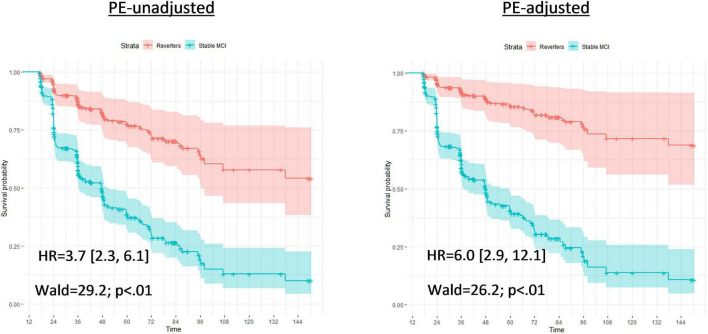
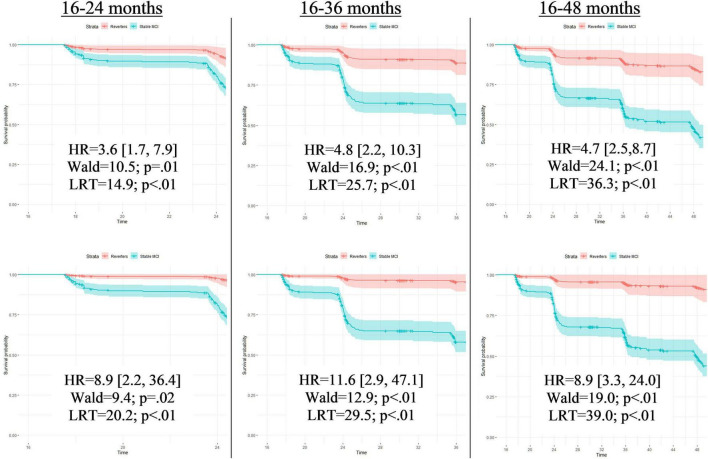
Results: Accounting for PEs increased MCI prevalence at follow-up by 9.2% (272 vs. 249 MCI), and reduced reversion to normal by 28.8% (57 vs. 80 reverters). PEs also increased stability of single-domain MCI by 12.0% (164 vs. 147). Compared to PE-unadjusted diagnoses, use of PE-adjusted follow-up diagnoses led to a twofold increase in hazard ratios for incident dementia. We classified individuals as false reverters if they reverted to cognitively unimpaired status based on PE-unadjusted scores, but remained classified as MCI cases after accounting for PEs. When amyloid and tau positivity were examined together, 72.2% of these false reverters were positive for at least one biomarker.
Interpretation: Even when PEs are small, they can meaningfully change whether some individuals with MCI retain the diagnosis at a 1-year follow-up. Accounting for PEs resulted in increased MCI prevalence and altered stability/reversion rates. This improved diagnostic accuracy also increased the dementia-predicting ability of MCI diagnoses.
Keywords: Alzheimer’s disease; biomarkers; cognitive aging; dementia progression; mild cognitive impairment; practice effects.
Copyright © 2022 Sanderson-Cimino, Elman, Tu, Gross, Panizzon, Gustavson, Bondi, Edmonds, Eppig, Franz, Jak, Lyons, Thomas, Williams and Kremen.
Conflict of interest statement
MB receives royalties from Oxford University Press. The remaining authors declare that the research was conducted in the absence of any commercial or financial relationships that could be construed as a potential conflict of interest.
Figures
Similar articles
-
Cognitive practice effects delay diagnosis of MCI: Implications for clinical trials.Alzheimers Dement (N Y). 2022 Feb 1;8(1):e12228. doi: 10.1002/trc2.12228. eCollection 2022. Alzheimers Dement (N Y). 2022. PMID: 35128027 Free PMC article.
-
Dissecting the clinical and pathological prognosis of MCI patients who reverted to normal cognition: a longitudinal study.BMC Med. 2025 May 6;23(1):260. doi: 10.1186/s12916-025-04092-0. BMC Med. 2025. PMID: 40325426 Free PMC article.
-
Cognitive Practice Effects Delay Diagnosis; Implications for Clinical Trials.medRxiv [Preprint]. 2020 Nov 5:2020.11.03.20224808. doi: 10.1101/2020.11.03.20224808. medRxiv. 2020. Update in: Alzheimers Dement (N Y). 2022 Feb 01;8(1):e12228. doi: 10.1002/trc2.12228. PMID: 33173908 Free PMC article. Updated. Preprint.
-
MCI-to-normal reversion using neuropsychological criteria in the Alzheimer's Disease Neuroimaging Initiative.Alzheimers Dement. 2019 Oct;15(10):1322-1332. doi: 10.1016/j.jalz.2019.06.4948. Epub 2019 Sep 5. Alzheimers Dement. 2019. PMID: 31495605 Free PMC article.
-
Does mild cognitive impairment always lead to dementia? A review.J Neurol Sci. 2016 Oct 15;369:57-62. doi: 10.1016/j.jns.2016.07.055. Epub 2016 Jul 26. J Neurol Sci. 2016. PMID: 27653867 Review.
Cited by
-
Brain reserve in midlife is associated with executive function changes across 12 years.Neurobiol Aging. 2024 Sep;141:113-120. doi: 10.1016/j.neurobiolaging.2024.05.001. Epub 2024 May 16. Neurobiol Aging. 2024. PMID: 38852544
-
Practice effects persist over two decades of cognitive testing: Implications for longitudinal research.medRxiv [Preprint]. 2025 Jul 31:2025.06.16.25329587. doi: 10.1101/2025.06.16.25329587. medRxiv. 2025. PMID: 40585136 Free PMC article. Preprint.
-
Practice Effect of Repeated Cognitive Tests Among Older Adults: Associations With Brain Amyloid Pathology and Other Influencing Factors.Front Aging Neurosci. 2022 Jul 6;14:909614. doi: 10.3389/fnagi.2022.909614. eCollection 2022. Front Aging Neurosci. 2022. PMID: 35875808 Free PMC article.
-
Short-Term Practice Effects on Cognitive Tests Across the Late Life Cognitive Spectrum and How They Compare to Biomarkers of Alzheimer's Disease.J Alzheimers Dis. 2024;99(1):321-332. doi: 10.3233/JAD-231392. J Alzheimers Dis. 2024. PMID: 38669544 Free PMC article.
-
Misinterpreting cognitive change over multiple timepoints: When practice effects meet age-related decline.Neuropsychology. 2023 Jul;37(5):568-581. doi: 10.1037/neu0000903. Epub 2023 Apr 20. Neuropsychology. 2023. PMID: 37079809 Free PMC article.
References
-
- Albert M. S., DeKosky S. T., Dickson D., Dubois B., Feldman H. H., Fox N. C., et al. (2011). The diagnosis of mild cognitive impairment due to Alzheimer’s disease: recommendations from the National Institute on Aging-Alzheimer’s Association workgroups on diagnostic guidelines for Alzheimer’s disease. Alzheimers Dement. 7 270–279. 10.1016/j.jalz.2011.03.008 - DOI - PMC - PubMed
-
- Bondi M. W., Edmonds E. C., Jak A. J., Clark L. R., Delano-Wood L., McDonald C. R., et al. (2014). Neuropsychological criteria for mild cognitive impairment improves diagnostic precision, biomarker associations, and progression rates. J. Alzheimers Dis. 42 275–289. 10.3233/JAD-140276 - DOI - PMC - PubMed