. 2022 May 2:2022:8158699.
doi: 10.1155/2022/8158699. eCollection 2022.

Flos Carthami Exerts Hepatoprotective Action in a Rat Model of Alcoholic Liver Injury via Modulating the Metabolomics Profile

Affiliations

Flos Carthami Exerts Hepatoprotective Action in a Rat Model of Alcoholic Liver Injury via Modulating the Metabolomics Profile

Xiaojing Fan et al. Evid Based Complement Alternat Med. .

Abstract

This study was intended to identify the shifts in the metabolomics profile of the hepatic tissue damaged by alcohol consumption and verify the potential restorative action of flos carthami (the flowers of Carthamus tinctorius, FC) in the protection of alcohol-induced injury by attenuating the level of identified metabolites. Rats were treated with FC and subsequently subjected to alcohol administration. The serum samples were subjected to liquid chromatography-mass spectrometry (LC-MS)-based metabolomics followed by statistical and bioinformatics analyses. The clustering of the samples showed an obvious separation in the principal component analysis (PCA) plot, and the scores plot of the orthogonal partial least squares-discriminant analysis (OPLS-DA) model allowed the distinction among the three groups. Among the 3211 total metabolites, 1088 features were significantly different between the control and alcohol-treated groups, while 367 metabolites were identified as differential metabolites between the alcohol- and FC-treated rat groups. Time series clustering approach indicated that 910 metabolites in profile 6 were upregulated by alcohol but subsequently reversed by FC treatment; among them, the top 10 metabolites based on the variable importance in projection (VIP) scores were 1-methyladenine, phenylglyoxylic acid, N-acetylvaline, mexiletine, L-fucose, propylthiouracil, dopamine 4-sulfate, isoleucylproline, (R)-salsolinol, and monomethyl phthalate. The Pearson correlation analysis and network construction revealed 96 hub metabolites that were upregulated in the alcohol liver injury model group but were downregulated by FC. This study confirmed the hepatoprotective effects of FC against alcohol-induced liver injury and the related changes in the metabolic profiles, which will contribute to the understanding and the treatment of alcohol-induced acute liver injury.


Conflict of interest statement

The authors declare that there are no conflicts of interest regarding the publication of this paper.

Figures

Figure 1
Figure 1
FC pretreatment alleviates acute ethanol-induced liver damage. (a) Effect of FC on the latency to drunkenness. (b) Effect of FC on the reduction in sleep. (c) Effect of FC on the serum level of ALT. (d) Effect of FC on the serum level of AST. (e) H&E staining for histopathologic examination of liver tissue. (f) Effect of FC on the serum level of TG. (g) Effect of FC on the liver tissue level of TG. ns = nonsignificant, p < 0.05, ∗∗p < 0.01, ∗∗∗p < 0.001, and ∗∗∗∗p < 0.0001 among the compared groups. Scale bar = 100 μm.
Figure 2
Figure 2
FC regulates oxidative stress induced by ethanol. (a) ROS production in the liver tissue of rats. (b) MDA level in the serum and liver tissue of rats. (c) ADH activity in the liver tissue of rats. (d) SOD activity in the liver tissue of rats. (e) GSH activity in the liver tissue of rats. ns = nonsignificant, p < 0.05, ∗∗∗p < 0.001, and ∗∗∗∗p < 0.0001 among the compared groups.
Figure 3
Figure 3
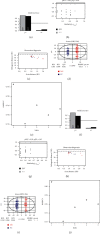
PCA and PLS-DA of samples based on serum metabolomics. (a) PCA of samples based on the serum metabolomics. (b) Overview of the PLS-DA model of samples based on the serum metabolomics. (c) Permutation test of the PLS-DA model of samples based on the serum metabolomics. (d) Observation diagnostics. (e) Score plot of the PLS-DA model based on the first and second components. (f) Cross-validation (CV) analysis of PLS-DA model.
Figure 4
Figure 4
OPLS-DA of samples based on serum metabolomics. (a) Overview of the OPLS-DA model of CG and MG samples based on the serum metabolomics. (b) Permutation test of the OPLS-DA model of CG and MG samples based on the serum metabolomics. (c) Observation diagnostics of the OPLS-DA model of CG and MG samples. (d) Score plot of the OPLS-DA model based on the first and second components. (e) Root mean square error of cross validation (RMSECV) of the OPLS-DA model of CG and FC samples. (f) Overview of the OPLS-DA model of FC and MG samples based on the serum metabolomics. (g) Permutation test of the OPLS-DA model of FC and MG samples based on the serum metabolomics. (h) Observation diagnostics of the OPLS-DA model of FC and MG samples. (i) Score plot of the OPLS-DA model of FC and MG samples based on the first and second components. (j) Root mean square error of cross validation (RMSECV) of the OPLS-DA model of MG and FC samples.
Figure 5
Figure 5
Differential expression analysis of the metabolites. (a) Volcano plot showing the profile of metabolites differentially expressed between the CG and MG. (b) Heatmap showing the profile of the top 20 metabolites differentially expressed between the CG and MG. (c) Volcano plot showing the profile of metabolites differentially expressed between the FC and MG. (d) Heatmap showing the profile of the top 20 metabolites differentially expressed between the FC and MG.
Figure 6
Figure 6
Time series clustering for the identification of FC-responsive metabolites in alcoholic liver injury. (a) Profiles ordered by p values. (b) Profiles ordered by number of metabolites assigned. (c) Bubble chart indicating the top 20 metabolites in profile 6 containing FC-responsive metabolites based on their VIP scores as obtained from the PLS-DA.
Figure 7
Figure 7
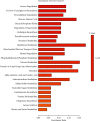
Enrichment analysis of metabolites in profile 6 containing FC-responsive metabolites.
Figure 8
Figure 8
Identification of the hub metabolites and metabolites network in profile 6 containing FC-responsive metabolites. (a) Hub metabolite network containing metabolites with node degree equal or higher than 100. (b) Enrichment of hub metabolites.

Similar articles

Cited by

References

    1. Bernal W., Auzinger G., Dhawan A., Wendon J. Acute liver failure. The Lancet . 2010;376(9736):190–201. doi: 10.1016/s0140-6736(10)60274-7. - DOI - PubMed
    1. Dong V., Nanchal R., Karvellas C. J. Pathophysiology of acute liver failure. Nutrition in Clinical Practice . 2020;35(1):24–29. doi: 10.1002/ncp.10459. - DOI - PubMed
    1. Grek A., Arasi L. Acute liver failure. AACN Advanced Critical Care . 2016;27(4):420–429. doi: 10.4037/aacnacc2016324. - DOI - PubMed
    1. Gao B., Bataller R. Alcoholic liver disease: pathogenesis and new therapeutic targets. Gastroenterology . 2011;141(5):1572–1585. doi: 10.1053/j.gastro.2011.09.002. - DOI - PMC - PubMed
    1. Marroni C. A., Fleck A. D. M., Jr., Fernandes S. A., et al. Liver transplantation and alcoholic liver disease: history, controversies, and considerations. World Journal of Gastroenterology . 2018;24(26):2785–2805. doi: 10.3748/wjg.v24.i26.2785. - DOI - PMC - PubMed

LinkOut - more resources