. 2022 Apr 25:13:887759.
doi: 10.3389/fimmu.2022.887759. eCollection 2022.

Physicochemical Heuristics for Identifying High Fidelity, Near-Native Structural Models of Peptide/MHC Complexes

Affiliations

Physicochemical Heuristics for Identifying High Fidelity, Near-Native Structural Models of Peptide/MHC Complexes

Grant L J Keller et al. Front Immunol. .

Abstract

There is long-standing interest in accurately modeling the structural features of peptides bound and presented by class I MHC proteins. This interest has grown with the advent of rapid genome sequencing and the prospect of personalized, peptide-based cancer vaccines, as well as the development of molecular and cellular therapeutics based on T cell receptor recognition of peptide-MHC. However, while the speed and accessibility of peptide-MHC modeling has improved substantially over the years, improvements in accuracy have been modest. Accuracy is crucial in peptide-MHC modeling, as T cell receptors are highly sensitive to peptide conformation and capturing fine details is therefore necessary for useful models. Studying nonameric peptides presented by the common class I MHC protein HLA-A*02:01, here we addressed a key question common to modern modeling efforts: from a set of models (or decoys) generated through conformational sampling, which is best? We found that the common strategy of decoy selection by lowest energy can lead to substantial errors in predicted structures. We therefore adopted a data-driven approach and trained functions capable of predicting near native decoys with exceptionally high accuracy. Although our implementation is limited to nonamer/HLA-A*02:01 complexes, our results serve as an important proof of concept from which improvements can be made and, given the significance of HLA-A*02:01 and its preference for nonameric peptides, should have immediate utility in select immunotherapeutic and other efforts for which structural information would be advantageous.

Keywords: major histocompatibility complex; neoantigen; peptide; prediction; structure; support vector machine.


Conflict of interest statement

The authors declare that the research was conducted in the absence of any commercial or financial relationships that could be construed as a potential conflict of interest.

Figures

Figure 1
Figure 1
Performance of structural modeling protocols. (A) Distribution of peptide heavy atom (HA) and α carbon (Cα) RMSDs of the most accurate (lowest HA RMSD from crystal structure) decoys generated for 103 target peptide-MHC complexes when modeled by the four different protocols indicated. RMSDs were calculated for peptides only after superimposition of the HLA-A*02:01 peptide binding grooves (Cα atoms of heavy chain residues 1-180). Mean is indicated by a red star, boxes represent the first to third interquartile range, and horizontal lines show the median. The medians of 10 and 200 decoys are connected by red lines. Implementing ref2015 and KIC alone had little effect on accuracy, although decreased the variance in RMSD. Moving from 10 to 200 decoys resulted in significant improvement when using ref2015. (B) Distribution of peptide HA RMSDs of the most accurate of the 200 decoys from panel A (black outline) and the decoys with the lowest Rosetta energy (green outline). Mean is indicated by a red star; medians are connected by red lines. Colors for the modeling protocols are the same as in panel (A). (C) Distribution of peptide HA RMSD from crystal structure (y axis) for 200 decoys of each target peptide-MHC (x axis), illustrating coverage of conformational space. The mean per-target variance, or degree of conformational sampling, of the ref2015 KIC protocol (0.27) was slightly higher than ref2015 CCD (0.22), and much higher than either talaris2014 CCD (0.017) or talaris2014 repack (0.0044). Points are colored across the spectrum for clarity.
Figure 2
Figure 2
Structurally divergent decoys can have similarly low energies. (A) Rosetta energy vs. peptide HA RMSD from crystal structure for 200 decoys generated using ref2015 KIC for two peptide-MHC complexes (PDB IDs 4NNY and 6O4Z, colored as indicated). Decoys exhibit a wide range of RMSD values despite similarly low energies. Decoys shown in panels (B, C) are indicated with magenta/green circles and highlighted by the black arrows.(B) Visual comparison of two decoys for 4NNY. The crystal structure is colored cyan. The best decoy (lowest RMSD from structure) is magenta (-1253 REU, 1.63 Å HA RMSD, 0.63 Å Cα RMSD). A lower energy but poorer decoy is green (-1257 REU, 2.93 Å HA RMSD, 1.76 Å Cα RMSD). (C) Comparison for 6O4Z. The crystal structure is cyan, the best decoy (lowest RMSD from structure) is magenta (-1242 REU, 1.33 Å HA RMSD, 0.55 Å Cα RMSD), and a lower energy but poorer decoy is green (-1250 REU, 2.69 Å HA RMSD, 1.71 Å Cα RMSD).
Figure 3
Figure 3
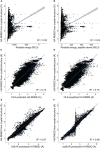
Trained functions better rank decoys in order of peptide RMSD from crystallographic structures. The peptide HA RMSDs for all 500 decoys for each of the crystallographic structures in Table S1 (excluding the six test structures) were plotted against Rosetta energy of the peptide-MHC (A), peptide alone (B), or predicted HA RMSD from each of the trained functions (C–F). There was no correlation between RMSD and Rosetta energy. In sharp contrast, predicted RMSD from trained functions correlate well with RMSD from structure (C–F), with excellent correlations seen with the SVR functions (E, F). A sharp split in the trend of the radSVR predictions around 2.5 Å likely reflects overfitting as discussed in the text (see also Figure S3 ). R2 values are indicated in each plot; 95% confidence intervals are shown, but only apparent in panels (A, B).
Figure 4
Figure 4
SVR functions outperform least squares functions and energy scores in identifying the best decoy. For each of the structures in Table S1 (excluding the six test structures), the trained functions were used to select the most optimal decoy from the 500 produced. The best decoy (lowest peptide HA RMSD from structure) was also identified, as were the lowest scoring by total or peptide-only Rosetta energy. These decoys were then used to calculate Cα (left) and HA RMSD (right) from experimental structure, indicated by each violin. Distributions are sorted from left-to-right by ascending mean. The SVR functions clearly outperform other methods of decoy selection (RE peptide, Rosetta energy for the peptide alone). Mirroring the data in Figure 3 , the two SVR functions were statistically indistinguishable from one another, as well as from the best decoy. Boxes span the first and third quartiles, lines indicate the median.
Figure 5
Figure 5
SVR selection functions show improved performance in a non-biased test set. 500 models for six structures not included in training were generated with the ref2015 KIC protocol. All decoys were ranked by peptide HA RMSD from the crystal structure (“true rank”) and compared to the ranking by Rosetta energy (A) the linSVR function (B) and the radSVR function (C). The legends in (A–C) indicate the peptide-MHC PDB ID and the associated Spearman correlation between HA RMSD and Rosetta score or function prediction, as well as the overall correlation. The linSVR function is the strongest performer, ranking four out of six of the structures with high accuracy. A fifth (5EU3) was poorly ranked due to limited sampling around a highly accurate model as discussed in the text. (D) Example of performance with 6PTB, comparing the peptide crystallographic coordinates with the decoy with the lowest Rosetta energy (top) and the optimal decoy selected by linSVR (bottom). Cα/HA RMSD values are indicated for each case.
Figure 6
Figure 6
The linSVR function selects a more accurate model for a novel neoantigen structure. (A) Structure of the AVGSYVYSV neoantigen bound to HLA-A*02:01, with 2Fo-Fc electron density at 1σ shown. (B) Comparison of lowest energy decoy and the linSVR selected decoy for AVGSYVYSV after modeling (peptide backbone shown only). The lowest energy decoy has the backbone incorrectly modeled from Ser4 through Val6, leading to a 3.1 Å displacement in the carbonyl oxygen at Tyr5 as shown in the inset. (C) Structure and decoy comparison, showing the entire peptides. The error in the position of the Tyr5 side chain is exacerbated in the low energy decoy. Colors are the same as in panel B.
Figure 7
Figure 7
Stratification of peptide RMSD from crystal structure by peptide position and amino acid reveals peptide central bulges are the most difficult to model, without clear trends in amino acid type. (A, B) Average RMSDs from crystal structures by peptide position for backbone atoms (A) and side chain atoms (B). Data for the best decoys, optimal decoys selected by linSVR, and decoys selected by lowest Rosetta energy are indicated. The central regions of peptides are the most difficult to model correctly. Once again, decoys selected by linSVR are more accurate than those selected by Rosetta energy. (C) As in panels (A, B), but heavy atoms by amino acid type. There are no clear trends for modeling accuracy, but selection by Rosetta energy score performs particularly poorly with the large and chemically complex side chains of phenylalanine, histidine, methionine, arginine, tryptophan, and tyrosine.

Similar articles

Cited by

References

    1. Rajasagi M, Shukla SA, Fritsch EF, Keskin DB, DeLuca D, Carmona E, et al. . Systematic Identification of Personal Tumor-Specific Neoantigens in Chronic Lymphocytic Leukemia. Blood (2014) 124(3):453–62. doi: 10.1182/blood-2014-04-567933 - DOI - PMC - PubMed
    1. Gubin MM, Artyomov MN, Mardis ER, Schreiber RD. Tumor Neoantigens: Building a Framework for Personalized Cancer Immunotherapy. J Clin Invest (2015) 125(9):3413–21. doi: 10.1172/JCI80008 - DOI - PMC - PubMed
    1. Sahin U, Derhovanessian E, Miller M, Kloke B-P, Simon P, Löwer M, et al. . Personalized RNA Mutanome Vaccines Mobilize Poly-Specific Therapeutic Immunity Against Cancer. Nat (2017) 547:222. doi: 10.1038/nature23003 - DOI - PubMed
    1. Ott PA, Hu Z, Keskin DB, Shukla SA, Sun J, Bozym DJ, et al. . An Immunogenic Personal Neoantigen Vaccine for Patients With Melanoma. Nat (2017) 547:217. doi: 10.1038/nature22991 - DOI - PMC - PubMed
    1. Zhu Y, Liu J. The Role of Neoantigens in Cancer Immunotherapy. Front Oncol (2021) 11:682325. doi: 10.3389/fonc.2021.682325 - DOI - PMC - PubMed

Publication types