. 2022 Apr 25:13:820718.
doi: 10.3389/fimmu.2022.820718. eCollection 2022.

Tanreqing Injection Attenuates Macrophage Activation and the Inflammatory Response via the lncRNA-SNHG1/HMGB1 Axis in Lipopolysaccharide-Induced Acute Lung Injury

Affiliations

Tanreqing Injection Attenuates Macrophage Activation and the Inflammatory Response via the lncRNA-SNHG1/HMGB1 Axis in Lipopolysaccharide-Induced Acute Lung Injury

Chunling Hu et al. Front Immunol. .

Abstract

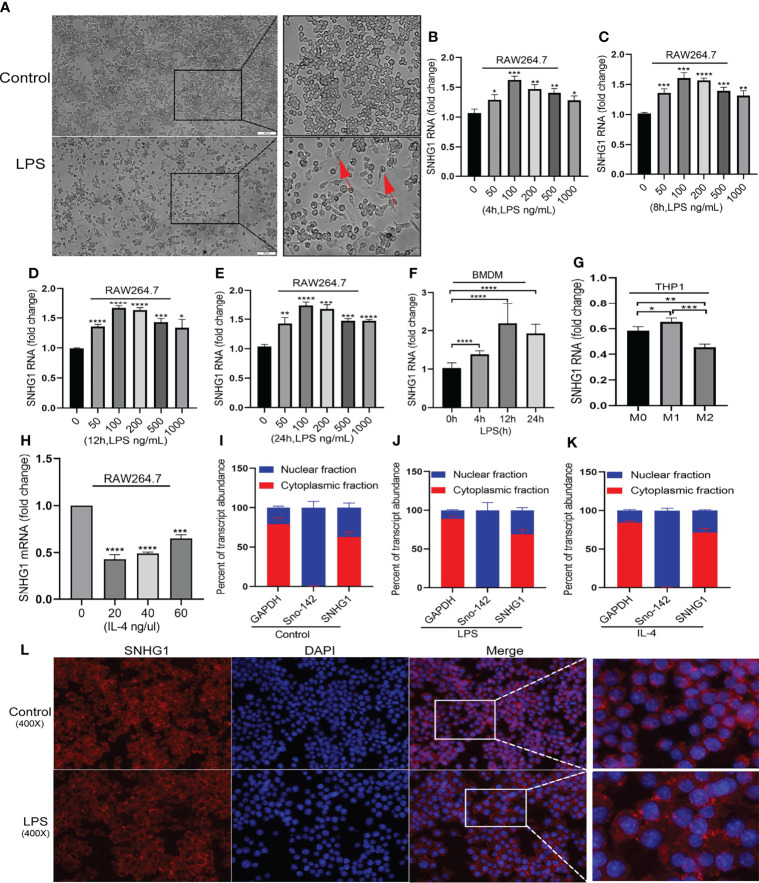
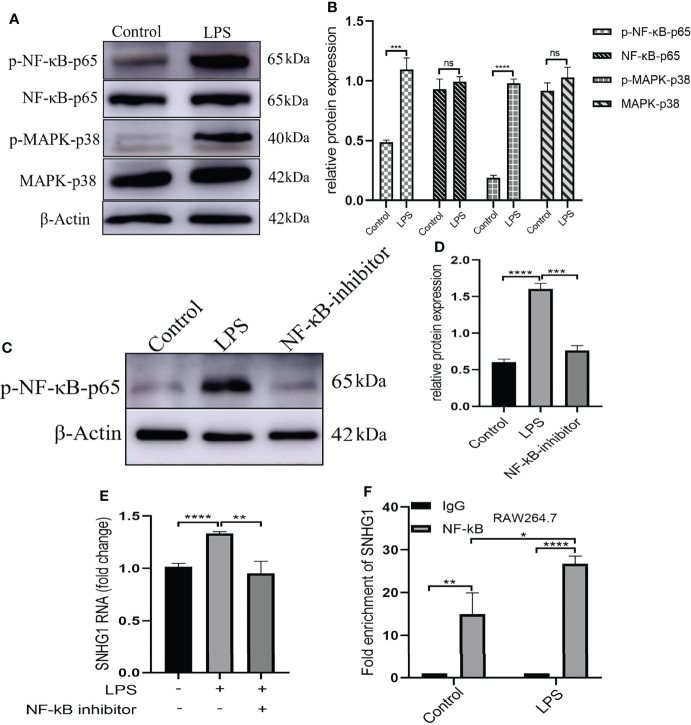
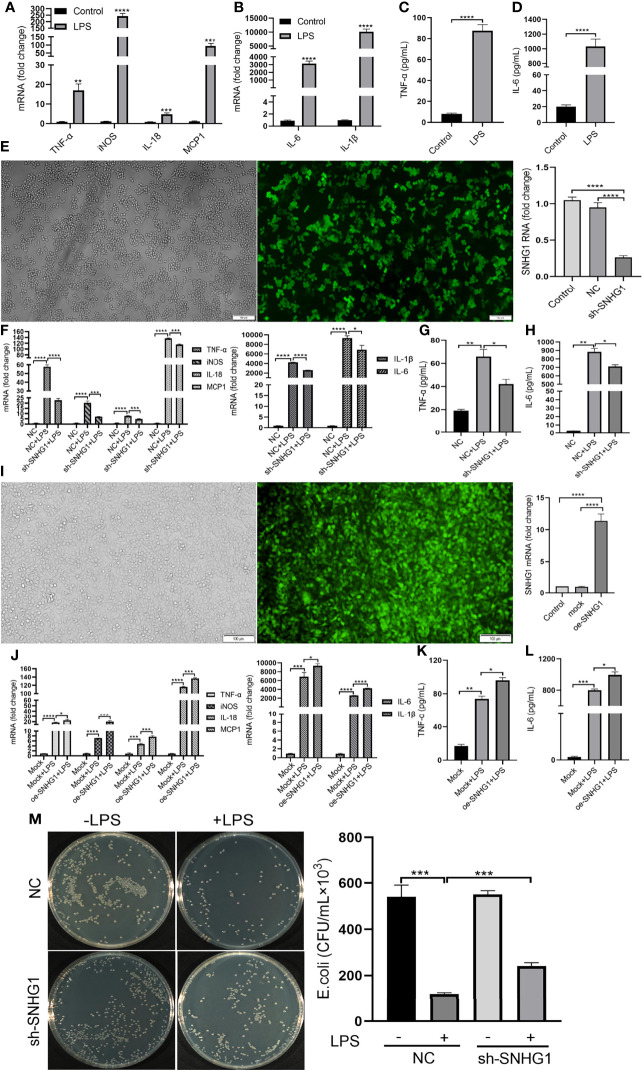
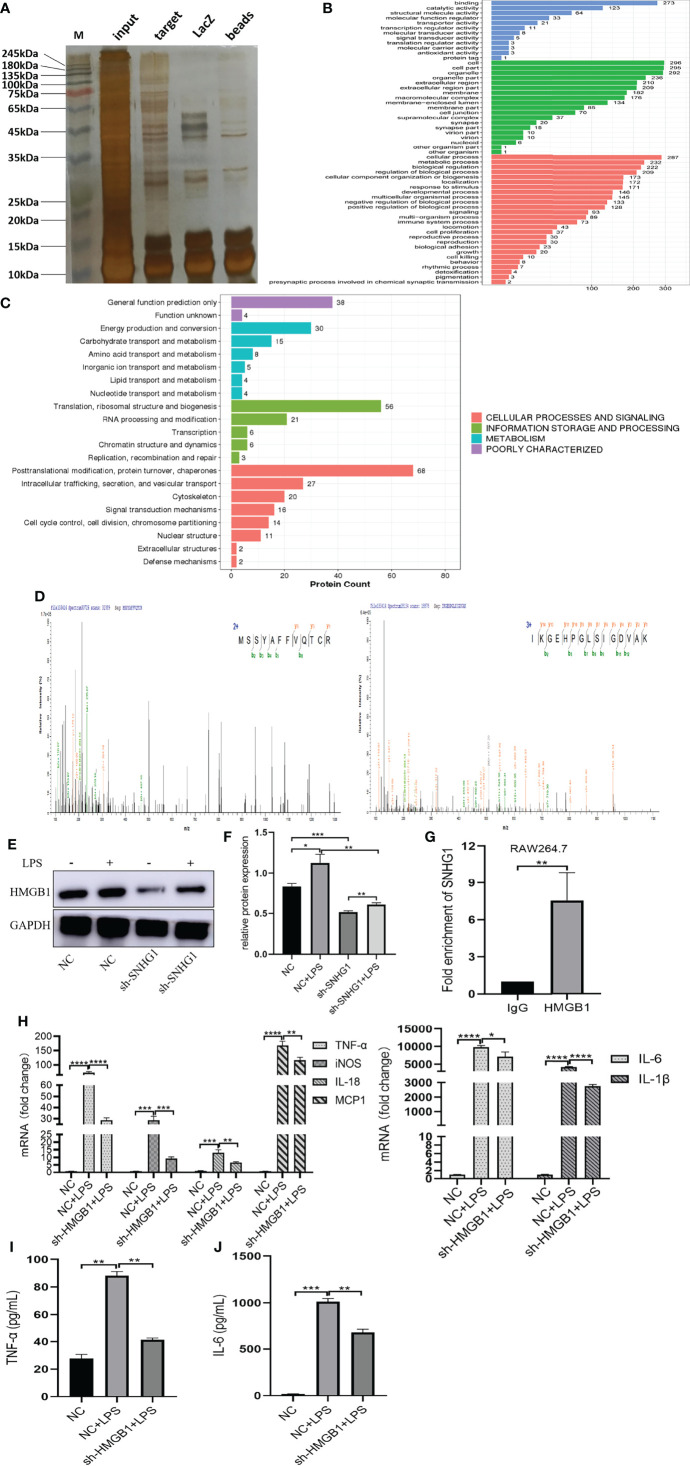
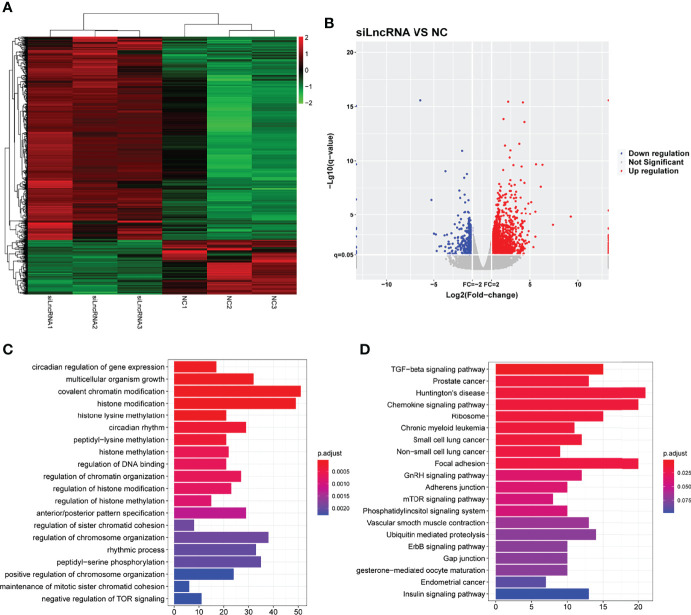
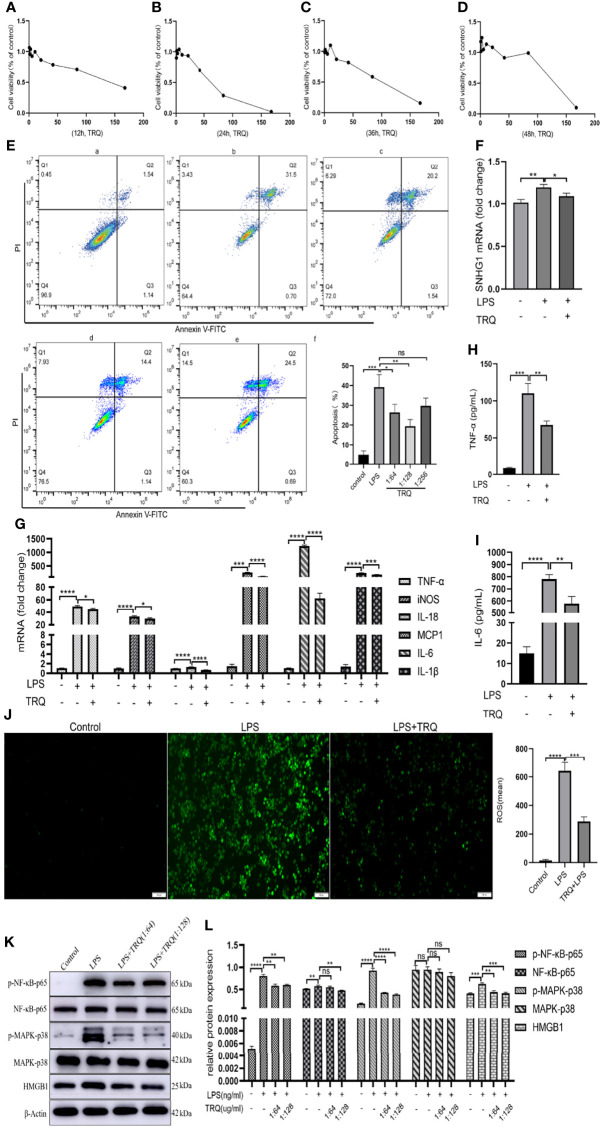
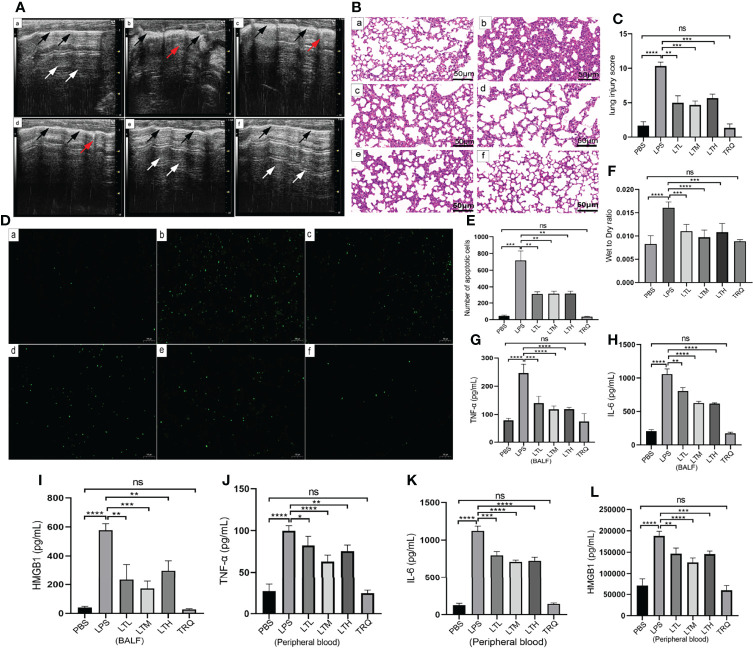
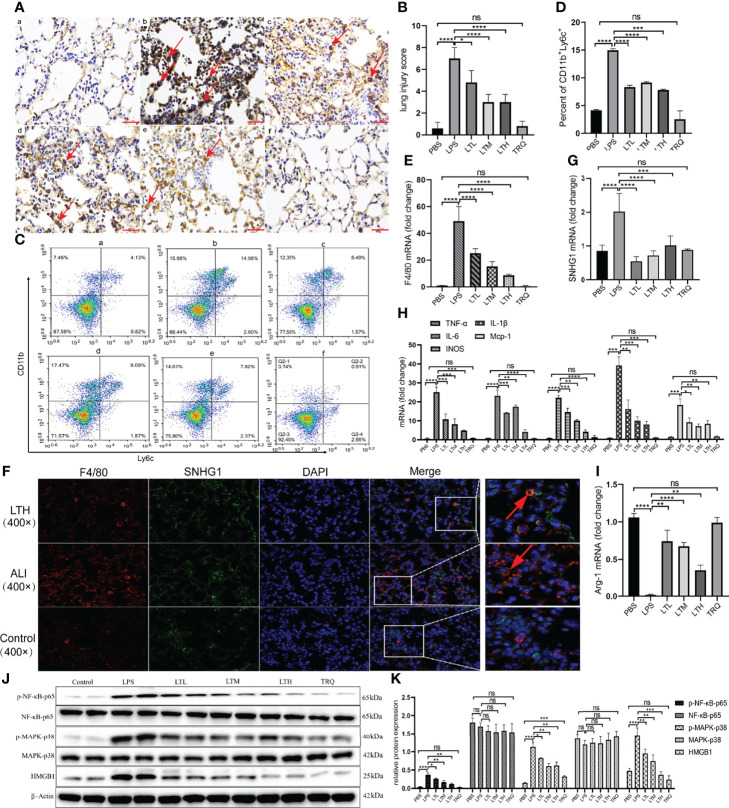
The etiology of acute lung injury (ALI) is not clear, and the treatment of ALI presents a great challenge. This study aimed to investigate the pathogenesis and potential therapeutic targets of ALI and to define the target gene of Tanreqing (TRQ), which is a traditional Chinese medicine formula composed of five medicines, scutellaria baicalensis, bear bile powder, goat horn powder, honeysuckle and forsythia. Macrophage activation plays a critical role in many pathophysiological processes, such as inflammation. Although the regulation of macrophage activation has been extensively investigated, there is little knowledge of the role of long noncoding RNAs (lncRNAs) in this process. In this study, we found that lncRNA-SNHG1 expression is distinctly regulated in differently activated macrophages in that it is upregulated in LPS. LncRNA-SNHG1 knockdown attenuates LPS-induced M1 macrophage activation. The SNHG1 promoter was bound by NF-κB subunit p65, indicative of SNHG1 being a direct transcriptional target of LPS-induced NF-κB activation. SNHG1 acts as a proinflammatory driver that leads to the production of inflammatory cytokines and the activation of macrophages and cytokine storms by physically interacting with high-mobility group box 1 (HMGB1) in ALI. TRQ inhibited NF-κB signaling activation and binding of NF-κB to the SNHG1 promoter. In conclusion, this study defined TRQ target genes, which can be further elucidated as mechanism(s) of TRQ action, and provides insight into the molecular pathogenesis of ALI. The lncRNA-SNHG1/HMGB1 axis is an ideal therapeutic for ALI treatment.

Keywords: NF-κB signaling pathway; acute lung injury/acute respiratory distress syndrome (ALI/ARDS); high mobility group protein 1 (HMGB1); long noncoding RNA (lncRNA); macrophage polarization; tanreqing injection.


Conflict of interest statement

The authors declare that the research was conducted in the absence of any commercial or financial relationships that could be construed as a potential conflict of interest.

Figures

Figure 1
Figure 1
Distinctly expressed lncRNA-SNHG1 in differentially activated macrophages. (A) The morphology of RAW264.7 cells was significantly changed after LPS stimulation (magnification, ×100, scale bar, 100 μm). (B–E) The expression of SNHG1 in RAW264.7 cells treated with an LPS concentration gradient for 4 h, 8 h, 12 h, and 24 h. (F) Mouse BMDMs were treated with 100 ng/ml LPS for the indicated duration of time. Total RNA was isolated, and the levels of SNHG1 were determined by qRT-PCR. (G) Human THP-1-derived macrophages were treated with PMA, human IFN-r and IL-4 for the indicated times. Levels of SNHG1 were determined. (H) RAW264.7 cells were treated with a concentration gradient of mouse IL-4 for 24 h. Levels of SNHG1 were determined. (I–K) qRT-PCR was used to measure the level of SNHG1 in the nucleus and cytoplasm of RAW264.7 cells treated with PBS, LPS and IL-4. (L) FISH was performed to observe the cellular location of expression of SNHG1 (red) in RAW264.7 cells and in LPS induced-RAW264.7 cells (magnification, ×400, scale bar, 20μm and magnification, ×1000, scale bar, 10μm). The data between two groups were compared using unpaired t-tests. Data are indicated as the mean ± SD, *P<0.05, **P<0.01, ***P<0.001, ****P<0.0001.
Figure 2
Figure 2
Upstream mediators of SNHG1 expression in macrophages. (A) Relative protein levels of p-NF-κB-p65, NF-κB-p65, p-MAPK-p38 and MAPK-p38 were detected in RAW264.7 cells treated with LPS by Western blot analysis. (B) The gray value of protein expression in the control and LPS groups. (C) Expression of p-NF-κB-p65 in RAW264.7 cells treated with an NF-κB inhibitor (BAY 11-7082) detected by Western blot analysis. (D) The gray value of protein expression in the control, LPS and NF-κB inhibitor groups. (E) The expression of SNHG1 in the PBS, LPS and LPS +NF-κB inhibitor groups. (F) Levels of p65 binding to the SNHG1promoter were determined by CHIP assay and the production of enrichment was determined by qRT-PCR. Data are indicated as the mean ± SD, ns P≥0.05, *P<0.05, **P<0.01, ***P<0.001, ****P<0.0001.
Figure 3
Figure 3
SNHG1 regulates macrophage polarization. (A, B) Expression of proinflammatory cytokines (TNF-α, iNOS, IL-18, MCP-1, IL-6 and IL-1β) in RAW264.7 cells treated with LPS, as determined by qRT-PCR. (C, D) Expression of proinflammatory cytokines (TNF-α, IL-6) in RAW264.7 cells treated with LPS, as determined by ELISA. (E) The efficiency of SNHG1 in RAW264.7 cells transfected with lentivirus sh-SNHG1 was determined by qRT-PCR. (F) Expression of proinflammatory cytokines (TNF-α, iNOS, IL-18, MCP-1, IL-6 and IL-1β) in RAW264.7 cells transfected with lentivirus sh-SNHG1 treated with LPS, as determined by qRT-PCR. (G, H) Expression of proinflammatory cytokines (TNF-α, IL-6) in RAW264.7 cells transfected with lentivirus sh-SNHG1 treated with LPS, as determined by ELISA. (I) The efficiency of SNHG1 in RAW264.7 cells transfected with lentivirus oe-SNHG1 was determined by qRT-PCR. (J) Expression of proinflammatory cytokines (TNF-α, iNOS, IL-18, MCP-1, IL-6 and IL-1β) in RAW264.7 cells transfected with lentivirus oe-SNHG1 treated with LPS, as determined by qRT-PCR. (K, L) Expression of proinflammatory cytokines (TNF-α, IL-6) in RAW264.7 cells transfected with lentivirus oe-SNHG1 treated with LPS, as determined by ELISA. (M) Bacterial killing assay was performed in RAW264.7 cells transfected with lentivirus sh-SNHG1 treated with LPS or not. Data are indicated as the mean ± SD, *P<0.05, **P<0.01, ***P<0.001, ****P<0.0001.
Figure 4
Figure 4
SNHG1 interacts with HMGB1 in RAW264.7 cells. (A) The results of the silver staining assay showed the SNHG1 binding protein. (B) GO function analysis of differentially expressed proteins that bind SNHG1. (C) KEGG pathway analysis of differentially expressed proteins that bind SNHG1. (D) Two HMGB1 peptides were detected in the mass spectrometry results. (E, F) The expression of HMGB1 in RAW264.7 cells treated with LPS, as determined by Western blot. (G) Anti-HMGB1 RIP assay was executed in RAW264.7 cells, followed by qRT-PCR. (H) Expression of proinflammatory cytokines (TNF-α, iNOS, IL-18, MCP-1, IL-6 and IL-1β) in RAW264.7 cells transfected with lentivirus sh-HMGB1 treated with LPS, as determined by qRT-PCR. (I, J) Expression of proinflammatory cytokines (TNF-α, IL-6) in RAW264.7 cells transfected with lentivirus sh-HMGB1 treated with LPS, as determined by ELISA. Data are indicated as the mean ± SD, *P<0.05, **P<0.01, ***P<0.001, ****P<0.0001.
Figure 5
Figure 5
The functional of SNHG1 in downstream mediator. (A) The expression of downstream mRNAs in RAW264.7 cells transfected with lentivirus sh-SNHG1 in a heatmap. (B) The expression of upregulated and downregulated mRNAs in a volcano plot. (C) GO function analysis of differentially expressed mRNAs. (D) KEGG pathway analysis of differentially expressed mRNAs.
Figure 6
Figure 6
Screening and biological function analysis of DEGs in ALI mice in the GEO database. (A) The expression of upregulated and downregulated genes in ALI mice in a volcano plot. (B) The expression of SNHG1 was upregulated among the upregulated genes. (C) Comparison with the control group. SNHG1 expression in the ALI mouse model. (D) GO function analysis of upregulated genes in the ALI mouse model. (E) KEGG pathway analysis of upregulated genes in the ALI mouse model. Data are indicated as the mean ± SD, ****P<0.0001.
Figure 7
Figure 7
Tanreqing injection (TRQ) inhibits inflammatory responses in LPS-activated macrophages. (A–D) The toxicity of TRQ at different concentrations in RAW264.7 cells, as determined by CCK-8 assay. (E) Apoptosis assays of RAW264.7 cells treated with TRQ at concentrations of 1:64, 1:128 and 1:256. (F) The expression of SNHG1 in LPS-activated macrophages after TRQ treatment, as determined by qRT-PCR. (G) Expression of proinflammatory cytokines (TNF-α, iNOS, IL-18, MCP-1, IL-6 and IL-1β) in LPS-activated RAW264.7 cells after TRQ treatment, as determined by qRT-PCR. (H, I) Expression of proinflammatory cytokines (TNF-α, IL-6) in LPS-activated RAW264.7 cells after TRQ treatment, as determined by ELISA. (J) Production of ROS in RAW264.7 cells after LPS and TRQ treatment (magnification, ×100, scale bar, 100 μm). (K, L) Relative protein levels of p-NF-κB-p65, NF-κB-p65, p-MAPK-p38, MAPK-p38 and HMGB1 were detected in LPS-induced RAW264.7 cells treated with TRQ. Data are indicated as the mean ± SD, ns P≥0.05, *P<0.05, **P<0.01, ***P<0.001, ****P<0.0001.
Figure 8
Figure 8
TRQ mitigates LPS-induced ALI. (A) Ultrasound imaging was performed to assess lung injury in the control (a), LPS (b), LTL (c), LTM(d), LTH (e) and TRQ (f) groups. (B) HE staining was performed to assess lung injury in the control (a), LPS (b), LTL (c), LTM (d), LTH (e) and TRQ (f) groups (magnification, ×200, scale bar, 50 μm). (C) The lung injury score of HE staining. (D) The TUNEL apoptosis assay of lung tissue in the control (a), LPS (b), LTL (c), LTM (d), LTH (e) and TRQ (f) groups (magnification, ×100, scale bar, 100 μm). (E) The apoptosis cells number of lung tissue. (F) The wet/dry weight ratio of right upper lung tissue in the control, LPS, LTL, LTM, LTH and TRQ groups. (G–I) Expression of proinflammatory cytokines (TNF-α, IL-6 and HMGB1) in the BALF, as determined by ELISA. (J–L) Expression of proinflammatory cytokines (TNF-α, IL-6 and HMGB1) in the peripheral blood supernatant, as determined by ELISA. Data are indicated as the mean ± SD, ns, P ≥0.05, *P<0.05, **P<0.01, ***P<0.001, ****P<0.0001.
Figure 9
Figure 9
TRQ regulates the activation of M1 macrophages and the expression of SNHG1. (A, B) IHC of F4/80 was performed to show the expression of macrophages in the control (a), LPS (b), LTL (c), LTM (d), LTH (e) and TRQ (f) groups (magnification, ×100, scale bar, 100 μm). (C, D) The percentage of F4/80+Ly6c+ M1 macrophages in the control (a), LPS (b), LTL (c), LTM (d), LTH (e) and TRQ (f) groups, as determined by flow cytometry. (E) The expression of F4/80 in the control, LPS, LTL, LTM, LTH and TRQ groups, as determined by qRT-PCR. (F) The expression of SNHG1 (green) was expressed on F4/80 (red) macrophages in control, ALI, LTH group, as determined by FISH assay. (G) The expression of SNHG1 in the control, LPS, LTL, LTM, LTH and TRQ groups, as determined by qRT-PCR. (H) The expression of proinflammatory cytokines (TNF-α, iNOS, IL-18, MCP-1, IL-6 and IL-1β) in the control, LPS, LTL, LTM, LTH and TRQ groups, as determined by qRT-PCR. (I) Anti-inflammatory cytokines (Arg-1) in the control, LPS, LTL, LTM, LTH and TRQ groups, as determined by qRT-PCR. (J, K) The expression of NF-κB-p65, p-NF-κB-p65, MARK-P38, p-MARK-P38 and HMGB1 in the in the control, LPS, LTL, LTM, LTH and TRQ groups, as determined by Western Blot. Data are indicated as the mean ± SD, ns, P ≥0.05, *P<0.05, **P<0.01, ***P<0.001, ****P<0.0001.

Similar articles

Cited by

References

    1. Huppert LA, Matthay MA, Ware LB. Pathogenesis of Acute Respiratory Distress Syndrome. Semin Respir Crit Care Med (2019) 40(1):31–9. doi: 10.1055/s-0039-1683996 - DOI - PMC - PubMed
    1. Kang M, Kempker JA. Definitions, Epidemiology, Clinical Risk Factors, and Health Disparities in Acute Respiratory Distress Syndrome. Semin Respir Crit Care Med (2019) 40(1):3–11. doi: 10.1055/s-0039-1683884 - DOI - PubMed
    1. Combes A, Hajage D, Capellier G, Demoule A, Lavoué S, Guervilly C, et al. . Extracorporeal Membrane Oxygenation for Severe Acute Respiratory Distress Syndrome. N Engl J Med (2018) 378(21):1965–75. doi: 10.1056/NEJMoa1800385 - DOI - PubMed
    1. Gong G, Wang H, Kong X, Duan R, Dong TTX, Tsim KWK. Flavonoids Are Identified From The Extract Of Scutellariae Radix To Suppress Inflammatory-induced Angiogenic Responses In Cultured RAW 264.7 Macrophages. Sci Rep (2018) 8(1):17412. doi: 10.1038/s41598-018-35817-2 - DOI - PMC - PubMed
    1. Lin S, Shi Q, Ge Z, Liu Y, Cao Y, Yang Y, et al. . Efficacy and Safety of Traditional Chinese Medicine Injections for Heart Failure With Reduced Ejection Fraction: A Bayesian Network Meta-Analysis of Randomized Controlled Trials. Front Pharmacol (2021) 12:659707. doi: 10.3389/fphar.2021.659707 - DOI - PMC - PubMed