. 2022 Apr 25:13:810671.
doi: 10.3389/fimmu.2022.810671. eCollection 2022.

CCN1 Promotes Inflammation by Inducing IL-6 Production via α6β1/PI3K/Akt/NF-κB Pathway in Autoimmune Hepatitis

Affiliations

CCN1 Promotes Inflammation by Inducing IL-6 Production via α6β1/PI3K/Akt/NF-κB Pathway in Autoimmune Hepatitis

Renquan Jiang et al. Front Immunol. .

Abstract

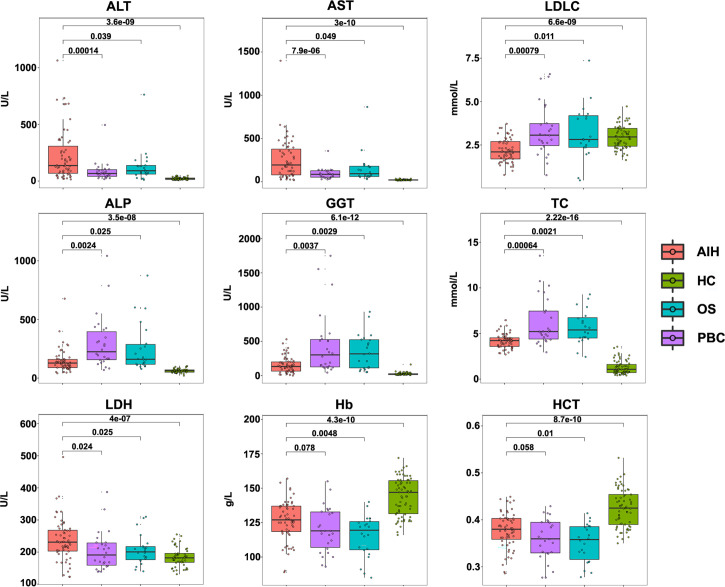
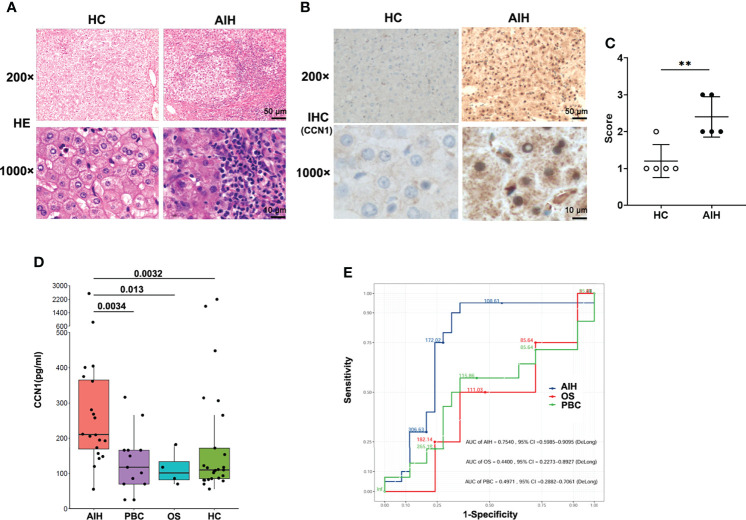
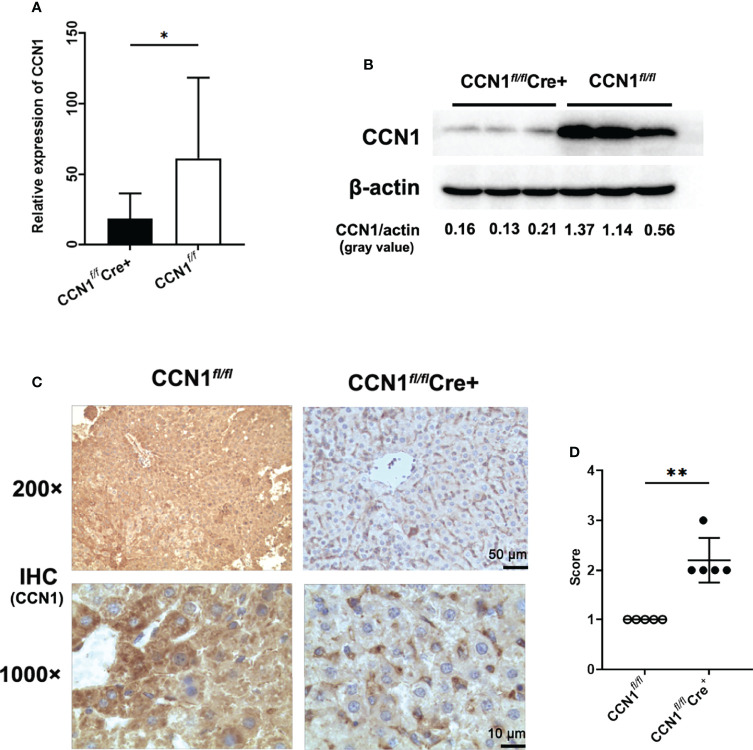
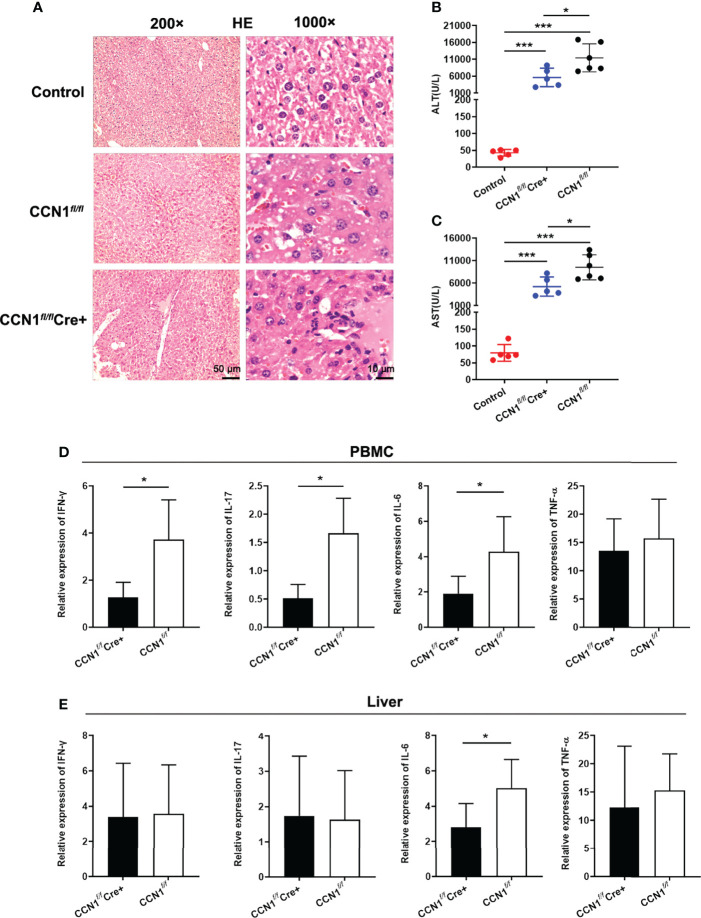
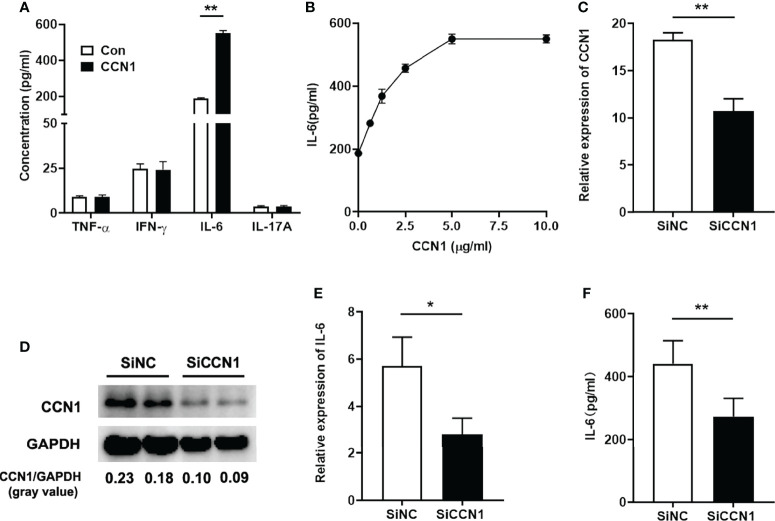
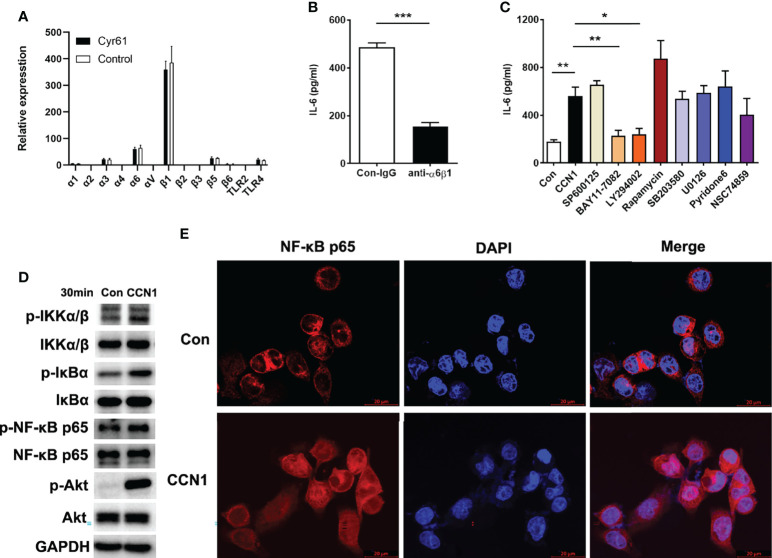
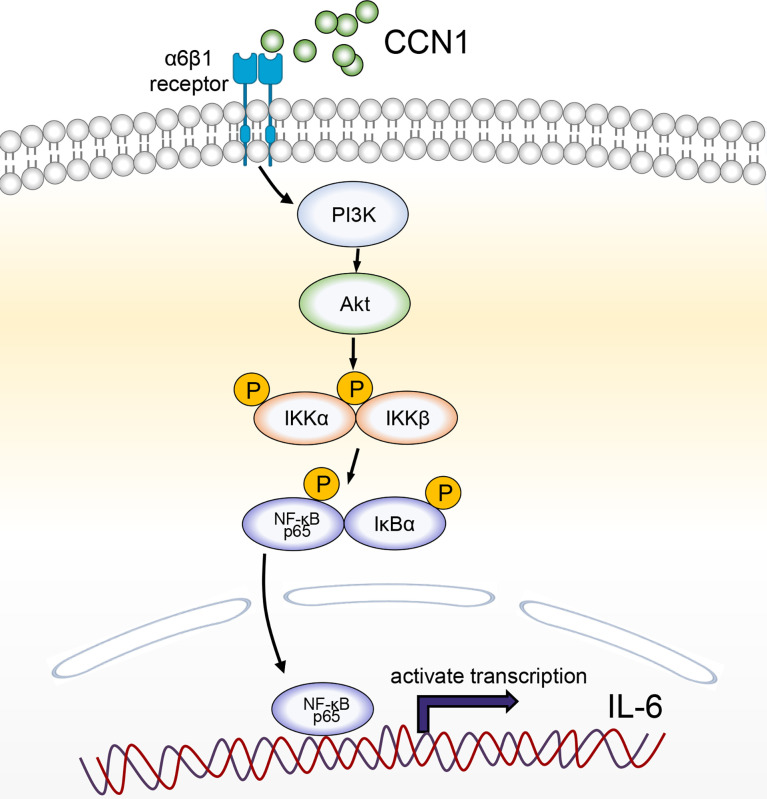
Autoimmune hepatitis (AIH) is a chronic inflammatory liver disease with unknown etiology. CCN1, an extracellular matrix-associated protein, is associated with carcinoma, inflammation, liver fibrosis, and even autoimmune diseases. However, the role that CCN1 plays in AIH has remained undetermined. In this study, expression of CCN1 in liver was detected by real-time PCR, western blot and immunohistochemistry (IHC). CCN1 level in serum was detected by ELISA. Diagnostic value of CCN1 was determined by receiver operating characteristic (ROC) curve analysis. CCN1 conditional knockout (CCN1 fl/fl Cre+) mice were generated by mating CCN1 fl/fl C57BL/6J and CAG-Cre-ERT C57BL/6J mice. Autoimmune hepatitis mice model was induced by concanavalin A (ConA). IKKα/β, IκBα, NF-κB p65 and Akt phosphorylation were determined by western blot. NF-κB p65 nuclear translocation was examined by immunofluorescence. Here, we found that CCN1 was over-expressed in hepatocytes of AIH patients. CCN1 level also increased in serum of AIH patients compared to healthy controls (HC). ROC curve analysis results showed that serum CCN1 was able to distinguish AIH patients from HD. In ConA induced hepatitis mice model, CCN1 conditional knockout (CCN1 fl/fl Cre+) attenuated inflammation by reducing ALT/AST level and IL-6 expression. In vitro, CCN1 treatment dramatically induced IL-6 production in LO2 cells. Moreover, the production of IL-6 was attenuated by CCN1 knockdown. Furthermore, we showed that CCN1 could activate IL-6 production via the PI3K/Akt/NF-κB signaling pathway by binding to α6β1 receptor. In summary, our results reveal a novel role of CCN1 in promoting inflammation by upregulation of IL-6 production in AIH. Our study also suggests that targeting of CCN1 may represent a novel strategy in AIH treatment.

Keywords: AIH (autoimmune hepatitis); CCN1 (cellular communication network factor 1); IL-6 (interleukin 6); NF-kappa B; inflammation.


Conflict of interest statement

The authors declare that the research was conducted in the absence of any commercial or financial relationships that could be construed as a potential conflict of interest.

Figures

Figure 1
Figure 1
Clinical indicators of AIH patients, PBC patients, OS patients and HC controls. Concentrations of ALT, AST, LDLC, ALP, GGT, TC, LDH, Hb and HCT level in AIH patients (n= 59), PBC patients (n= 26), OS patients (n= 22) and HC controls (n= 68).
Figure 2
Figure 2
Diagnostic value of CCN1 in AIH patients. (A) Representative H&E staining images of liver tissues from healthy control and AIH patients. Original magnification ×200 (upper, scale bar: 50 µm), ×1000 (bottom, scale bar: 10 µm). (B) Representative IHC staining images of CCN1 in liver tissues from healthy control and AIH patients. Original magnification ×200 (upper, scale bar: 50 µm), ×1000 (bottom, scale bar: 10 µm). (C) Quantification of IHC staining for CCN1 using IHC profiler. The IHC score was expressed as described in methods section. (D) CCN1 levels in serum from AIH patients (n= 20), PBC patients (n= 13), OS patients (n= 4) and HC controls (n= 25). (E) ROC analysis was performed to evaluate the performance of CCN1 in distinguishing AIH (blue), OS (red) or PBC (green) from HC. **p<0.01.
Figure 3
Figure 3
Correlation between CCN1 and liver function and blood routine indexes. (A-L) Correlation between CCN1 and AST, ALT, GGT, ALP, TBIL, Alb, RBC, WBC, lymphocyte, PLT, HGB, RDW.
Figure 4
Figure 4
Construction and identification of CCN1 conditional knock out mice. (A) mRNA expression of CCN1 in hepatocytes of CCN1 fl/fl Cre+ and CCN1 fl/fl mice determined by real-time PCR. (B) CCN1 protein level in hepatocytes of CCN1 fl/fl Cre+ and CCN1 fl/fl mice detected by Western blot. The relative expression of CCN1 protein was expressed by gray value. (C) IHC staining images of CCN1 in liver tissues from CCN1 fl/fl Cre+ and CCN1 fl/fl mice. Original magnification ×200 (upper, scale bar: 50 µm), ×1000 (bottom, scale bar: 10 µm). (D) Quantification of IHC staining for CCN1 in mice liver using IHC profiler. The IHC score was expressed as described in methods section. Original magnification ×200 (upper), ×1000 (bottom). *p<0.05, **p<0.01.
Figure 5
Figure 5
Knocking down CCN1 expression attenuated liver injury and inflammation in ConA induced hepatitis mice. (A) Representative H&E staining images of liver tissues from ConA induced hepatitis mice. Original magnification ×200 (left, upper, scale bar: 50 µm), ×1000 (right, scale bar: 10 µm). (B) Serum levels of both ALT and AST in CCN1 fl/fl Cre+ (blue circle), CCN1 fl/fl (red circle) and control (black circle) mice. (C) mRNA expression of inflammatory cytokines IFN-γ, IL-17, IL-6 and TNF-α in PBMC from CCN1 fl/fl Cre+ and CCN1 fl/fl mice. (D) mRNA expression of IFN-γ, IL-17, IL-6 and TNF-α in PBMC from CCN1 fl/fl Cre+ and CCN1 fl/fl mice. (E) mRNA expression of IFN-γ, IL-17, IL-6 and TNF-α in liver from CCN1 fl/fl Cre+ and CCN1 fl/fl mice. *p<0.05, ***p<0.001.
Figure 6
Figure 6
CCN1 induced IL-6 production in LO2 cells. (A) IFN-γ, IL-17, IL-6 and TNF-α concentration in supernatant of LO2 cells stimulated by CCN1 (5 μg/ml). (B) IL-6 concentration in supernatant of LO2 cells stimulated by CCN1 (2.5, 5, 7.5, 10μg/ml). (C) CCN1 mRNA expression in CCN1-knockdown LO2 cells. (D) CCN1 protein expression in CCN1-knockdown LO2 cells. The relative expression of CCN1 protein was expressed by gray value. (E) IL-6 mRNA expression in LO2 cells treated with SiCCN1 (small interfering RNA against CCN1, black bar) or SiNC (small RNA of negative control, open bar). (F) IL-6 level in culture supernatant of LO2 cells treated with SiCCN1 or SiNC. *p<0.05, **p<0.01. All experiments were independently repeated at least three times in triplicate.
Figure 7
Figure 7
Signaling pathways involved in IL-6 production regulated by CCN1 in LO2 cells. (A) Expression of integrins and TLR2/4 in LO2 cells treated with CCN1 or BSA control was determined by real-time PCR. (B) Inhibition of CCN1-stimulated IL-6 production by anti-α6β1 mAb. CCN1 protein (5 μg/ml) and anti-α6β1 Ab (20 μg/ml) were premix for 20 min, and then the mixtures were added to LO2 cells culture system for another 24 (h) The culture supernatant was collected for detection of IL-6 protein. (C) Inhibitors of signaling pathways on CCN1-induced IL-6 production. LO2 cells were treated with SP600125 (inhibitor of JNK), BAY11-7082 (inhibitor of NF-kB activation), LY294002 (inhibitor of PI3K), SB203580 (inhibitor of p38 MAPK), U0126 (inhibitor of MEK), Pyridone6 (inhibitor of JAK) and NSC74859 (inhibitor of STAT) for 24 (h) The culture supernatant was collected for detection of IL-6. (D) Phosphorylation of IKKα/β, IκBα, NF-κB p65 and Akt was detected by Western blot. LO2 cells were stimulated with CCN1 (5 mg/ml) for 30 min. (E) Nuclear translocation of NF-κB p65 was monitored by laser confocal fluorescence microscopy. Top panels, Unstimulated LO2. Bottom panels, Stimulated with CCN1 (5 mg/ml) for 60 min. NF-κB was detected by PE–anti-p65 (red). Nuclei were stained with DAPI (blue). Merged picture shows NF-κB translocation into the nucleus. Original magnification ×400. *p<0.05, **p<0.01, ***p<0.001. All experiments were independently repeated at least three times in triplicate.
Figure 8
Figure 8
A schematic model for CCN1-stimulated IL-6 production in hepatocytes. CCN1 stimulates IL-6 production via α6β1/PI3K/Akt/NF-κB signaling pathway in AIH.

Similar articles

Cited by

References

    1. Mieli-Vergani G, Vergani D, Czaja AJ, Manns MP, Krawitt EL, Vierling JM, et al. . Autoimmune Hepatitis. Nat Rev Dis Primers (2018) 4:18017. doi: 10.1038/nrdp.2018.17 - DOI - PubMed
    1. Mack CL, Adams D, Assis DN, Kerkar N, Manns MP, Mayo MJ, et al. . Diagnosis and Management of Autoimmune Hepatitis in Adults and Children: 2019 Practice Guidance and Guidelines From the American Association for the Study of Liver Diseases. Hepatology (2020) 72(2):671–722. doi: 10.1002/hep.31065 - DOI - PubMed
    1. Tanaka A. Autoimmune Hepatitis: 2019 Update. Gut liver (2020) 14(4):430–8. doi: 10.5009/gnl19261 - DOI - PMC - PubMed
    1. Ngu JH, Gearry RB, Frampton CM, Stedman CA. Autoimmune Hepatitis: The Role of Environmental Risk Factors: A Population-Based Study. Hepatol Int (2013) 7(3):869–75. doi: 10.1007/s12072-013-9448-x - DOI - PubMed
    1. Wang H, Feng X, Yan W, Tian D. Regulatory T Cells in Autoimmune Hepatitis: Unveiling Their Roles in Mouse Models and Patients. Front Immunol (2020) 11:575572. doi: 10.3389/fimmu.2020.575572 - DOI - PMC - PubMed

LinkOut - more resources