. 2022 Apr 25:13:863831.
doi: 10.3389/fimmu.2022.863831. eCollection 2022.

Nanobodies Protecting From Lethal SARS-CoV-2 Infection Target Receptor Binding Epitopes Preserved in Virus Variants Other Than Omicron

Affiliations

Nanobodies Protecting From Lethal SARS-CoV-2 Infection Target Receptor Binding Epitopes Preserved in Virus Variants Other Than Omicron

José M Casasnovas et al. Front Immunol. .

Abstract

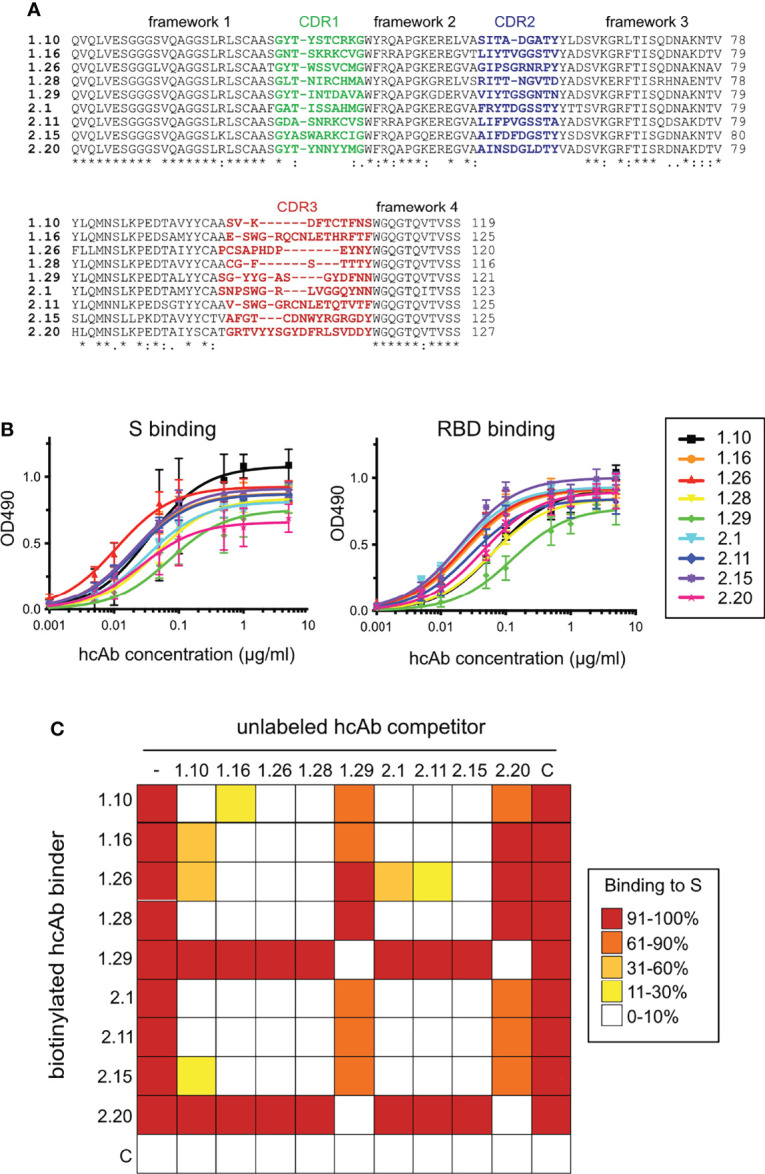
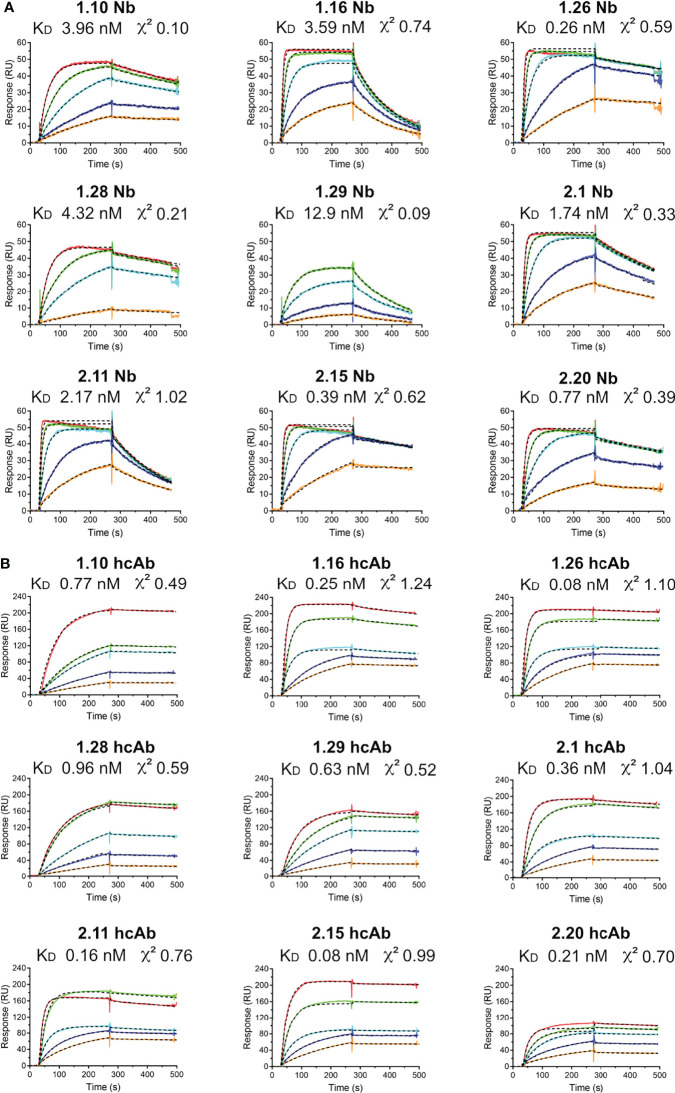
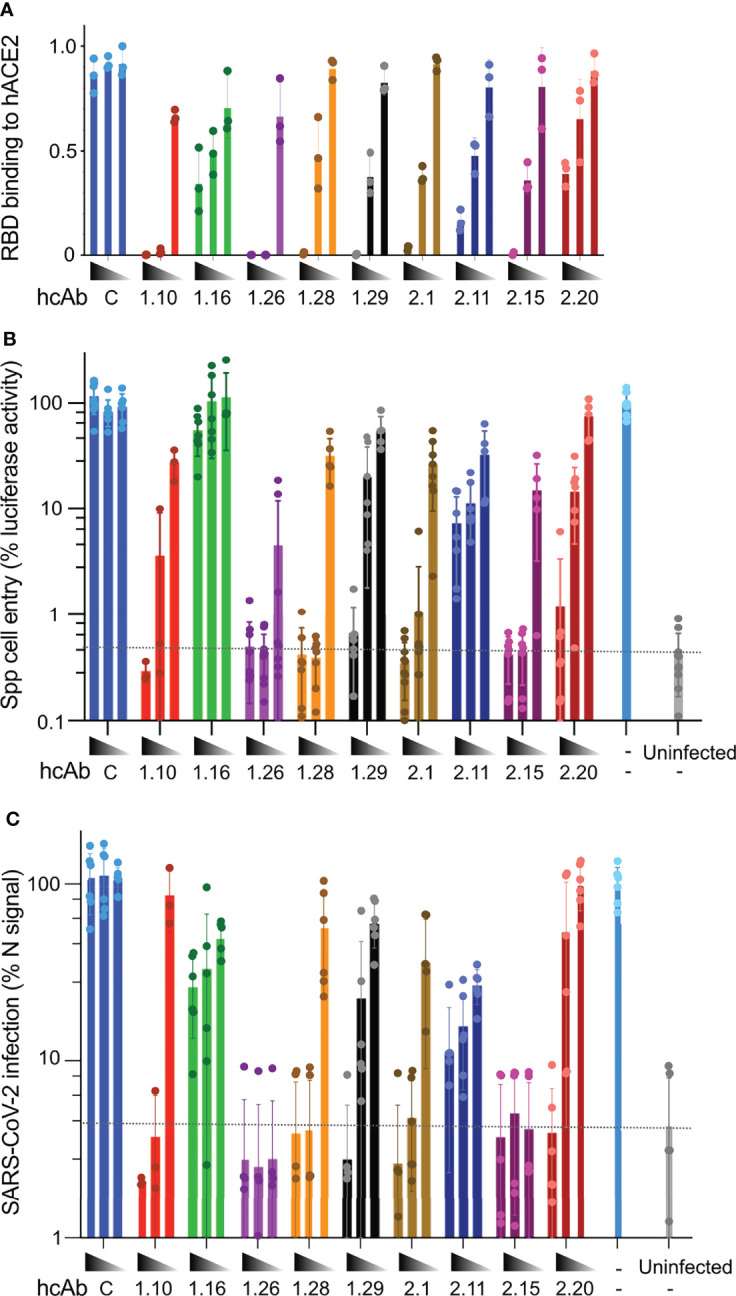
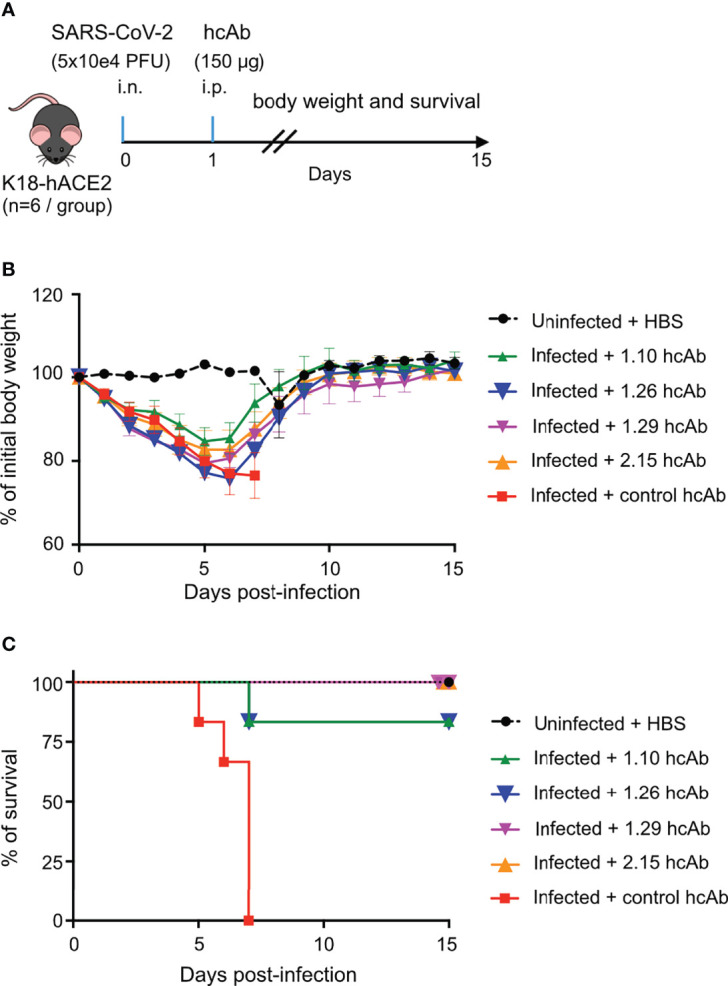
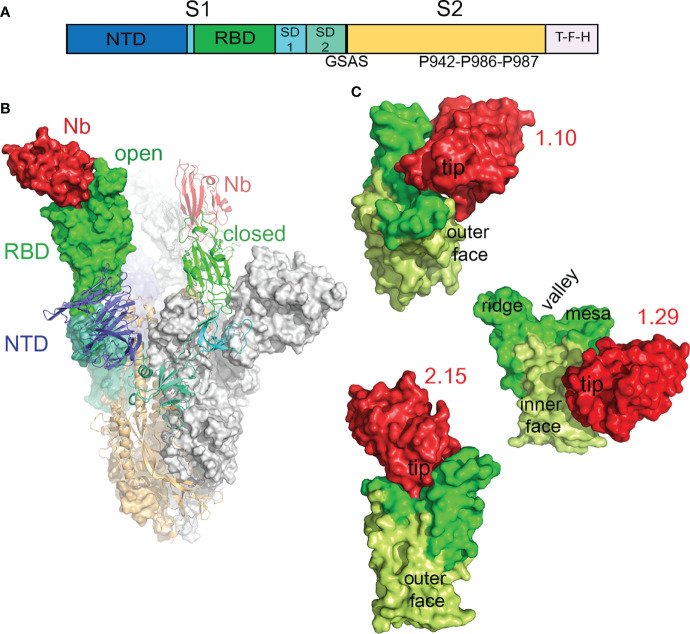
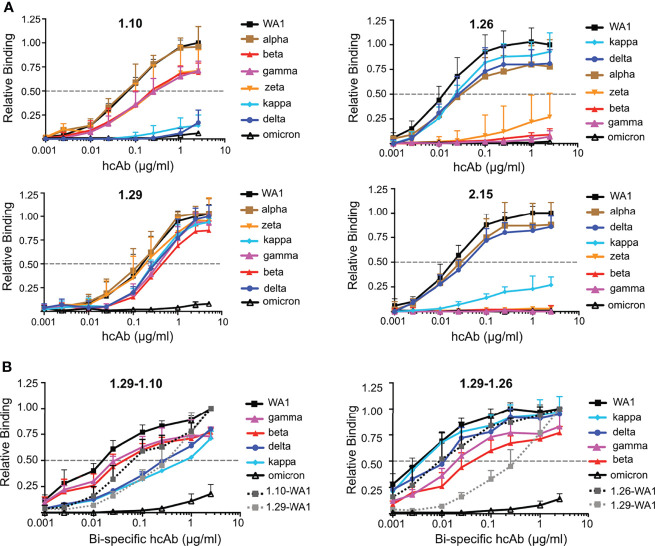
The emergence of SARS-CoV-2 variants that escape from immune neutralization are challenging vaccines and antibodies developed to stop the COVID-19 pandemic. Thus, it is important to establish therapeutics directed toward multiple or specific SARS-CoV-2 variants. The envelope spike (S) glycoprotein of SARS-CoV-2 is the key target of neutralizing antibodies (Abs). We selected a panel of nine nanobodies (Nbs) from dromedary camels immunized with the receptor-binding domain (RBD) of the S, and engineered Nb fusions as humanized heavy chain Abs (hcAbs). Nbs and derived hcAbs bound with subnanomolar or picomolar affinities to the S and its RBD, and S-binding cross-competition clustered them in two different groups. Most of the hcAbs hindered RBD binding to its human ACE2 (hACE2) receptor, blocked cell entry of viruses pseudotyped with the S protein and neutralized SARS-CoV-2 infection in cell cultures. Four potent neutralizing hcAbs prevented the progression to lethal SARS-CoV-2 infection in hACE2-transgenic mice, demonstrating their therapeutic potential. Cryo-electron microscopy identified Nb binding epitopes in and out the receptor binding motif (RBM), and showed different ways to prevent virus binding to its cell entry receptor. The Nb binding modes were consistent with its recognition of SARS-CoV-2 RBD variants; mono and bispecific hcAbs efficiently bound all variants of concern except omicron, which emphasized the immune escape capacity of this latest variant.

Keywords: COVID-19; SARS-CoV-2 variants; coronavirus; nanobodies; neutralizing antibodies.


Conflict of interest statement

JMC, YM, MN, PG, UG, JS, MM-A, JAC, and LF are co-inventors on patent applications covering the Nb and hcAb molecules described in this manuscript. The remaining authors declare that the research was conducted in the absence of any commercial or financial relationships that could be construed as a potential conflict of interest.

Figures

Figure 1
Figure 1
SARS-CoV-2 RBD-specific Nbs, binding to S and RBD proteins, and cross-competition analysis. (A) Sequence alignment of the 1.10, 1.16, 1.26, 1.28, 2.1, 2.11, 2.15 and 2.20 Nbs selected from bacterial libraries that displayed VHH domains isolated from two immunized dromedaries with the SARS-CoV-2 RBD ( Figure S1 ). Their VHH frameworks and complementarity determining regions (CDRs) 1 to 3 are indicated. Alignment generated with Clustal Omega (55). Labels indicate full conservation (*) or degree of conservation (: or .). (B) Binding of Nb-derived hcAbs to the S (left) or RBD (right). The hcAbs contained the RBD-specific Nb domains fused to the human IgG1 hinge and Fc portion ( Figure S2A ). Binding of serial hcAb dilutions to plastic-bound proteins measured as Optical Density at 490 nm (OD490) as described in Materials and methods. Average and standard deviations (n ≥ 3). (C) S binding competition among hcAbs. Heatmap representation of the binding data shown in Figure S3 , and determined with biotin labeled hcAbs (left) without (-) or with the unlabeled hcAb competitor shown on the top. A control hcAb (C) was also included. Mean of three independent experiments (n = 3).
Figure 2
Figure 2
Nb and hcAb binding to the SARS-CoV-2 RBD ligand in real time. Overlayed sensorgrams recorded during the association and dissociation of the indicated Nbs (A) or hcAbs (B) through BIAcore sensor chip surfaces with captured RBD. Nb or hcAb concentrations of 5 (orange), 10 (blue), 25 (cyan), 50 (green) or 100 nM (red) were injected through the RBD and a control surface. The plots show the specific response (RU) after double referencing (see Materials and methods). The discontinuous dark lines represent the curve fitting to a 1:1 Langmuir model for determination of the kinetic constants, shown in Table S1 . The equilibrium dissociation contents (KD) and the fitting χ2 are indicated here.
Figure 3
Figure 3
hcAb inhibition of RBD binding to ACE2 and SARS-CoV-2 cell infection in vitro. (A) RBD binding to hACE2 in the presence of the indicated hcAbs (1.10, 1.16, 1.26, 1.28, 2.1, 2.11, 2.15, 2.20) or a control hcAb (C). Immunoassays with biotinylated RBD-Fc (20 nM) and increasing hcAb concentrations (50, 100 and 200 nM, from right to left). Mean and SD from three independent assays (n = 3). (B) Inhibition of Vero-E6 cell entry of pseudotyped viral particles with SARS-CoV-2 S protein (Spp) by the indicated hcAbs at increasing concentrations (0.5, 5 and 50 nM). The luciferase activity of cell cultures was determined 48 h.p.i. Background luciferase activity of uninfected cell cultures is shown with a dashed line. (C) Inhibition of SARS-CoV-2 virus cell infection by the indicated hcAbs as in (B) Infection efficiency was determined by immunofluorescence 24 h.p.i. by staining with anti-N monoclonal Ab (Materials and methods). Background fluorescence detected in uninfected cell cultures is shown with a dashed line. (B, C) Infected cell cultures without hcAb (-) used as positive controls for Spp and SARS-CoV-2 infections.
Figure 4
Figure 4
hcAbs protection of hACE2-trangenic mice after a lethal SARS-CoV-2 infection. (A) In vivo experiment design. On day 0, groups of K18-hACE2 mice (n=6/group) were either infected intranasally (i.n) with a lethal dose of 5x10⁴ plaque forming units (PFU) of SARS-CoV-2 (infected groups) or mock infected with PBS (uninfected group). On day 1 postinfection, 150 μg of 1.10, 1.26, 1.29, 2.15 or control hcAbs, were administered intraperitoneally (i.p.) to animals in the infected groups. The uninfected group was treated i.p. with HBS. (B) Percentage of daily body weight of animals in each experimental group (as indicated) relative to their body weight on day 0, before infection. Mean and SD of 6 animals. (C) Percentage of daily mice survival in each experimental group up to 15 d.p.i.
Figure 5
Figure 5
Cryo-EM structure of the SARS-CoV-2 S in complex with RBD-specific Nbs. (A) Scheme of the S construct used to generate the S-Nb complexes. The extracelular S1 with the N-terminal domain (NTD), receptor-binding domain (RBD), subdomains 1 and 2, and the S2 region are shown colored. The soluble S contained a T4 trimerization domain (T), a Flag peptide (F), and a 6xHis-tag (H) at its C-termininal end. The furin site was substituted by the GSAS sequence and the indicated three prolines were introduced at the S2 region to enhance protein stability and expression. (B) Cryo-EM structure of the trimeric S in the prefusion form with a Nb (2.15) bound to its RBD. Models of the S and the Nb were fitted into the cryo-EM map of the S-2.15 complex ( Figure S6 ), as described in Materials and methods. The S monomers with the open RBD are represented as surfaces, either with the domains colored as in A or in grey, whereas the monomer with the closed RBD is shown as ribbon with the domains colored. The two modeled Nbs bound to the RBDs are shown in red. (C) Structures of the SARS-CoV-2 neutralizing 1.10, 1.29 and 2.15 Nbs bound to the RBD. Surface representations of RBD-Nb modeled in the cryo-EM maps shown in Figure S6 ; the RBDs are shown with the RBM in green, the RBD core in light-green and the Nbs in red. The RBD surfaces facing toward (inner) or opposity (outer) to the S trimer center, and the RBM regions are indicated.
Figure 6
Figure 6
Nb binding epitopes at the SARS-CoV-2 RBD, overlapping with the ACE2 receptor binding region and with mutations in the SARS-CoV-2 RBD variants. (A) The SARS-CoV-2 RBD-ACE2 complex structure. Ribbon representation of the RBD-ACE2 crystal structure (PDB id 6LZG), with ACE2 colored in salmon, the RBD with the RBM in green, the core in light-green and with its ACE2-binding residues as a surface in magenta. The ACE2 motifs that contact the indicated RBM regions labeled. (B, C) Structures of the SARS-CoV-2 neutralizing Nbs bound to the RBD. Ribbon representations of the RBD and the indicated bound Nb (red) with the CDRs (1, 2 and 3) that contacted the ligand labeled. Surface representations of the RBD residues at the interface with the Nbs are shown pink and with the residues that also engaged ACE2 in magenta, as in panel (A). (D) RBD adaptation in SARS-CoV-2 variants of concern, except omicron. RBD residues that changed with respect to WA1 in the alpha (N501Y), beta (K417N, E484K, N501Y), delta (L452R, T478K), gamma (K417T, E484K, N501Y) and kappa (L452R, E484Q) variants are shown as red or blue spheres. (E) RBD evolution in the SARS-CoV-2 omicron variant. Side chains of RBD residues altered with respect to WA1 in the RBM or RBD core are shown as red or orange spheres, respectively. Residue substitutions are indicated.
Figure 7
Figure 7
Monospecific and bispecific hcAb recognition of RBD variants. (A) Binding of hcAbs 1.10, 1.26, 1.29 and 2.15 (indicated on top of each graph) to RBD-Fc protein variants, which are shown and color coded on the right of each graph; listed from higher (top) to lower (bottom) hcAb binding activity. The OD490 determined with serial hcAb dilutions as in Figure 1 was normalized to the maximum binding signal with the WA1 protein. The dotted line represents half of the maximum hcAb binding to WA1 RBD-Fc, used to determined EC50 values. Mean and standard deviation (SD) of at least three independent assays (n ≥ 3). (B) Binding of bispecific hcAbs 1.29-1.10 and 1.29-1.26 carried out as in (A) Binding of the monospecific hcAbs 1.29, 1.10 or 1.26 to the WA1 RBD are also shown for direct comparison with the bispecific hcAbs. Data are mean and standard deviation (SD) of three independent assays (n = 3).

Similar articles

Cited by

References

    1. Zhou P, Yang X-L, Wang X-G, Hu B, Zhang L, Zhang W, et al. . A Pneumonia Outbreak Associated With a New Coronavirus of Probable Bat Origin. Nature (2020) 579(7798):270–3. doi: 10.1038/s41586-020-2012-7 - DOI - PMC - PubMed
    1. Kumar S, Chandele A, Sharma A. Current Status of Therapeutic Monoclonal Antibodies Against SARS-CoV-2. PloS Pathog (2021) 17(9):e1009885. doi: 10.1371/journal.ppat.1009885 - DOI - PMC - PubMed
    1. Corti D, Purcell LA, Snell G, Veesler D. Tackling COVID-19 With Neutralizing Monoclonal Antibodies. Cell (2021) 184(12):3086–108. doi: 10.1016/j.cell.2021.05.005 - DOI - PMC - PubMed
    1. Li F. Evidence for a Common Evolutionary Origin of Coronavirus Spike Protein Receptor-Binding Subunits. J Virol (2012) 86(5):2856–8. doi: 10.1128/JVI.06882-11 - DOI - PMC - PubMed
    1. Ke Z, Oton J, Qu K, Cortese M, Zila V, McKeane L, et al. . Structures and Distributions of SARS-CoV-2 Spike Proteins on Intact Virions. Nature (2020) 588(7838):498–502. doi: 10.1038/s41586-020-2665-2 - DOI - PMC - PubMed

Publication types

Supplementary concepts