. 2022 Mar 28;12(7):3131-3149.
doi: 10.7150/thno.69217. eCollection 2022.

Shh and Olig2 sequentially regulate oligodendrocyte differentiation from hiPSCs for the treatment of ischemic stroke

Affiliations

Shh and Olig2 sequentially regulate oligodendrocyte differentiation from hiPSCs for the treatment of ischemic stroke

Jian Xu et al. Theranostics. .

Abstract

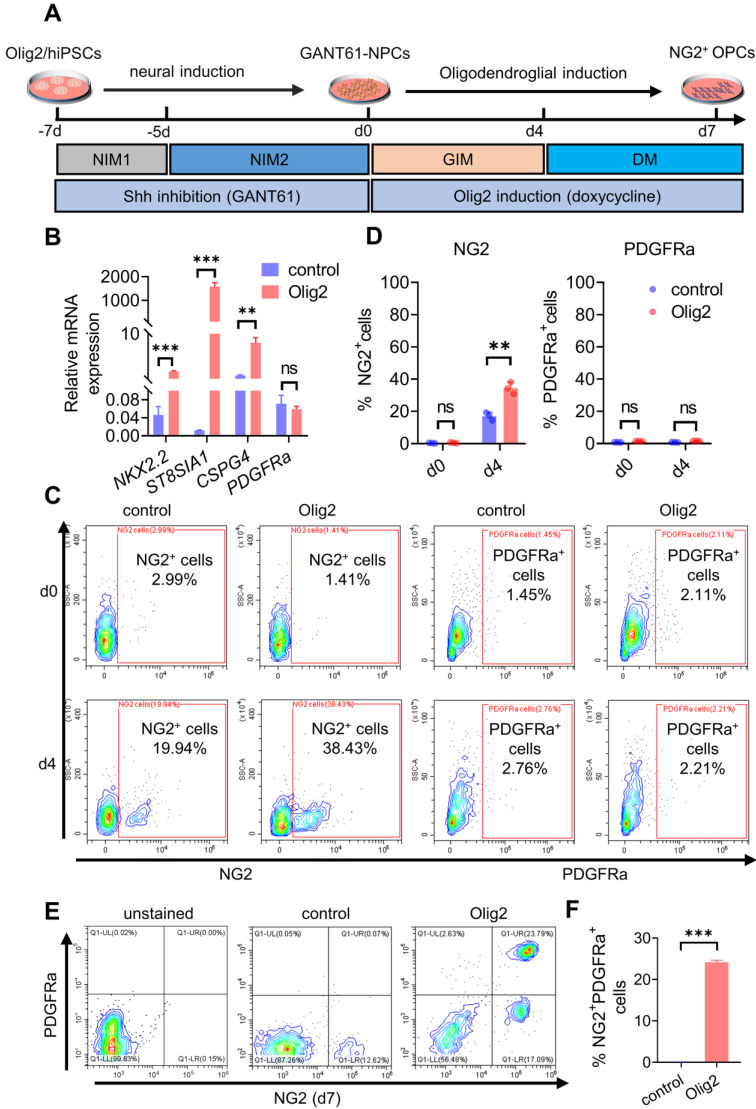
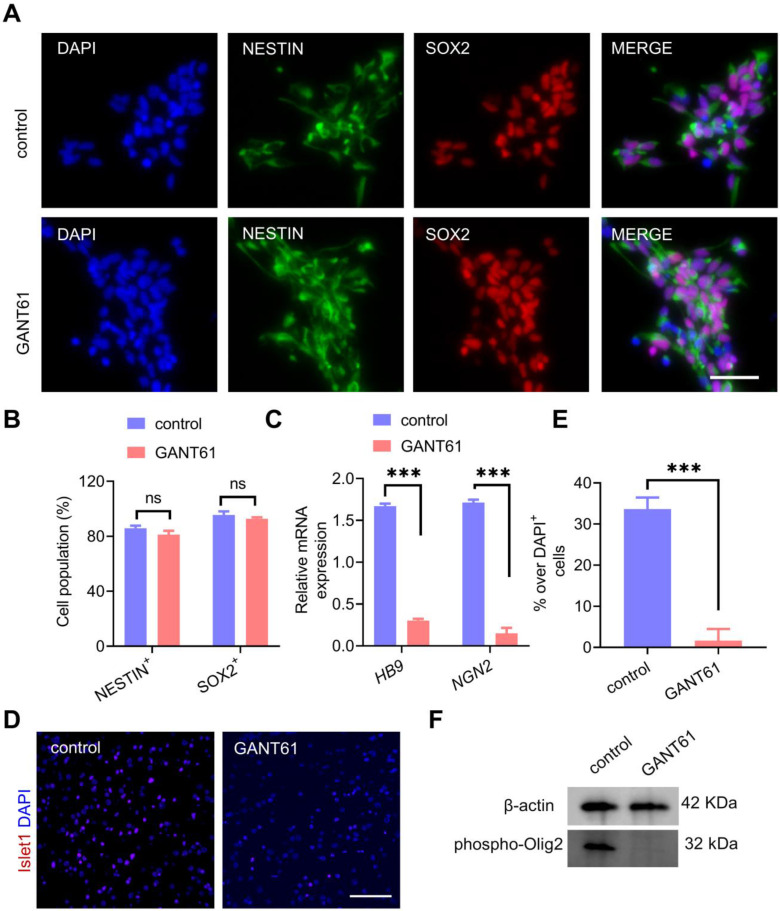
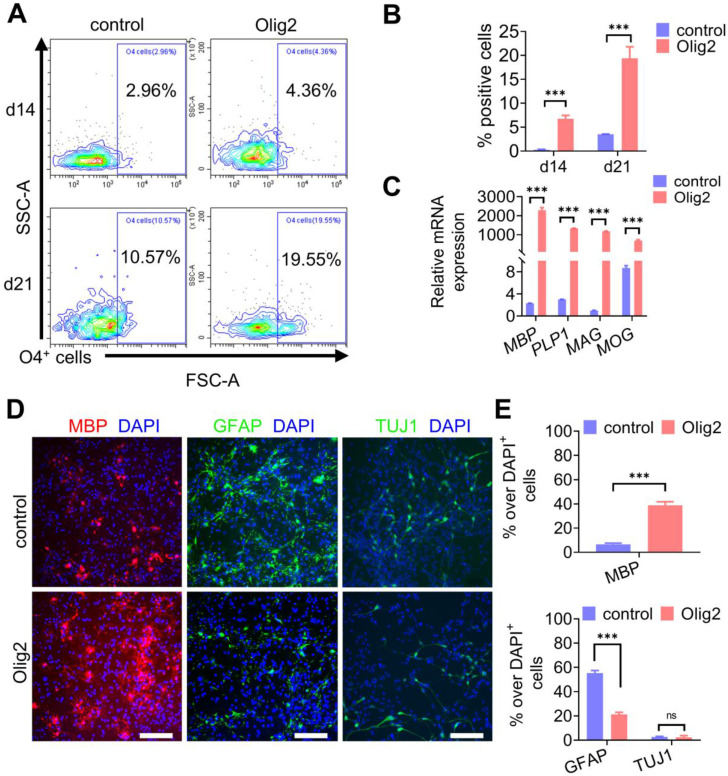
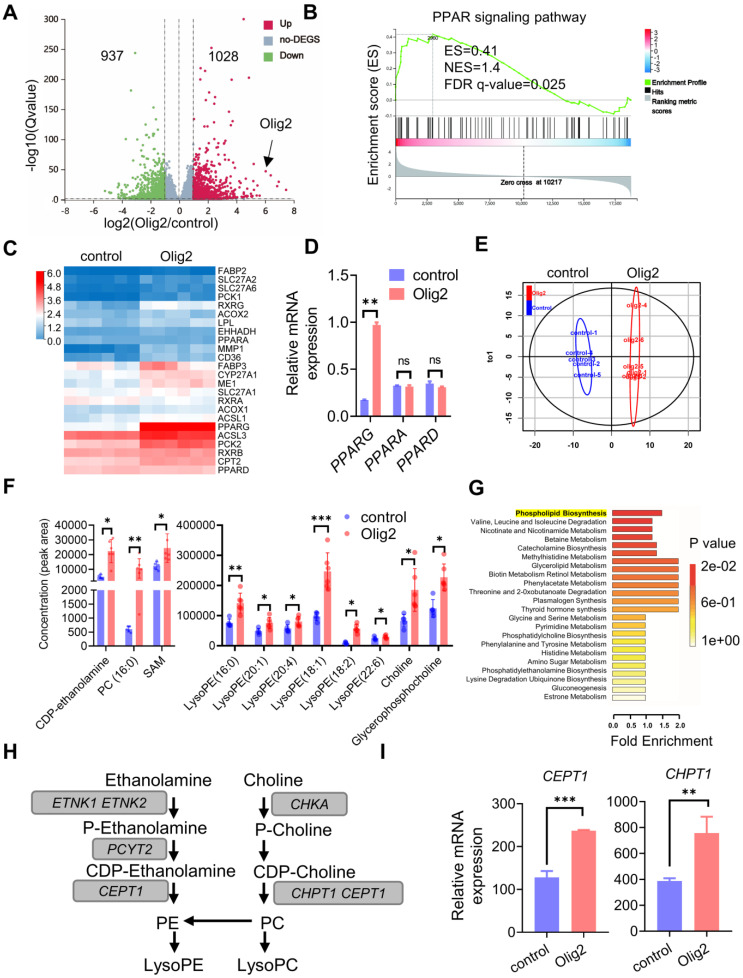
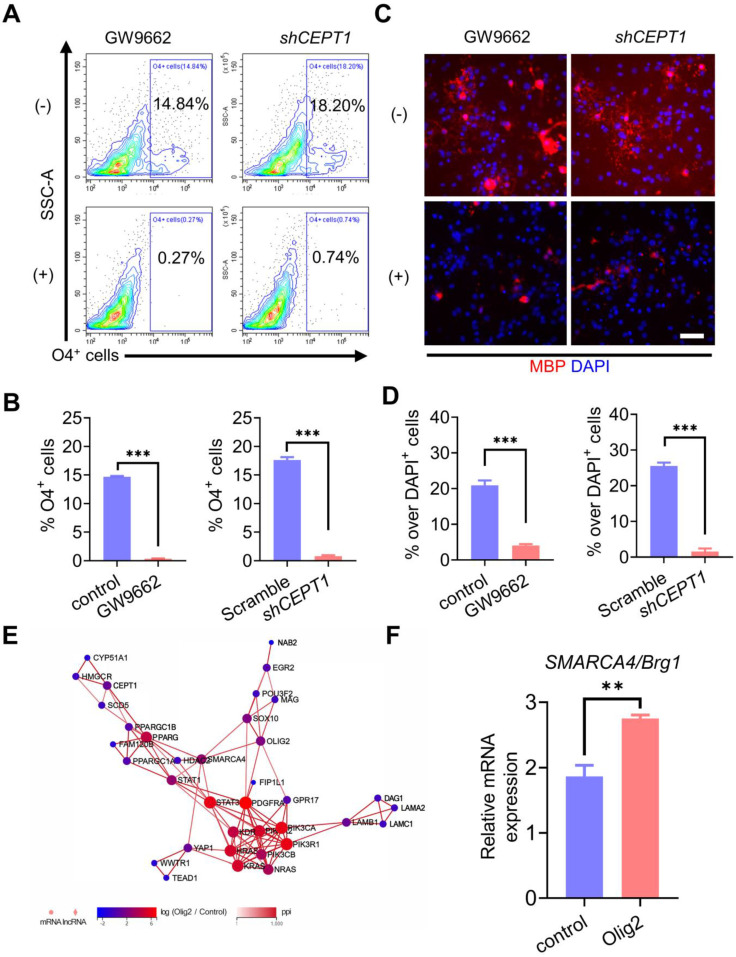
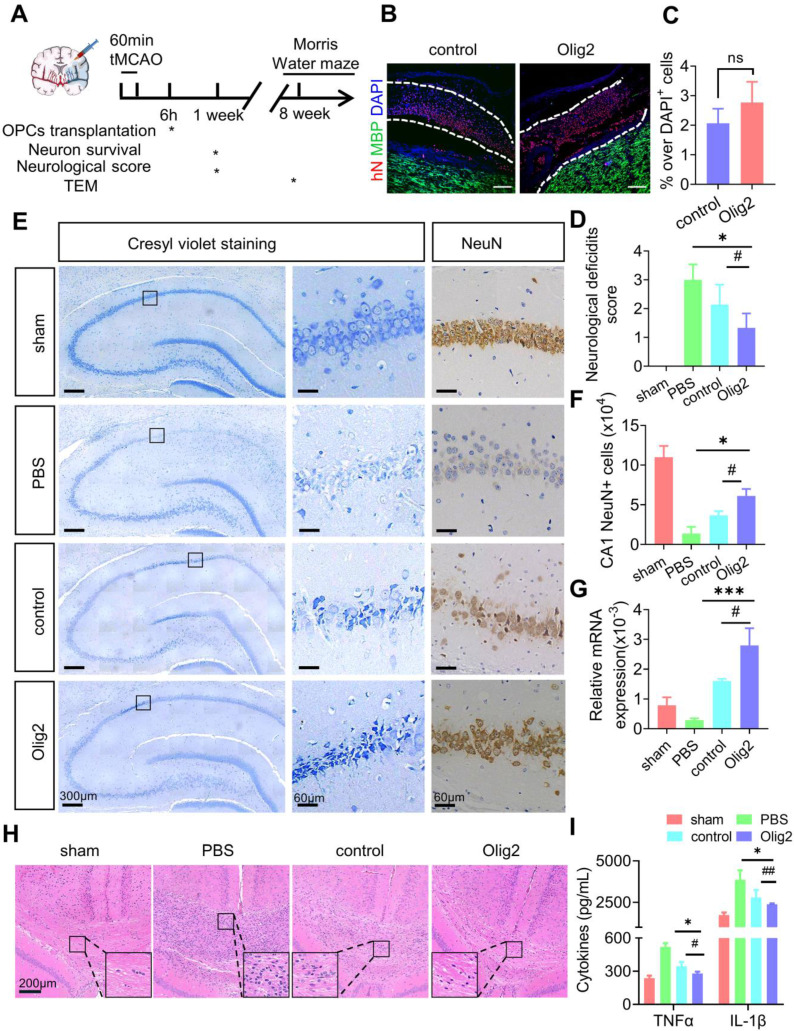
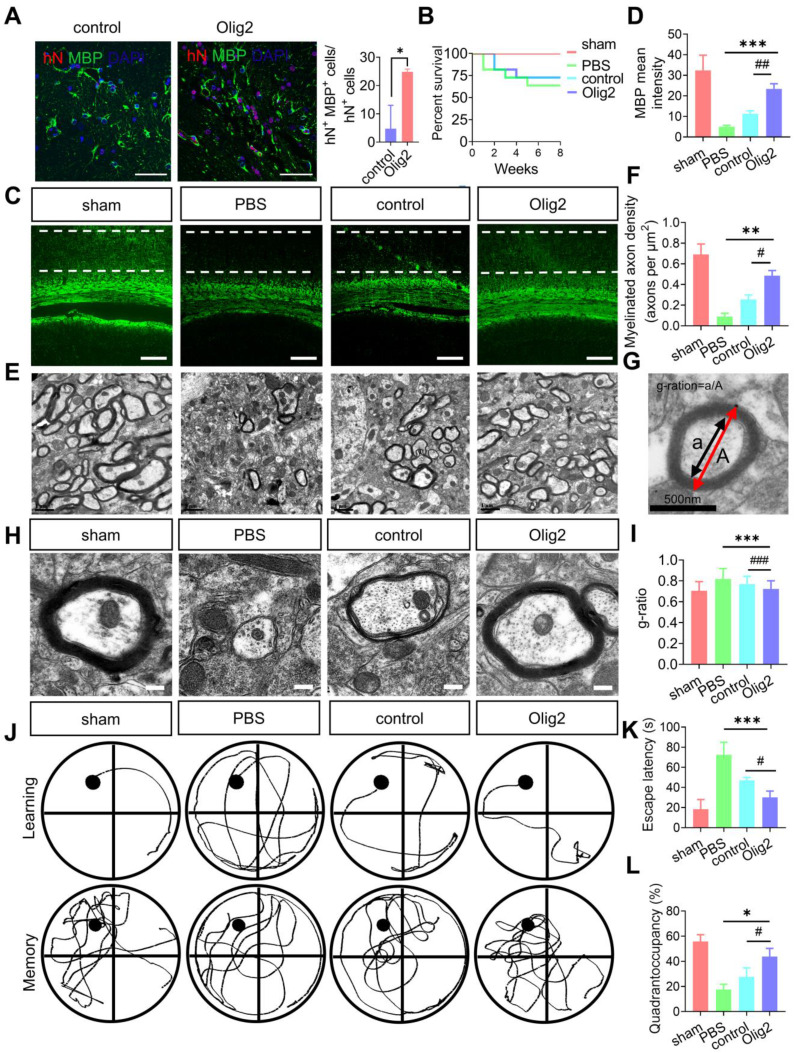
Rationale: Demyelination is a major component of white matter injury, characterized by oligodendrocyte (OL) death and myelin sheath loss, which result in memory loss and cognitive impairment in the context of ischemic stroke. Accumulating evidence has shown that OLs can be generated by the direct activation of defined transcription factors (TFs) in human induced pluripotent stem cells (hiPSCs); however, the rapid acquisition of single TF-induced OL progenitor cells (OPCs) as cell therapy for ischemic stroke remains to be thoroughly explored. Methods: A stable, chemically defined protocol was used to generate a substantial number of transplantable and functional OLs through the partial inhibition of sonic hedgehog (Shh) activity by GANT61 during neural induction from hiPSCs and sequential induction of TF Olig2 overexpression. Transcriptome and metabolome analyses further revealed a novel molecular event in which Olig2 regulates OL differentiation from hiPSC-derived neural progenitor cells (NPCs). Olig2-induced NG2+ OPCs (Olig2-OPCs) were then evaluated for their therapeutic potential in cell-based therapy for ischemic stroke. Results: GANT61 treatment resulted in a motor neuron (MN)-OL fate switch during neural induction, and induced overexpression of Olig2 accelerated oligodendroglial lineage cell specification. Olig2-OPCs expressed typical oligodendroglial lineage marker genes, including NKX2.2, CSPG4, and ST8SIA1, and displayed superior ability to differentiate into mature OLs in vitro. Mechanistically, Olig2-OPCs showed increased gene expression of the peroxisome proliferator-activated receptor γ (PPARγ) signaling pathway, and activated CEPT1-mediated phospholipogenesis. Functionally, inhibiting PPARγ and knocking down CEPT1 further compromised the terminal differentiation of Olig2-OPCs. Most importantly, when transplanted into a rat model of transient middle cerebral artery occlusion (tMCAO), Olig2-OPCs efficiently promoted neurological functional recovery by reducing neuronal death, promoting remyelination, and rescuing spatial memory decline. Conclusions: We developed a stable, chemically defined protocol to generate OPCs/OLs with partial inhibition of Shh activity by GANT61 from hiPSCs and sequentially induced the expression of the single TF Olig2. Olig2-OPC transplantation may be an ideal alternative approach for ischemic stroke rehabilitation therapy.

Keywords: Human induced pluripotent stem cells (hiPSCs); Ischemic stroke.; Olig2; Oligodendrocyte progenitor cells (OPCs); Sonic hedgehog (Shh).


Conflict of interest statement

Competing Interests: The authors have declared that no competing interest exists.

Figures

Figure 1
Figure 1
Transient Shh inhibition by GANT61 and Olig2 overexpression sequentially promoted NG2+ OPC differentiation from hiPSCs. A Strategy for generating OPCs derived from Olig2/hiPSCs treated with GANT61 during neural induction and sequentially inducing Olig2 overexpression by doxycycline treatment. Adherent hiPSC colonies were differentiated into NPCs (GANT61-NPCs) by adding GANT61 to NIM1 and NIM2 from d-7 to d0. The cultured GANT61- NPCs were dissociated into single cells in six-well plates precoated with poly-L-ornithine/laminin and then subjected to glial induction with GIM and DM containing Y-27632. B The mRNA expression levels of oligodendroglial lineage genes (NKX2.2, CSPG4, ST8SIA1, and PDGFRa) involved in OL development at d4 after Olig2 induction (** p < 0.01, *** p < 0.001, by a two-tailed Student's t test). C Representative flow cytometry analyses for the expression of NG2 and PDGFRα in the control and Olig2 induction cultures at d4 after Olig2 induction. D The corresponding quantification of NG2+ and PDGFRα+ cells at d4 in control and Olig2-induced cultures (ns p > 0.05, ** p < 0.01, by a two-tailed Student's t test). Representative flow cytometry analyses (E) and quantification (F) of the coexpression of NG2 and PDGFRα in the control and Olig2-induced cultures at d7 of differentiation after Olig2 induction (*** p < 0.001, by a two-tailed Student's t test). The graphs represent the individual data points and the mean ± SEM of three independent experiments. Immunofluorescence images are representative of n = 3 biological replicates.
Figure 2
Figure 2
Shh inhibition abolished MN formation and facilitated the MN-OL fate switch by blocking Olig2 phosphorylation at Ser147. A Representative immunofluorescent staining images of control NPCs and GANT61-NPCs showed coexpression of NPC markers (NESTIN and PAX6) at d0 of differentiation; scale bar, 50 μm. B The corresponding quantification of NESTIN+/PAX6+ NPCs from control NPCs and GANT61-NPCs (at d0 of differentiation, ns p > 0.05, a two-tailed Student's t test). GANT61 treatment did not affect NPC formation from hiPSCs. C The mRNA expression levels of MN marker genes (HB9 and NGN2) were analyzed by qPCR in control NPCs and GANT61 NPCs (at d0 of differentiation, *** p < 0.001, by a two-tailed Student's t test). GANT61 treatment downregulated MN-specific marker genes (HB9 and NGN2). D Representative immunofluorescent staining images of the MN marker Islet1 in control NPCs and GANT61-NPCs; scale bar, 100 μm. E Quantification of the expression of Islet1 in the control NPCs and GANT61 NPCs. GANT61 treatment downregulated the MN-specific protein marker Islet1 (*** p < 0.001, by a two-tailed Student's t test). F Western blot analysis of Olig2 phosphorylation at Ser147. GANT61 treatment blocked Olig2 phosphorylation at Ser147. Control-NPCs and GANT61-NPCs were immunoblotted with an anti-Olig2 (phospho-S147) antibody, and proteins were normalized to the housekeeping gene β-actin. The graphs represent the individual data points and the mean ± SEM of three independent experiments. Immunofluorescence images are representative of n = 3 biological replicates.
Figure 3
Figure 3
Maturation of Olig2-OPCs into OLs. A Representative flow cytometry analyses for the expression of O4+ cells at d7, d14 and d21 of differentiation. B Quantification of O4+ cells in control and Olig2 induction cultures at d7, d14 and d21 of differentiation (*** p < 0.001, by a two-tailed Student's t test). C The mRNA expression levels of MBP, PLP1, MAG, and MOG at d21 of OL differentiation (*** p < 0.001, by a two-tailed Student's t test). D Immunostaining of MBP, GFAP and TUJ1 at d21 of differentiation; scale bars, 100 μm. E Quantification of MBP+ OLs, GFAP+ astrocytes and TUJ1+ neurons in the control and Olig2 induction cultures at d21 of differentiation (ns p > 0.05, *** p < 0.001, by a two-tailed Student's t test). The graphs represent the individual data points and the mean ± SEM of three independent experiments. Immunofluorescence images are representative of n = 3 biological replicates.
Figure 4
Figure 4
Olig2 overexpression altered the expression of genes and metabolites involved in the PPARγ-mediated phospholipogenesis pathway. A Volcano plots of significantly differentially expressed genes (DEGs). Transcriptome analysis of Olig2-OPCs and control-OPCs (n = 6), red, upregulated; green, downregulated. B Gene set enrichment analysis (GSEA) indicated strong enrichment of the PPAR signaling pathway in Olig2-OPCs. C Heatmap evaluation of the expression of genes linked to lipid metabolism. D The mRNA expression levels of PPARG, PPARA, and PPARD in Olig2-OPCs and control-OPCs (ns p > 0.05, ** p < 0.01, by a two-tailed Student's t test). E PCA score plots of HILICESI+-MS metabolomics profiles obtained from HILIC-ESI+-MS, control-OPCs, n = 5; Olig2-OPCs, n = 6. F Metabonomic analysis showed that several species of intermediates and hydrolysates of phospholipid biosynthesis were increased in Olig2-OPCs (n = 5/6, * p < 0.05, ** p < 0.01, *** p < 0.001, by a two-tailed Student's t test). G Metabolite set enrichment analysis (MSEA) showed differential metabolites highly enriched in phospholipid biosynthesis in Olig2-OPCs. H The mRNA expression levels of CEPT1 and CHPT1 in Olig2-OPCs and control-OPCs (** p < 0.01, *** p < 0.001, by a two-tailed Student's t test). The graphs represent the individual data points and the mean ± SEM of three independent experiments.
Figure 5
Figure 5
Olig2 interacted with PPARγ and participated in phospholipogenesis involved in OL differentiation partially through SMARCA4 (Brg1) expression. A Flow cytometric analysis of the effect of pharmacological inhibition of PPARγ or CEPT1 knockdown on Olig2-OPC differentiation, and O4+ cells were determined at d21 of differentiation. B Quantification of O4+ cells at d21 of differentiation (*** p < 0.001, by a two-tailed Student's t test). C Immunostaining analysis of MBP expression to explore the effect of pharmacological inhibition of PPARγ or CEPT1 knockdown on Olig2-OPC differentiation at d21 of differentiation (scale bar, 50 μm). D Quantification of MBP+ cells at d21 of differentiation (*** p < 0.001, by a two-tailed Student's t test). E PPI networks among the main differentially expressed genes in control-OPCs and Olig2-OPCs indicated that overexpression of Olig2 might promote OL differentiation partially through the SMARCA4/Brg1-PPARG-CEPT1 signaling axis. F qPCR results indicated that the mRNA expression level of SAMRCA4/Brg1 was significantly upregulated in Olig2-OPCs (** p < 0.01, by a two-tailed Student's t test). The graphs represent the individual data points and the mean ± SEM of three independent experiments. Immunofluorescence images are representative of n = 3 biological replicates.
Figure 6
Figure 6
Transplanted Olig2-OPCs promoted neuronal survival by suppressing inflammation and the immune response in ischemic stroke rats. A Scheme depicting the procedure of OPC or PBS administration after tMCAO and the detection of neuronal survival, neurological deficit scores, TEM and Morris water maze test. B Representative images showing that at 1 week after transplantation, transplanted cells were identified by human nuclei (hN) staining. Notably, the majority of the transplanted cells were found around the hippocampus. Scale bar, 200 μm. C Quantitative results from brain sections containing structures of the hippocampus showed that the engraftment efficiency was indistinguishable between the Olig2-OPC and control-OPC transplantation groups (ns p>0.01, by a two-tailed Student's t test). D Neurological deficit scores in different groups at 1 week were evaluated (n = 11, * p < 0.05, comparison between the sham group versus the groups that received cell transplantation; # p < 0.05, by one-way ANOVA, comparison between the two groups that received cell transplantation, by one-way ANOVA). E Representatives of cresyl violet staining and NeuN DAB staining performed on the sections from the hippocampus in the sham, PBS and groups that received cell transplants subjected to 8 weeks of reperfusion after 60 min of tMCAO with PBS control and intraventricular administration of Olig2-OPCs or control-OPCs. The squared areas in cresyl violet staining are shown at high magnification (scale bar, 60 μm). Corresponding areas are also shown for NeuN staining (scale bar, 60 μm). F The number of hippocampal CA1 neurons in the different groups measured by stereological analysis (n = 3 for each group, * p < 0.05, comparison between the sham group and the groups that received cell transplantation; # p < 0.05, one-way ANOVA, comparison between the two groups that received cell transplantation, one-way ANOVA). G qPCR analysis of BDNF mRNA expression levels from the sham, PBS and groups that received cell transplantation (n = 3, *** p < 0.001, comparison between the sham and the groups that received cell transplantation; # p < 0.05, by one-way ANOVA, comparison between the two groups that received cell transplantation, by one-way ANOVA). H Representative tissue sections of H&E staining in the hippocampus at 1 week from the sham, PBS and groups that received cell transplantation. Scale bar, 200 μm. I ELISA of TNF-α and IL-1β in the infarct brain tissue from the sham group and groups that received cell transplantation or PBS group (n = 3, * p < 0.05, comparison between the sham group versus the group that received cell transplantation; # p < 0.05, ## p < 0.01, by one-way ANOVA, comparison between the two groups that received cell transplantation, by one-way ANOVA). The graphs represent the individual data points and the mean ± SEM of three independent experiments.
Figure 7
Figure 7
Enhanced OL generation and remyelination by Olig2-OPC transplantation promoted the recovery of spatial learning and cognitive ability. A Representative immunofluorescent staining of hippocampal sections in the sham, PBS and groups that received cell transplantation (scale bar, 100 μm). Donor-derived myelination defined by MBP staining (green) was apparent throughout the hippocampus in rats receiving Olig2-OPCs at 8 weeks. In contrast, very few MBP+ cells expressed hN in animals receiving control-OPC transplantation (scale bar, 100 μm, * p < 0.05, by a two-tailed Student's t test). B Analysis of survival (percentage, Kaplan-Meier) from the sham and PBS groups and groups that received cell transplantation. C Representative immunofluorescent images of MBP in the sham, PBS and groups that received cell transplantation (scale bar, 100 μm). D Quantitative analysis of the fluorescence intensity of MBP staining in the CA1 region (*** p < 0.001, comparison between the sham group and the group that received cell transplantation; ## p < 0.01, by one-way ANOVA, comparison between the two groups that received cell transplants, by one-way ANOVA). E Representative electron micrographs of brain sections from the sham, PBS and groups that received cell transplantation (scale bar, 1 μm). F Quantitative analysis of the density of myelinated axons from sham, PBS and groups that received control-OPC and Olig2-OPC transplantation (** p < 0.01, comparison between the sham versus groups that received cell transplants; # p < 0.05, by one-way ANOVA, comparison between the two groups that received cell transplantation, by one-way ANOVA). G Diagram and analysis of the average g-ratios of myelinated axons. Line “A” indicates the diameter of a myelinated axon fiber, and line “a” indicates the diameter of the axonal caliber. Scale bar, 0.5 μm. H Representative electron micrographs at high magnification. Scale bars, 0.2 μm. I Mean g ratio of the four groups (n = 100, *** p < 0.001, comparison between the sham group and the group that received cell transplantation; ### p < 0.001, by one-way ANOVA, comparison between the two groups that received cell transplantation, by two-way ANOVA). J Representative sample paths from the maze trials (upper panel) and the search patterns on the probe trials (lower panel) after 8 weeks. K The Morris water maze test was performed to determine the spatial learning ability of the four groups, as shown by the time (escape latency) to find the submerged platform after 8 weeks (n = 6/7, *** p < 0.001, comparison between the sham group and the group that received cell transplantation; # p < 0.05, by two-way ANOVA, comparison between the two groups that received cell transplantation, by one-way ANOVA). L Probe trials were performed 4 h after the last maze trials and monitored by relative radial quadrant occupancy (time spent in the target quadrant, n = 6/7, * p < 0.05, comparison between the sham group versus the group that received cell transplantation; # p < 0.05, by one-way ANOVA, comparison between the two groups that received cell transplantation, by one-way ANOVA). The graphs represent the individual data points and the mean ± SEM of three independent experiments.

Similar articles

Cited by

References

    1. Bradl M, Lassmann H. Oligodendrocytes: biology and pathology. Acta Neuropathol. 2010;119:37–53. - PMC - PubMed
    1. Lo EH, Dalkara T, Moskowitz MA. Mechanisms, challenges and opportunities in stroke. Nat Rev Neurosci. 2003;4:399–415. - PubMed
    1. Domercq M, Perez-Samartin A, Aparicio D, Alberdi E, Pampliega O, Matute C. P2X7 receptors mediate ischemic damage to oligodendrocytes. Glia. 2010;58:730–40. - PubMed
    1. Nunn J, Hodges H. Cognitive deficits induced by global cerebral ischaemia: relationship to brain damage and reversal by transplants. Behav Brain Res. 1994;65:1–31. - PubMed
    1. Zhang S, Lachance BB, Moiz B, Jia X. Optimizing Stem Cell Therapy after Ischemic Brain Injury. J Stroke. 2020;22:286–305. - PMC - PubMed

Publication types