. 2022 Mar 28;12(7):3104-3130.
doi: 10.7150/thno.69590. eCollection 2022.

Multi-scale integrative analyses identify THBS2+ cancer-associated fibroblasts as a key orchestrator promoting aggressiveness in early-stage lung adenocarcinoma

Affiliations

Multi-scale integrative analyses identify THBS2+ cancer-associated fibroblasts as a key orchestrator promoting aggressiveness in early-stage lung adenocarcinoma

Haitang Yang et al. Theranostics. .

Abstract

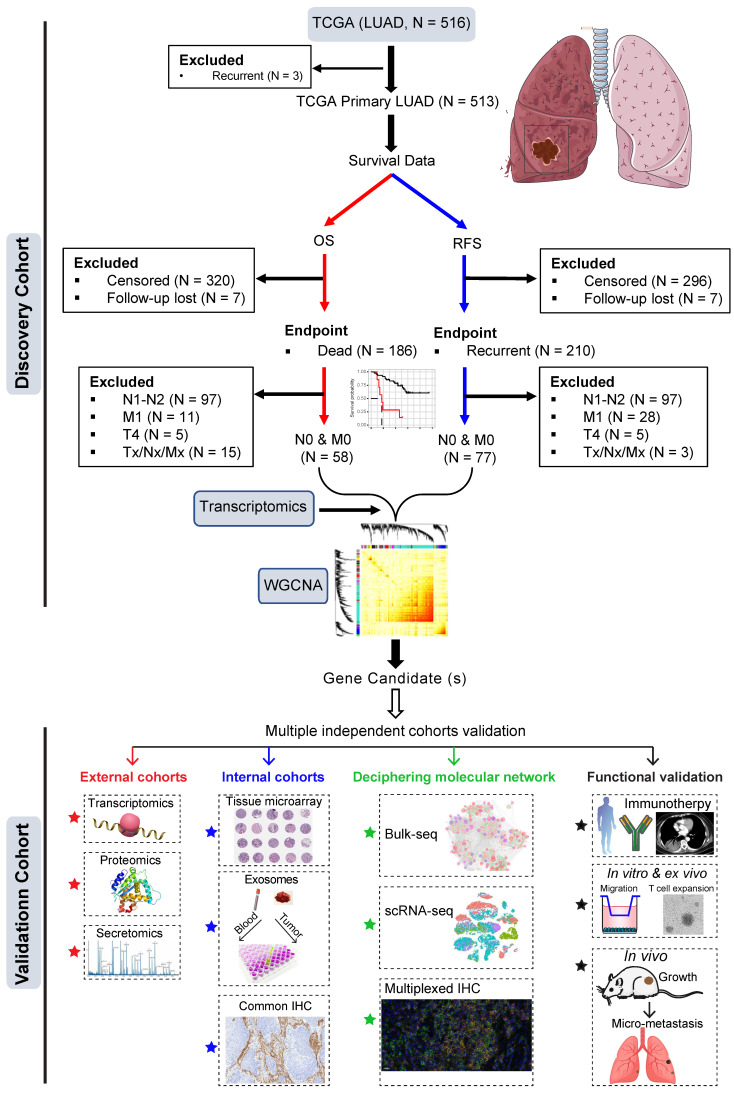
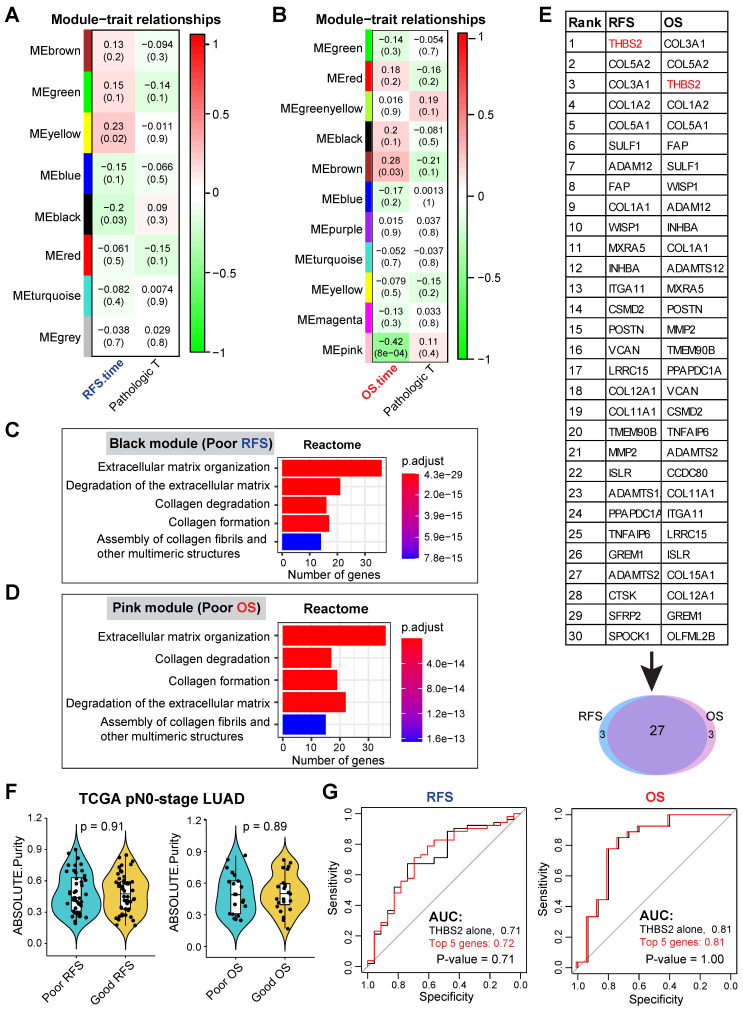
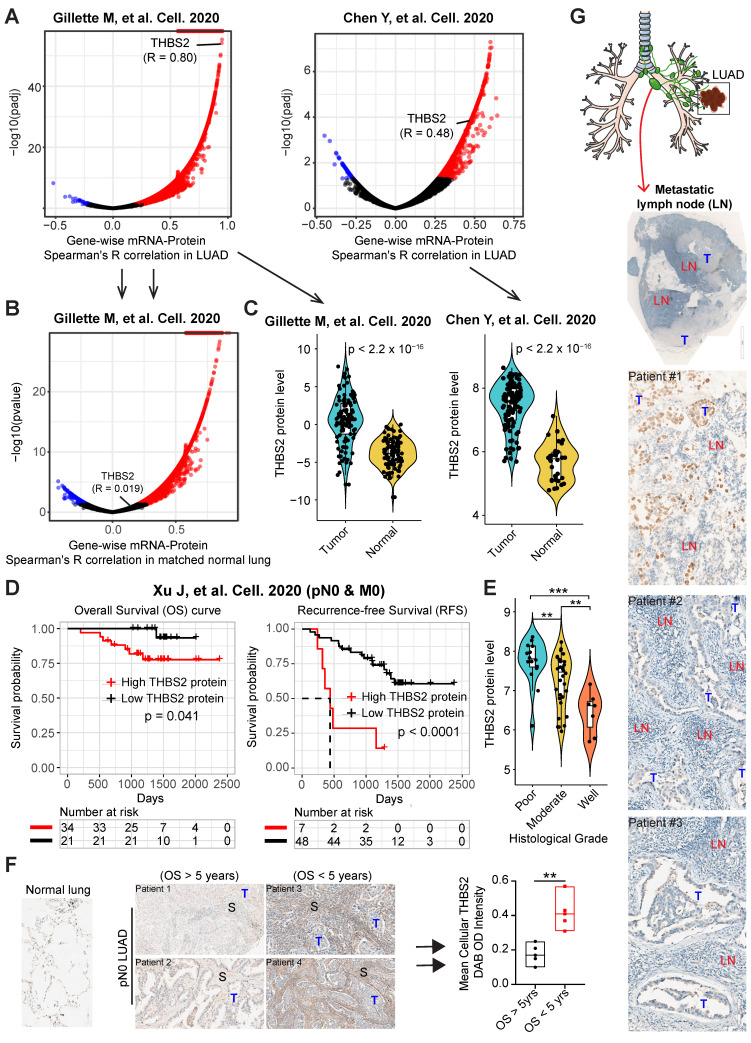
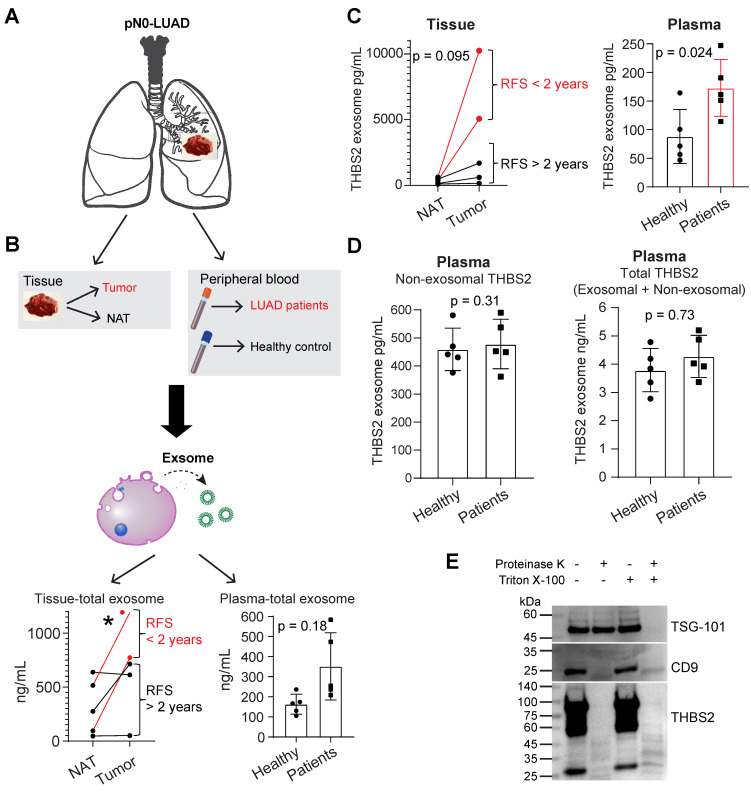
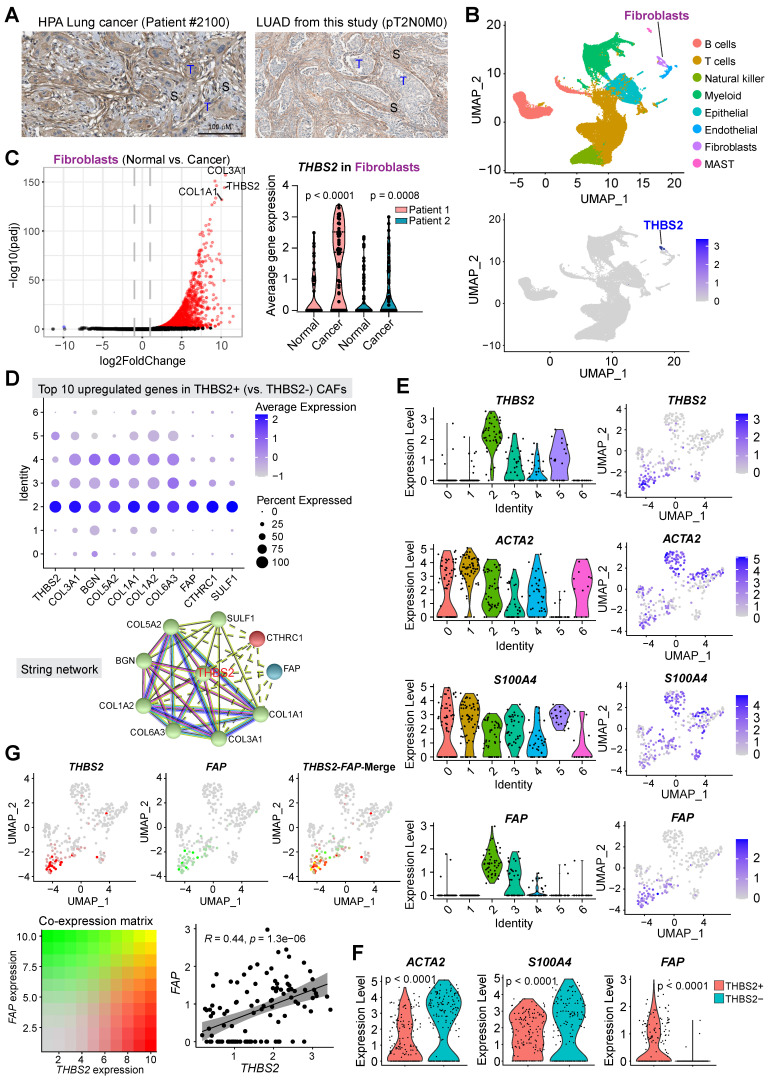
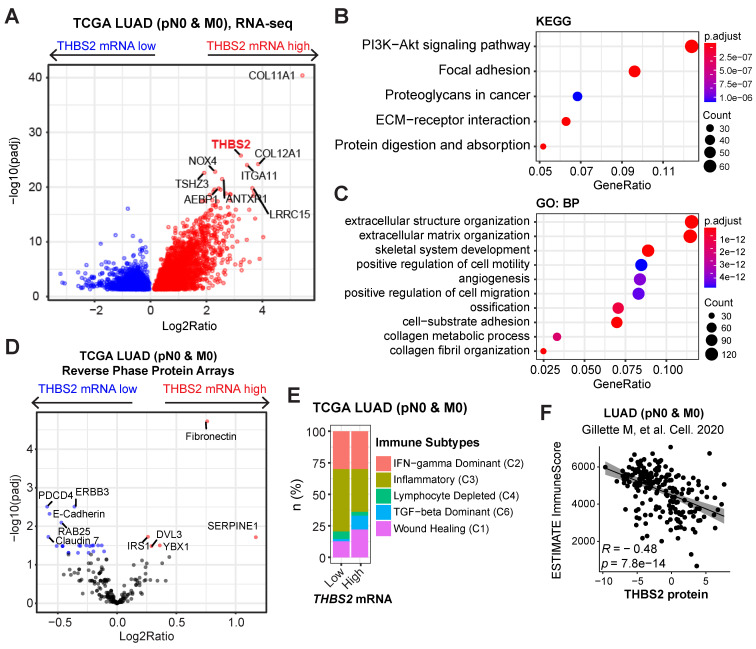
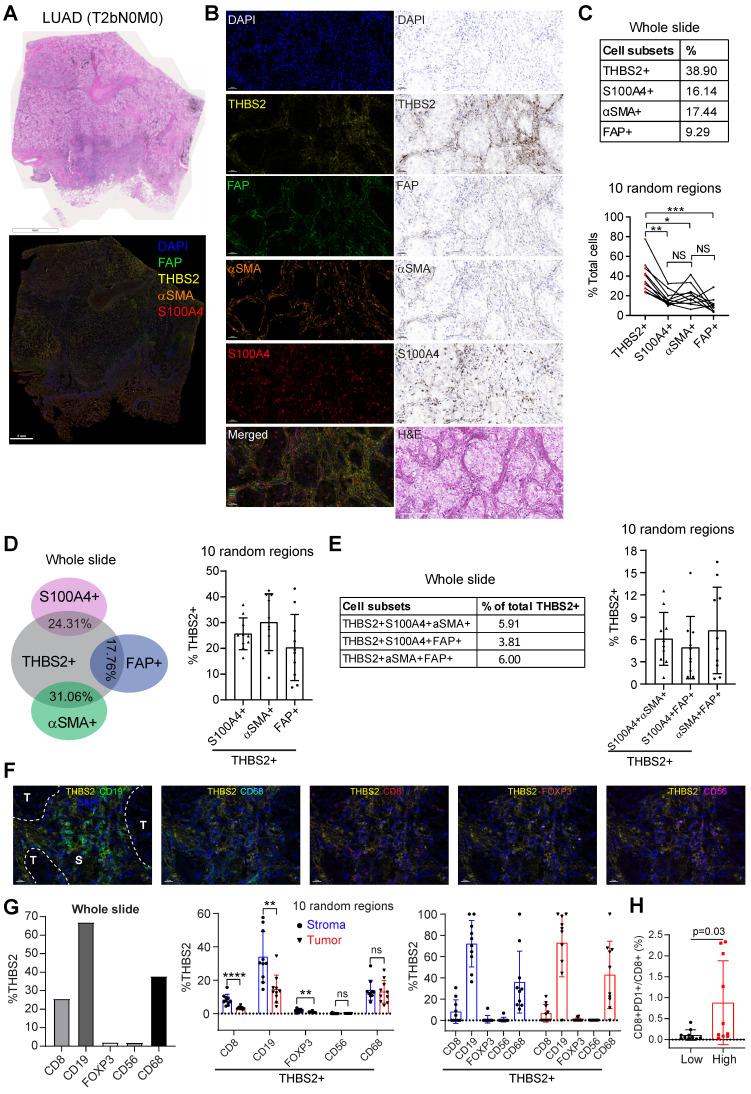
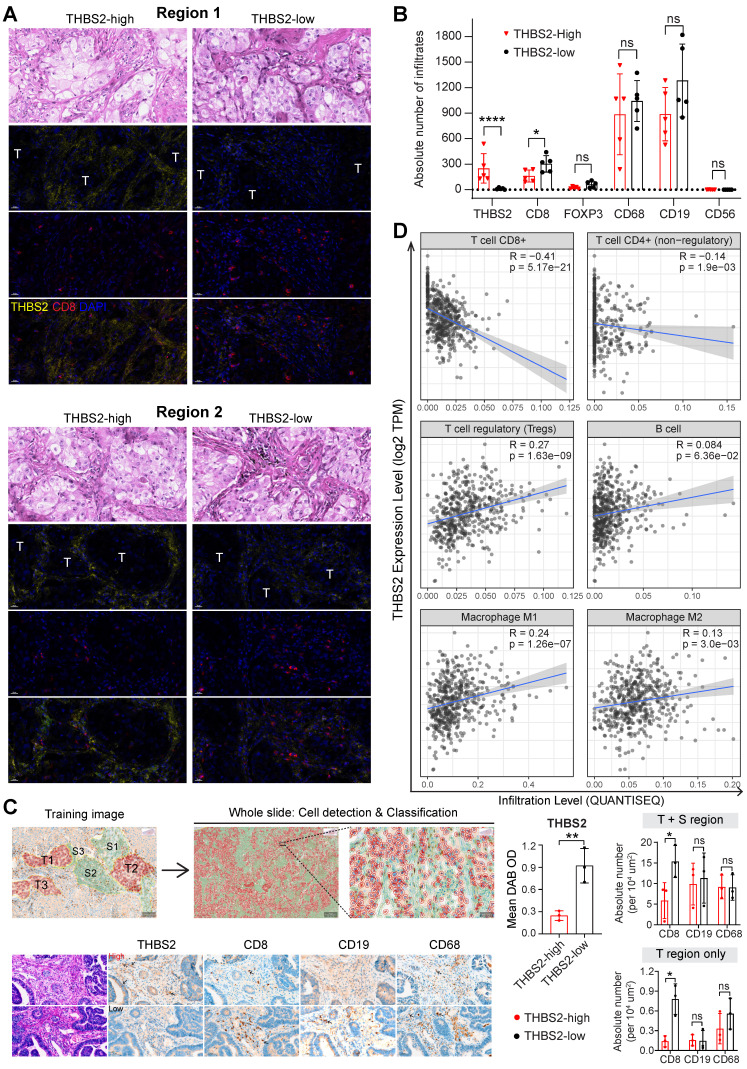
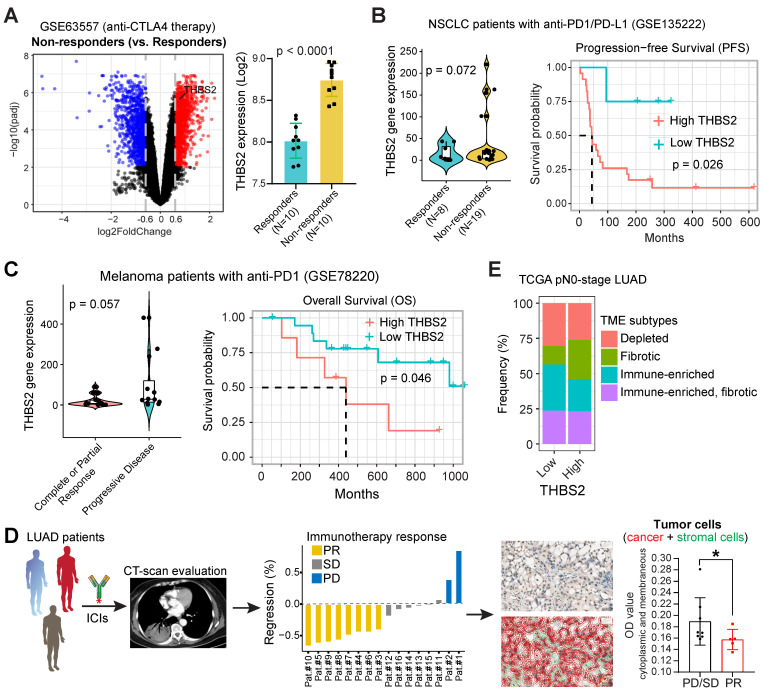
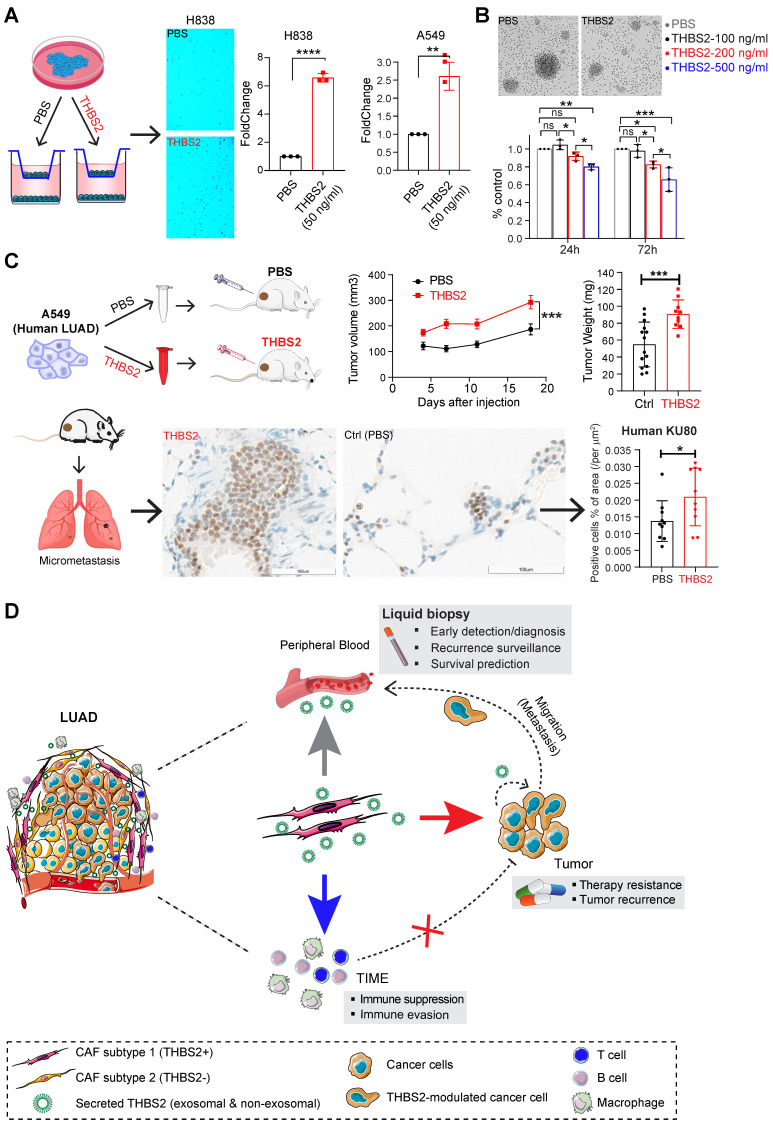
Rationale: Subsets of patients with early-stage lung adenocarcinoma (LUAD) have a poor post-surgical course after curative surgery. However, biomarkers stratifying this high-risk subset and molecular underpinnings underlying the aggressive phenotype remain unclear. Methods: We integrated bulk and single-cell transcriptomics, proteomics, secretome and spatial profiling of clinical early-stage LUAD samples to identify molecular underpinnings that promote the aggressive phenotype. Results: We identified and validated THBS2, at multi-omic levels, as a tumor size-independent biomarker that robustly predicted post-surgical survival in multiple independent clinical cohorts of early-stage LUAD. Furthermore, scRNA-seq data revealed that THBS2 is exclusively derived from a specific cancer-associated fibroblast (CAF) subset that is distinct from CAFs defined by classical markers. Interestingly, our data demonstrated that THBS2 was preferentially secreted via exosomes in early-stage LUAD tumors with high aggressiveness, and its levels in the peripheral plasma associated with short recurrence-free survival. Further characterization showed that THBS2-high early-stage LUAD was characterized by suppressed antitumor immunity. Specifically, beyond tumor cells, THBS2+ CAFs mainly interact with B and CD8+ T lymphocytes as well as macrophages within tumor microenvironment of early-stage LUAD, and THBS2-high LUAD was associated with decreased immune cell infiltrates but increased immune exhaustion marker. Clinically, high THBS2 expression predicted poor response to immunotherapies and short post-treatment survival of patients. Finally, THBS2 recombinant protein suppressed ex vivo T cells proliferation and promoted in vivo LUAD tumor growth and distant micro-metastasis. Conclusions: Our multi-level analyses uncovered tumor-specific THBS2+ CAFs as a key orchestrator promoting aggressiveness in early-stage LUAD.

Keywords: THBS2; cancer-associated fibroblast; early-stage lung adenocarcinoma; exosome; immunotherapy.


Conflict of interest statement

Competing Interests: The authors have declared that no competing interest exists.

Figures

Figure 1
Figure 1
Study design. Early pN0-stage lung adenocarcinoma (LUAD) with complete survival endpoints (recurrence-free survival (RFS) and overall survival (OS) from The Cancer Genome Atlas (TCGA) database) was used as a training cohort. Following this, WGCNA (weighted gene co-expression analysis) analysis is used to identify molecular clusters that correlate with RFS and OS, which were then validated using multiple external and internal resected pN0-stage LUAD cohorts. Finally, the potential molecular networks and biological functions of the candidate molecules were deciphered with multi-dimensional evidence.
Figure 2
Figure 2
WGCNA analysis identifies THBS2 as a candidate biomarker predictive of RFS and OS in early pN0-stage LUAD. A, B, WGCNA analysis. Consensus network modules correlated with RFS and pathological (p) T-stage (tumor size) in the TCGA LUAD (lung adenocarcinoma) cohort using the eigenmodule (the first principal component of the module). Pearson correlation coefficient along with p-value in parentheses underneath; color-coded according to correlation coefficient (legend at right). The blue color indicates a negative correlation, while the red color represents a positive correlation. C, D, Reactome pathway enrichment analyses of genes in black (related to poor RFS; C) and pink (related to poor OS; D) modules. E, Top 30 connected genes in black (negatively correlated with RFS) and pink modules (negatively correlated with OS). Lower panel: Venn plot showing the overlap between RFS- and OS-related top 30 connected genes. F, The difference in tumor purity between pN0-LUAD patients with good and poor overall survival (OS). The ABSOLUTE-algorithm was used for the estimation of tumor purity, which was directly downloaded from the UCSC portal (https://xenabrowser.net/datapages/, TCGA LUAD dataset). P-value was calculated by two-sided student`s t-test. G, Comparison of the difference between the receiver operating characteristic (ROC) curves of two predictive models derived from THBS2 alone and the top 5 genes (THBS2, COL3A1, COL5A2, COL1A2, COL5A1), respectively.
Figure 3
Figure 3
Multiple external and internal validation of THBS2 as a prognostic biomarker. A, B, Genome-wise mRNA-protein correlation (Spearman) analysis in lung adenocarcinoma (LUAD) tumors (A) and matched normal lung tissue (B). The blue color indicates a significantly negative correlation (adjusted p < 0.01), while the red color represents a significantly positive correlation. Data were downloaded and reanalyzed from Gillettle M, et al. Cell. 2020 and Chen Y, et al. Cell. 2020. C, Violin plots showing the protein level of THBS2 in pN0-stage LUAD compared with matched normal lung tissue. D, The association between THBS2 protein levels and OS and RFS in pN0-stage LUAD. Data were downloaded and reanalyzed from Xu J, et al. Cell. 2020. Of note, only one (Xu J, et al. Cell. 2020) but not the other two datasets (Gillette M, et al. Cell. 2020 and Chen Y, et al. Cell. 2020) provided the survival data. However, in the former dataset (Xu J, et al. Cell. 2020), there was no data of the matched normal lung tissue available. As such, we were only able to show the association of THBS2 protein level with survival with the former dataset, whereas comparing the difference in the THBS2 protein level between the pN0-stage LUAD and matched normal lung tissue with the later two datasets. The clinical information could be found in the Supplementary Table 1 of each publication. E, The association between THBS2 protein level and tumoral differentiation state in pN0-stage LUAD. Data were downloaded and reanalyzed from Xu J, et al. Cell. 2020. Of note, the differentiation stage of tumors is a critical histopathological classification of solid tumors, and is strongly associated with tumor behavior. Generally, tumors with poorer differentiation are more aggressive than their more differentiated counterparts. F, Internal immunohistochemistry (IHC) data showing the location of THBS2 expression in the samples from LUAD patients with short and long survival. **p < 0.01 by two-sided Welch`s t-test. Scale bar: 200 μm. G, Representative IHC showing the positive (upper panel: strong staining; middle/lower panel: moderate/weak staining) staining of THBS2 in three LUAD cases with regional lymph node metastasis. Scale bar: 100 μm.
Figure 4
Figure 4
Identifying secreted THBS2 as an exosome protein. A, Exosome isolation, purification and characterization. In A, lung tissue (primary lung adenocarcinoma (LUAD, N = 5); normal adjacent lung (NAT, N = 5)) and blood plasma samples (from LUAD, N = 5; from healthy controls, N = 5) were included. B-D, The quantitation of purified total (B) and THBS2 (C) exosome proteins of lung tissue and plasma samples; P-value (*p < 0.05) was calculated using two-sided paired (left panel) or unpaired (right panel) t-test. (D), The difference in the amount of non-exosomal (left panel) and total (exosomal plus non-exosomal; right panel) THBS2 protein between plasma from LUAD and healthy controls (N = 5 for each group). P-value was calculated using two-sided unpaired t-test. E, Dissecting the specific location of exosomal THBS2 using proteinase K assay. 20 mL plasma of 6 LUAD patients were used to purify exosomes (500 μl; concentration: 1062 ng/μL), and were then incubated in PBS (control), proteinase K alone, Triton X-100, or combined proteinase K plus Triton X-100, respectively. These samples were then subjected to immunoblot. TSG-101, a typical exosomal intra-membrane protein, and CD9, a classical exosomal trans-membrane protein, were used as positive controls. Notably, THBS2 was detected only in the membrane but not inside of the exosomes.
Figure 5
Figure 5
scRNA-seq analysis reveals subsets of CAFs as the major source of THBS2 production. A, Immunohistochemistry/hematoxylin staining showing the expression of THBS2 in LUAD samples from TCGA and this study. Of note, THBS2 was detected in cancer and more predominantly in peritumoral stromal cells. Scale bar: 100 μm. B, UMAP (Uniform Manifold Approximation and Projection) plot showing the expression of THBS2 across different cellular subpopulations from lung tumors (pT1N0M0, N = 2) and matched normal lung tissue (N = 2). Of note, high THBS2 expression was from fibroblasts based on annotation (see Figure S7B). C, Volcano plot (left panel) showing the differentially expressed genes between fibroblasts from lung primary tumors and normal adjacent lung tissue. Of note, THBS2 was listed as the top genes upregulated in from fibroblasts from lung primary tumors, compared with those from matched normal lung tissue. In the right panel, the violin plots showing that THBS2 was upregulated in lung primary tumors compared to normal adjacent lung tissue across two individuals. The significance was determined using two-sided Student's t-test. D, The upper panel showing the top 10 genes of THBS2+ compared with THBS2- CAFs across the 7 CAF subclusters. The lower panel showing the String interaction network of the top 10 genes. In the String network, the interactions were clustered (N = 3; represented by 3 colors) based on kmeans clustering algorithm. E, Violin (left) and UMAP (right) plots showing THBS2, ACTA2, S100A4, or FAP expression across different CAF subclusters. Of note, THBS2 was mainly expressed by cluster 2-, 5-, 3 and 4-annotated CAFs. F, Violin and UMAP plots showing the difference in the expression of ACTA2, S100A4, or FAP between THBS2+ and THBS2- CAFs. P-value calculated by two-sided unpaired t-test. G, UMAP plots showing the co-expression of THBS2 and FAP across individual single CAFs. Red/green dots represent CAFs expressing THBS2+ only/FAP+ only (upper left/middle panels), respectively, and yellow dots indicate CAFs co-expressing THBS2 and FAP only (upper right panel); lower left panel showing the co-expression matrix across CAFs with different expression of FAP and THBS2; lower right panels showing the correlation (Pearson) between THBS2 and FAP across THBS2+ CAFs. (1) Strong correlation: Pearson`s r ≥ 0.8; (2) Moderate: 0.5 ≤ Pearson`s r < 0.8; (3) Weak: 0.3 ≤ Pearson`s r < 0.5; (4) No correlation: Pearson`s r < 0.3). The darker the color, the higher the expression level of the indicated markers. Of note, only a minority of CAFs co-express high THBS2 and FAP.
Figure 6
Figure 6
LUAD tumors with high THBS2 expression are characterized by an enriched ECM/stromal signature and dysregulated tumor immunity. A-C, Pathway enrichment in THBS2-high LUAD compared with THBS2-low LUAD. A, Volcano plot showing the upregulated genes in THBS2-high LUAD. Data were from TCGA pN0-stage LUAD. B, C, KEGG (Kyoto Encyclopedia of Genes and Genomes; B), and GO-BP (Gene Ontology Biological Processes; C) pathway analyses were performed based on A. D, Differentially expressed proteins between THBS2 (mRNA)-high and THBS2-low LUAD based on A. The blue color indicates the significantly downregulated proteins (adjusted p < 0.01), while the red color represents the significantly upregulated proteins in THBS2-high LUAD. Data were downloaded and reanalyzed from the TCGA LUAD RPPA (reversed-phase protein array) dataset (see the details in Methods). E, Difference in the distribution of immune subtypes (C1-C6) between THBS2-high and THBS2-low LUAD based on A. The genes contained in each signature were evaluated using model-based clustering by p the “mclust” R package. Each sample was finally grouped based on its predominance with the C1-C6 signature. The immune subtype models were based on Thorsson V et al. Immunity. 2018 (See the methods). F, The correlation between the antitumor immune score and THBS2 protein level across pN0-stage LUAD. Data of antitumor immune score and THBS2 protein level were downloaded and reanalyzed from the Supplementary Tables published in Gillettle M, et al. Cell. 2020.
Figure 7
Figure 7
Multiplexed IHC shows the spatial association between THBS2 and typical CAF markers in LUAD. A, B, THBS2 co-staining with three classical CAF markers (αSMA, FAP, S100A4 [FSP1]) in a resected LUAD (lung adenocarcinoma) (pT2bN0M0) sample. The image acquisition of all markers occurred simultaneously. Panel A shows the whole slide scan; panel B shows the representative regions (200x). Scale bar: 50 μm. C-E, Individual or selected combinations of THBS2 and three classical CAF markers (αSMA, FAP, S100A4 [FSP1]) markers (whole slide and 10 randomly selected regions) were quantified and shown. Single-staining (THBS2, αSMA, FAP, or S100A4; C), double-staining (THBS2/αSMA, THBS2/FAP, or THBS2/S100A4; D), triple-staining (THBS2/αSMA/ FAP, THBS2/FAP/S100A4, or THBS2/αSMA/S100A4; E) were quantified by using HALO® software (Please see the detailed description in the Methods section “Image acquisition and data quantification”). *p < 0.05; **p < 0.01; ****p < 0.0001 by paired ANOVA test. F, G, Indicated combinations markers (whole slide [left] and 10 randomly selected [under 50x magnification] regions [middle and right]) were quantified and shown. The upper panel (F) showed the representative regions (400x). In tumor and stromal compartments within the 10 different regions, the expression of indicated markers was quantified and compared, respectively. **p < 0.01; ****p < 0.0001 by two-sided student`s t-test. Scale bar: 20 μm. H, Ratio of CD8+PD1+ to total CD8+ T cells in 10 randomly (5 tumoral and 5 stromal regions) selected regions of a LUAD tumor from A (related to Figure S15C). We performed multiplexed IHC with CD4, CD8, CD19 and PD-1 (5-Color Multiple IHC Kit) from a serial slide of the same tumor as Figure 7A-G. p-value was calculated using paired student`s t-test.
Figure 8
Figure 8
The association between THBS2 expression and immune infiltrates in LUAD. A, B, Panel A showing the representative images of THBS2 co-staining with CD8 T lymphocytes in two regions (THBS2-high and -low) of a resected LUAD (lung adenocarcinoma) (pT2bN0M0) sample. The image acquisition of all markers occurred simultaneously with the representative regions were shown (200x). Panel B showing the quantification (absolute number of the indicated positive cells) of 5 random regions (under 50x). The quantification of THBS2 level in the first barplot was shown to confirm the difference in the expression of THBS2 between THBS2-high and -low groups *p < 0.05; ****p < 0.0001 by two-sided student`s t-test. ns, not significant. Scale bar: 20 μm. C, An independent pN0-stage LUAD cohort (N = 6) was used to compare the difference in immune cell infiltrates between THBS2-high (N = 3) and -low (N = 3) groups. Left upper panels showing the tumor (T, in red) and stromal (S, in blue) cells (100X), which were used for training to recognize the differential features between tumor and stromal cells (using QuPath software, version 0.3.2). Then the established unique parameters of tumor and stromal cells were applied to the entire slide (left lower). Left lower panels showing the representative IHC images (200x, left). The right panels showing the quantifications of the indicated protein markers. *p < 0.05; **p < 0.01 by two-sided student`s t-test. ns, not significant. Scale bar: 50 μm. D, Correlation between THBS2 expression and immune infiltrates across p-N0 stage LUAD from TCGA cohort.
Figure 9
Figure 9
THBS2 expression effectively predicts the response to immunotherapy in clinical patients. A, Differentially expressed genes between the tumors that respond and do not respond to anti-CTLA4 immunotherapy. A barplot was shown to the right specifically illustrating the difference between the responders and non-responders. Of note, THBS2 was significantly highly expressed in tumors that did not respond to anti-CTLA4 immunotherapy. Data were downloaded and reanalyzed from the GSE63557 dataset. B, C, External cohorts validating the association between THBS2 expression in pretreated tumor samples and anti-PD1/PD-L1 therapy from non-small cell lung cancer (NSCLC) (GSE135222; B) and melanoma (GSE78220; C) cohorts. The left panel showed the difference in THBS2 expression between the responders and non-responders; the right panel shows the association of THBS2 in pretreated samples with PFS of patients in this cohort. In the melanoma cohort, the data of patient 16 were excluded because of the on-treatment biopsy. Of note, in the left panel of B, the dashed line was used to highlight that in this studied cohort, the tumors whose baseline expression of THBS2 > 50 all belong to the non-responders group. However, in the right panel, the THBS2 expression in the survival plot was grouped based on the optimal cutoff value determined by R software (see the Methods), but not the dashed line. Likewise, a similar group strategy was used in the two panels of Figure 9C. D, The workflow showing the evaluation of responses to immune checkpoint inhibitors (ICIs) in LUAD patients. After at least two cycles of ICIs, the therapeutic response was evaluated by using computed tomography (CT) scans based on the guideline of RECIST 1.1 (see the Methods). Immunohistochemistry-based quantifications (using Qupath software, see the methods) showing the association between THBS2 expression in pretreated LUAD biopsies and therapeutic response to anti-PD1 immunotherapy. PR: partial response; SD: stable disease; PD: progressed disease. Of note, we acquired a total of 16 patients` samples (middle panel), of which, 3 samples from the PR group could not be evaluated due to the small size and poor quality of the biopsies. As a result, we could not collect the quantification data from these 3 samples, and only 13 samples were finally included for analysis. Scale bar: 20 μm. E, Difference in the distribution of the tumor microenvironment signature (from Bagaev A, et al. Cancer Cell. 2021) between THBS2-high and THBS2-low tumors based on pN0M0-stage TCGA LUAD.
Figure 10
Figure 10
THBS2 plays a pleiotropic role in modulating cancer cells and immune cells. A, In vitro Transwell assays showing the effect of THBS2 on the migration of human A549 and H838 LUAD (lung adenocarcinoma) cells. Representative images (10x) of H838-Transwell assays were shown in the middle. ****p < 0.0001 by two-sided student`s t-test. B, Ex vivo T cell proliferation assay showing the effect of THBS2 (96h) on the proliferation of activated CD3+ T cells. The representative image on the top is under the treatment 500 ng/mL THBS2 recombinant protein. C, In vivo LUAD xenografts showing the effect of THBS2 on subcutaneous tumor growth (upper panel) and micro-metastasis to the lung (lower panel), with the quantifications shown to the right. Human-specific KU80 antibody was used to detect human-derived A549 LUAD cells. To make the analysis comparable, the number of positive cells was normalized to the scanned area (per μm2). ***p < 0.001 by two-way ANOVA test (tumor volume). **p < 0.01; ***p < 0.001 by two-sided student`s t-test. D, A hypothetical model illustrating the pleiotropic roles of THBS2 in the micro-ecosystem of LUAD. 1) Secreted THBS2 can be detected in peripheral blood, thus as a promising liquid biomarker; 2) THBS2 promotes tumor recurrence/metastasis/treatment resistance; 3) THBS2 promotes an immune-suppressive microenvironment by interacting with immune cells, thereby facilitating the immune escape of LUAD tumor cells. Figures were created with BioRender.com. TIME: tumor immune microenvironment. CAF: cancer-associated fibroblasts.

Similar articles

Cited by

References

    1. de Koning HJ, van der Aalst CM, de Jong PA, Scholten ET, Nackaerts K, Heuvelmans MA. et al. Reduced Lung-Cancer Mortality with Volume CT Screening in a Randomized Trial. N Engl J Med. 2020;382:503–13. - PubMed
    1. Zhang J, Wu J, Tan Q, Zhu L, Gao W. Why do pathological stage IA lung adenocarcinomas vary from prognosis?: a clinicopathologic study of 176 patients with pathological stage IA lung adenocarcinoma based on the IASLC/ATS/ERS classification. J Thorac Oncol. 2013;8:1196–202. - PubMed
    1. Yoshizawa A, Motoi N, Riely GJ, Sima CS, Gerald WL, Kris MG. et al. Impact of proposed IASLC/ATS/ERS classification of lung adenocarcinoma: prognostic subgroups and implications for further revision of staging based on analysis of 514 stage I cases. Mod Pathol. 2011;24:653–64. - PubMed
    1. Hung JJ, Yeh YC, Jeng WJ, Wu KJ, Huang BS, Wu YC. et al. Predictive value of the international association for the study of lung cancer/American Thoracic Society/European Respiratory Society classification of lung adenocarcinoma in tumor recurrence and patient survival. J Clin Oncol. 2014;32:2357–64. - PubMed
    1. Lopez Guerra JL, Gomez DR, Lin SH, Levy LB, Zhuang Y, Komaki R. et al. Risk factors for local and regional recurrence in patients with resected N0-N1 non-small-cell lung cancer, with implications for patient selection for adjuvant radiation therapy. Ann Oncol. 2013;24:67–74. - PMC - PubMed

Publication types

MeSH terms

Substances