Review
. 2022 Apr 11;12(7):3345-3371.
doi: 10.7150/thno.71359. eCollection 2022.

Activatable NIR-II organic fluorescent probes for bioimaging

Affiliations
Review

Activatable NIR-II organic fluorescent probes for bioimaging

Xiaoning Zhang et al. Theranostics. .

Abstract

NIR-II imaging is developed rapidly for noninvasive deep tissue inspection with high spatio-temporal resolution, taking advantage of diminished autofluorescence and light attenuation. Activatable NIR-II fluorescence probes are widely developed to report pathological changes with accurate targeting, among which organic fluorescent probes achieve significant progress. Furthermore, the activatable NIR-II fluorescent probes exhibited appealing characteristics like tunable physicochemical and optical properties, easy processability, and excellent biocompatibility. In the present review, we highlight the advances of activatable NIR-II fluorescence probes in design, synthesis and applications for imaging pathological changes like reactive oxygen species (ROS), reactive nitrogen species (RNS), reactive sulfur species (RSS), pH, hypoxia, viscosity as well as abnormally expressed enzymes. This non-invasive optical imaging modality shows a promising prospect in targeting the pathological site and is envisioned for potential clinical translation.

Keywords: NIR-II fluorescence; bioimaging; organic fluorescent probes; pathological changes; responsive probes.


Conflict of interest statement

Competing Interests: The authors have declared that no competing interest exists.

Figures
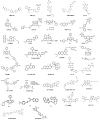
Figure 1
Figure 1
The representative activatable NIR-II organic fluorescent probes. Detecting ROS (probes 1-13), RNS (probes 14-19), RSS (probes 20-24), pH (probes 25-29), viscosity (probes 30-32), enzymes (probes 33-36).
Figure 2
Figure 2
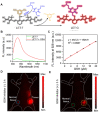
Activatable NIR-II probes for ClO-. (A) The structure and detection mechanism of SPNP25 for ClO- by blending the hydrophobic donor PDF and acceptor ITTC. (B) Fluorescence spectra of the nanoprobe SPNP25 treated with ClO- (0-40 µM). (C) Plots of the linear relationship between fluorescence intensity and concentrations of ClO-. (D) Real-time NIR-II fluorescence images of SPNP25 in LPS-pretreated and LPS/NAC-treated mice (Excitation: 808 nm laser, 40 mW cm-2). (E) Corresponding fluorescence intensity of the region of interest after administration of SPNP25. (F) The NIR-II fluorescence intensity enhancement of the ratio in different regions of interest. Figures adapted with permission from . Copyright © 2018, John Wiley and Sons.
Figure 3
Figure 3
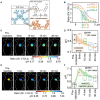
Activatable NIR-II probes for •OH. (A) The structure and detection mechanism of Hydro-1080 for •OH. (B) NIR-II fluorescence spectra of Hydro-1080 treated with •OH (0.01-1.6 µM) under 980 nm excitation. (C) Plots of the linear relationship between fluorescence intensity at 1044 nm and concentrations of •OH in the range of 10-200 and 200-1000 nM. (D) NIR-II fluorescence images of mice injected with saline and LPS and intravenously injected with Hydro-1080 after 24 h. (E) NIR-II and NIR-IIa fluorescence images of mice injected with 0, 300, 500, 500 mg/kg APAP, respectively, and then intravenously injected with Hydro-1080. The last group is pretreated with inhibitor ABT. Figures adapted with permission from . Copyright © 2019 American Chemical Society.
Figure 4
Figure 4
Activatable NIR-II probes for H2O2. (A) The structure of HP-H2O2 for detecting H2O2. (B) Fluorescence spectra of HP-H2O2 (10 µM) upon addition of ONOO- (0-100 µM). (C) Real-time NIR-II fluorescence imaging of healthy mice and ALI mice after intratracheal instillation of HP-H2O2 (Excitation: 808 nm laser, 40 mW cm-2). (D) Mean NIR-II fluorescence intensities of regions of interest in (C). (E) Real-time NIR-II fluorescence imaging of healthy mice and AKI mice after intravenous administration of HP-H2O2 (Excitation: 808 nm laser, 40 mW cm-2). (F) Mean NIR-II fluorescence intensities of regions of interest in (E). Figures adapted with permission from . Copyright © 2022, Royal Society of Chemistry.
Figure 5
Figure 5
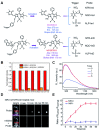
Activatable NIR-II probes for ONOO-. (A) The structure and mechanism of IRBTP-B. (B) Fluorescence spectra of IRBTP-B (10 µM) treated with ONOO- (0-11 µM). (C) Plots of the linear relationship between fluorescence intensity at 950 nm and concentrations of ONOO-. (D) Real-time NIR-II fluorescence imaging of livers of mice from IRBTP-B treated with PBS, APAP, and NAC + APAP respectively. (E) Relative fluorescence intensity of livers of mice treated with various substances followed by IRBTP-B over time. (F) The synthesis of CX dyes. (G) Corresponding absorption (solid) and emission (dot) spectra of CX dyes. (H) The structure and mechanism of IRBTP-O, which is constructed by loading CX-1 and CX-3 into a micelle. (I) Fluorescence spectra of PN1100 in the presence of ONOO-. (J) The ratio of F920/F1130 (fluorescence intensity at 920 nm and 1130 nm, respectively) of PN1100 upon addition with OONO- (0-24 µm). (K) The ratio of F950/F1100 of the livers of mice treated with PBS, APAP, and NAC + APAP respectively, followed by PN1100 over time. Figures adapted with permission from , . Copyright © 2019, American Chemical Society, and Copyright © 2019, John Wiley and Sons.
Figure 6
Figure 6
Activatable NIR-II probes for NO. (A) The structure and mechanism of AOSNP. (B) Fluorescence spectra of the AOSNP (3 µg mL-1) treated with various concentrations of NO. Insets show photographs of the AOSNP i before and ii after the addition of NO. (C) Plots of the linear relationship between fluorescence intensity (F/F0, 1000-1700 nm) and intensity and concentrations of NO (0-35 µM). (D) In vivo images of dose-dependent hepatotoxicity in mice given APAP. Representative images of the control mice treated with PBS or APAP (0 mg kg-1), representative images of mice at various time points after receiving AOSNP (100 µL, 10 mg mL-1) pre-treated with 300 mg kg-1 APAP, 600 mg kg-1 APAP, 300 mg kg-1 NAC followed by 600 mg kg-1 APAP. Figures adapted with permission from . Copyright © 1996, Royal Society of Chemistry.
Figure 7
Figure 7
Activatable NIR-II probes for H2S. (A) The fabrication and activation process of probe NIR-II@Si for H2S, based on trapping ZX-NIR and aza-BOD into the hydrophobic interior of self-assembled micellar aggregates. (B) NIR-II emission spectra of NIR-II@Si (10 µm ZX‐NIR) in the presence of 100 µm NaHS over time, λex = 780 nm. Insets show photographs of the NIR-II@Si before and after the addition of NaHS. (C) Real-time images of cancers after subcutaneously injecting the NIR-II@Si (20 nmol ZX-NIR) into the tumor regions of HCT116 tumor-bearing mice. (D) The fabrication and activation process of Nano-PT, which is based on the self-assembly of an H2S-responsive small molecule capable of excellent photothermal conversion efficiency. (E) Time-dependent NIR-II emission spectra of Nano-PT (20 µM SSS) treated with 100 µM NaHS, λex = 790 nm. Inset shows photographs of the H2S-activated NIR-II emission. (F) Ratio of tumor weight of HCT116 tumor-bearing mice in different groups relative to that in untreated mice and photographs of tumor tissues. (G) The structure of WH, based on BODIPY skeleton and 4-Nitrothiophenol for specific recognition site. (H) NIR-II fluorescence spectra of WH-3 in the presence of NaHS (1-110 µM). Inset shows photographs of the NIR-II emission activated by varying NaHS. (I) Relative fluorescence intensity of different-sized tumor mice treated with the WH-3. Figures adapted with permission from , , . Copyright © 2018, John Wiley and Sons, Copyright © 2018, and Copyright © 2021, American Chemical Society.
Figure 8
Figure 8
Activatable NIR-II probes for GSH. (A) The structure and mechanism of LET-7. (B) The fluorescence spectra of the LET-7 with or without GSH. (C) The plot of the linear relationship between fluorescence intensity at 928 nm and concentrations of GSH. NIR-II images of tumor-bearing mice, 3 h after administration of LET-7 without (D) and with (E) GSH inhibitor treatment. Figures adapted with permission from . Copyright © 2021 American Chemical Society.
Figure 9
Figure 9
Activatable NIR-II probes for pH. (A) The structure and detection mechanism of BTC1070 for pH. (B) The fluorescence spectra at various pH values under the excitation of 808 nm. (C) Plot of fluorescence ratio changes as a function of pH values. Ratio = F1000LP/F900LP, F1000LP and F900LP denote the integrated intensity at 1000-1300 nm and 900-1300 nm, respectively. (D-F) Left: digital photographs of mice and dissected stomach. Right: fluorescence images and corresponding ratiometric fluorescence images of mice stomachs at two different pH environments. (G) The structure and detection mechenisem of NIRII-RT-pH. (H) The fluorescence spectra of NIRII-RT-pH at various pH values. Figures adapted with permission from , . Copyright © 2019, Springer Nature, and Copyright © 2020, John Wiley and Sons.
Figure 10
Figure 10
Activatable NIR-II probes for pH. (A) The structure and detection mechanism of pTAS. (B) Fluorescence intensity ratio (F940 nm/ F1026 nm) of four pTAS as a function of pH. The ratiometric fluorescence images of tumors during the two pH changing processes after administration of pTAS-2 (C) and pTAS-3 (E), respectively. (D) and (F): Corresponding comparison of the pH changing in two processes by ratiometric fluorescence imaging and microelectrode pH meter. Figures adapted with permission from. Copyright © 2021, John Wiley and Sons.
Figure 11
Figure 11
Activatable NIR-II probes for various hypoxia. (A) Probing hypoxia using IR1048-MZ conjugating a nitroimidazole group with an IR-1048 dye. (B) Fluorescence emission spectra (λex/λem = 980/1046 nm) in the absence and presence of NTR. (C) NIR-II fluorescence responses of IR1048-MZ (5 µg/mL) to different concentrations of NTR. Inset shows a linear correlation between emission intensity and concentration of NTR. (D) NIR-II fluorescence imaging of tumors in living mice at the highest-signal time. Figures adapted with permission from . Copyright © 2018, Ivyspring International.
Figure 12
Figure 12
Activatable NIR-II probes for viscosity. (A) The structure of WD-X and its mechanism for detecting viscosity, which is based on BODIPY skeleton binding with electron-drawing (nitro) or electron-donating groups. (B) Fluorescence spectra of WD-NO2 (20 µM) in various ethanol-glycerol mixture. Inset shows corresponding fluorescence images of WD-NO2. (C) The linear relationship between the logarithmic fluorescence intensity of WD-NO2 at 982 nm and log η. (D) Fluorescence imaging of viscosity changes by exogenous drug stimulation. Mice were only intraperitoneally injected with WD-NO2. Mice were intraperitoneally injected with Mon, Nys, and LPS accompanied with intraperitoneal injection of WD-NO2, respectively. (E) Corresponding fluorescence intensity of mice (Excitation: 808 nm laser, 50 mW cm-2). Figures adapted with permission from . Copyright © 2020, American Chemical Society.
Figure 13
Figure 13
Activatable NIR-II probes for NTR. (A) Detection mechanism of the probe for NTR, NQO1, or ALP by conjugating BODIPY with enzymic substrates via a self-immolative benzyl thioether linker. (B) Enzymes-induced the fluorescence intensity changes of probes in the absence or presence of inhibitors. (C) NIR-II fluorescence spectra of NTR-InD upon addition of NTR (20 µg mL-1) in buffer. (D) Time-dependent NIR-II imaging of mice injected with NTR-InD (30 nmol) or NTR-InD + dicoumarol (0.3 mmol). (E) The fluorescence intensity of the tumor in NIR-I imaging and NIR-II imaging via the region of interest analysis. Figures adapted with permission from . Copyright © 2010, Royal Society of Chemistry.
Figure 14
Figure 14
Activatable NIR-II probes for NTR. (A) The structure and mechanism of RHC-NO2 for NTR. (B) The fluorescence spectra of RHC-NO2 with and without NTR. (C) The linear fitting plot of ΔF against the concentration of NTR. (D) NIR-II images of A549 tumor-bearing mice after injection of RHC-NO2. (E) Quantified fluorescence intensity of dissected organs and the tumor. Figures adapted with permission from . Copyright © 2021, Royal Society of Chemistry.
Figure 15
Figure 15
Activatable NIR-II probes for NAG. (A) Illustration of structure and inspection mechanism of BOD-II-NAG for NAG, based on BODIPY skeleton conjugated with N-acetyl-β-d-glucosamine residues. (B) Fluorescence spectral changes of and BOD-II-NAG (10 µM) with increasing concentration of NAG with 30 min incubation at 37 °C. (C) Plots of the linear relationship between fluorescence intensity at 1000 nm and concentrations of NAG. (D) Real-time NIR-II fluorescence imaging of the control group, the AKI group, and the inhibitor group mice after intravenous injection of BOD-II-NAG-NP (16 µM/kg body weight). (E) Corresponding real-time NIR-II fluorescence intensities of kidneys and (F) quantitative results. (G) Real-time NIR-II fluorescence imaging of with or without diabetic nephropathy mice after intravenous injection of BOD-II-NAG-NP. (H) Corresponding real-time NIR-II fluorescence intensities of kidneys. Figures adapted with permission from . Copyright © 2021, American Chemical Society.
Figure 16
Figure 16
Activatable NIR-II probes for hyaluronidase and thiols. (A) Fabrication of HISSNPs and the response process for Hyaluronidase and Thiols, which is based on the crosslink of IR-1061-pendent HA polymers (HINPs) and disulfide. (B) DLS changes of and HISNPs in the absence or presence of Hyal and/or GSH. (C) Time-dependent fluorescence spectra of Hyal (0.1 mg mL-1) and GSH (1 × 10⁻³ M) in PBS (pH = 7.4) at 37 °C excited at 808 nm. (D) Real-time NIR-II fluorescence imaging of cancer mice injected with HISSNPs and HINPs. The white circle indicates the tumor site. The yellow circle indicates the abdominal liver site. The muscle in the green circle corresponds to the normal tissue region used to calculate the T/NT ratio. (E) Corresponding quantitative T/NT ratio in tumor mice at 24 h post-injection of HISSNPs and HINPs. Figures adapted with permission from . Copyright © 2018, John Wiley and Sons.
Figure 17
Figure 17
Activatable NIR-II probes for NO and H2S. (A) The structure of BOD-NH-SC and the response process on NO and H2S. (B) Time-dependent fluorescence spectra of BOD-NH-SC (5 µM) in the presence of H2S (100 µM). (C) Fluorescence spectra varying with cycled S-nitrosation and transnitrosation processes. Imaging in NIR-II fluorescence channel of (D) HepG2 and (E) colonic smooth muscle cells in the alternating presence of NO and H2S. Figures adapted with permission from . Copyright © 2021. John Wiley and Sons.
Figure 18
Figure 18
Activatable NIR-II probes for ROS/RNS and base. (A) The structure of PN910 and its detection mechanism for ROS/RNS and base. Time-dependent fluorescence intensity at 910 nm of PN910 (10 µM) with different pH values in the presence of (B) H2O2 and (C) ONOO-. Emission changes of PN910 in the presence of different concentrations of (D) H2O2 and (E) ONOO-. (F) Real-time imaging of colitis mice and healthy mice (Excitation: 808 nm laser, 30 mW cm-2) and (I) corresponding fluorescence intensity in the interest region. (G) Real-time imaging of normal mice and cystitis mice (Excitation: 808 nm laser, 30 mW cm-2) and (H) corresponding time-dependent fluorescence intensity of bladder. Figures adapted with permission from . Copyright © 2018, John Wiley and Sons.

Similar articles

Cited by

References

    1. Liu P, Mu X, Zhang X, Ming D. The near-infrared-II fluorophores and advanced microscopy technologies development and application in bioimaging. Bioconjug Chem. 2020;31:260–275. - PubMed
    1. Yang Q, Ma H, Liang Y, Dai H. Rational design of brightness NIR-II organic dyes with S-D-A-D-S structure. Acc Mater Res. 2021;2:170–83.
    1. Wang F, Ren F, Ma Z, Qu L, Gourgues R, Xu C. et al. Non-invasive confocal fluorescence imaging of mice beyond 1700 nm using superconducting nanowire single-photon detectors. bioRxiv. 2021 doi: 10.1101/2021.08.13.456312. - PMC - PubMed
    1. Dai H, Ma Z, Wang F, Zhong Y, Salazar F, Li J. et al. Advancing nanomedicine with cross-link functionalized nanoparticles for rapid excretion. Angew Chem Int Ed Engl. 2020;59:1109–43. - PubMed
    1. Zhu S, Tian R, Antaris AL, Chen X, Dai H. Near-infrared-II molecular dyes for cancer imaging and surgery. Adv Mater. 2019;31:1900321. - PMC - PubMed

Publication types