. 2022 Apr 24;12(7):3518-3533.
doi: 10.7150/thno.72581. eCollection 2022.

mTOR regulates aerobic glycolysis through NEAT1 and nuclear paraspeckle-mediated mechanism in hepatocellular carcinoma

Affiliations

mTOR regulates aerobic glycolysis through NEAT1 and nuclear paraspeckle-mediated mechanism in hepatocellular carcinoma

Hong Zhang et al. Theranostics. .

Abstract

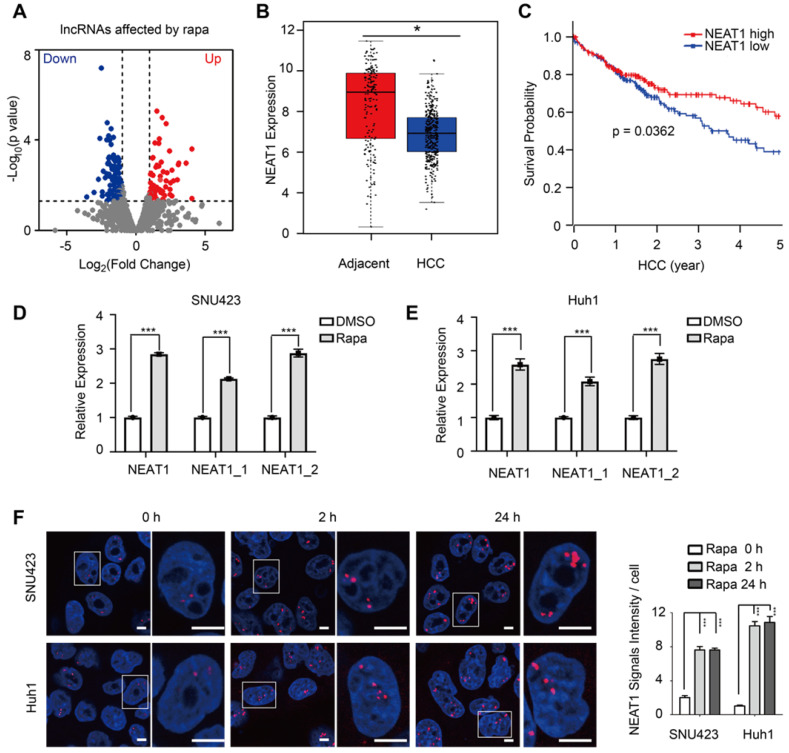
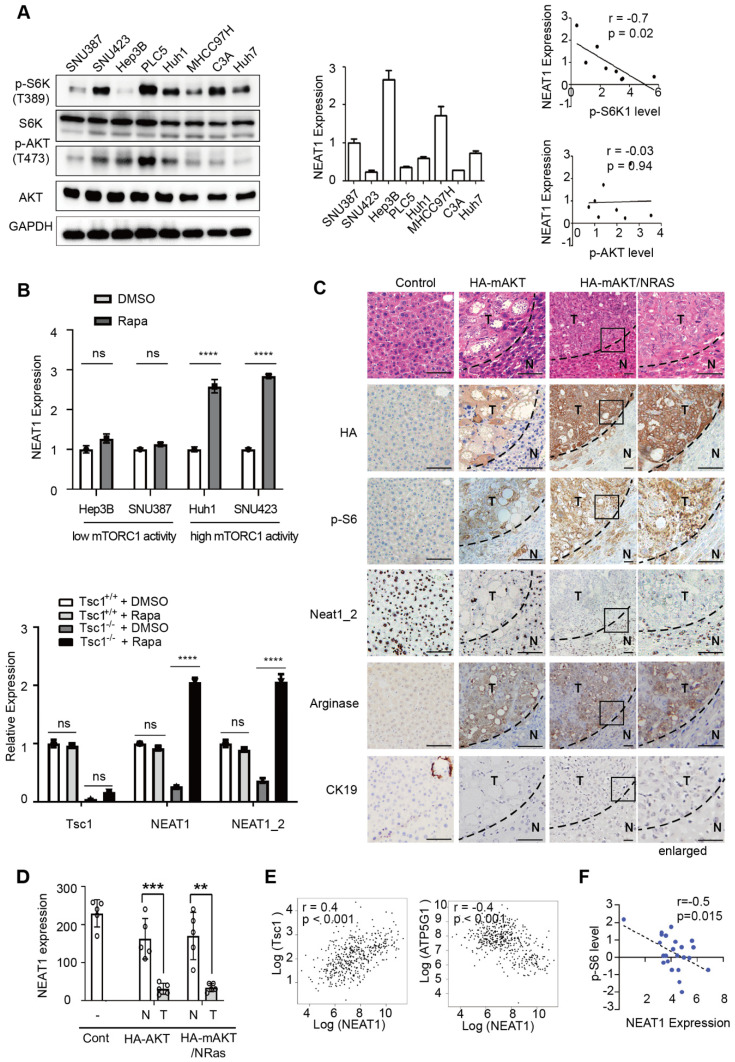
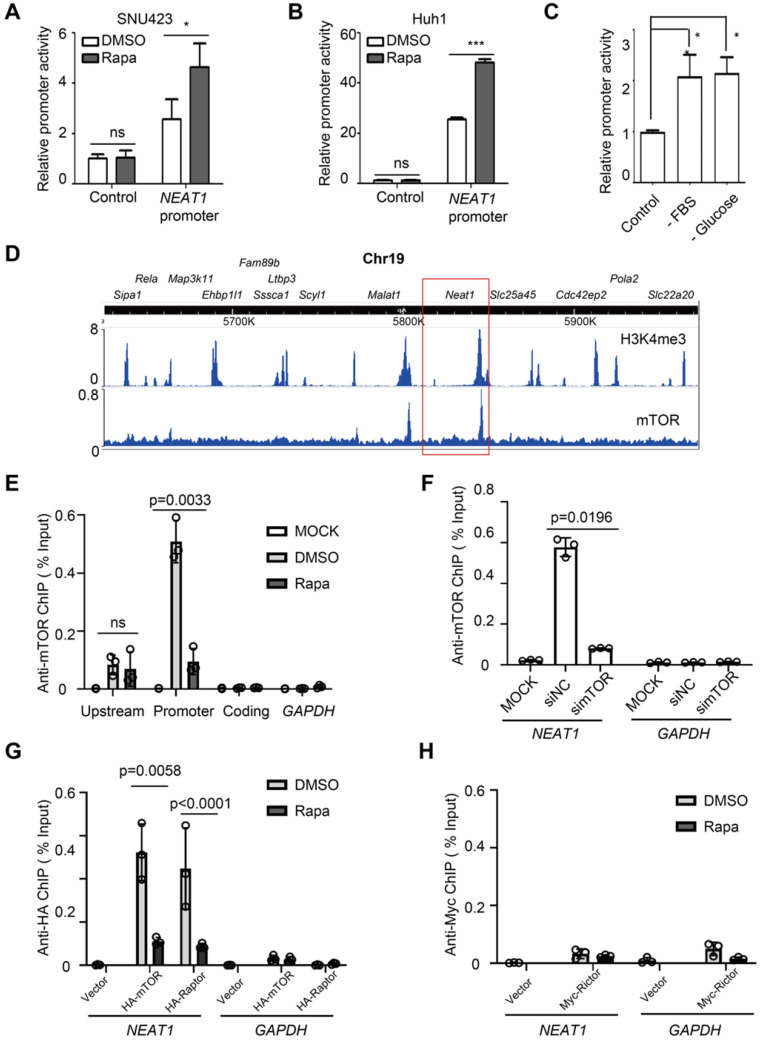
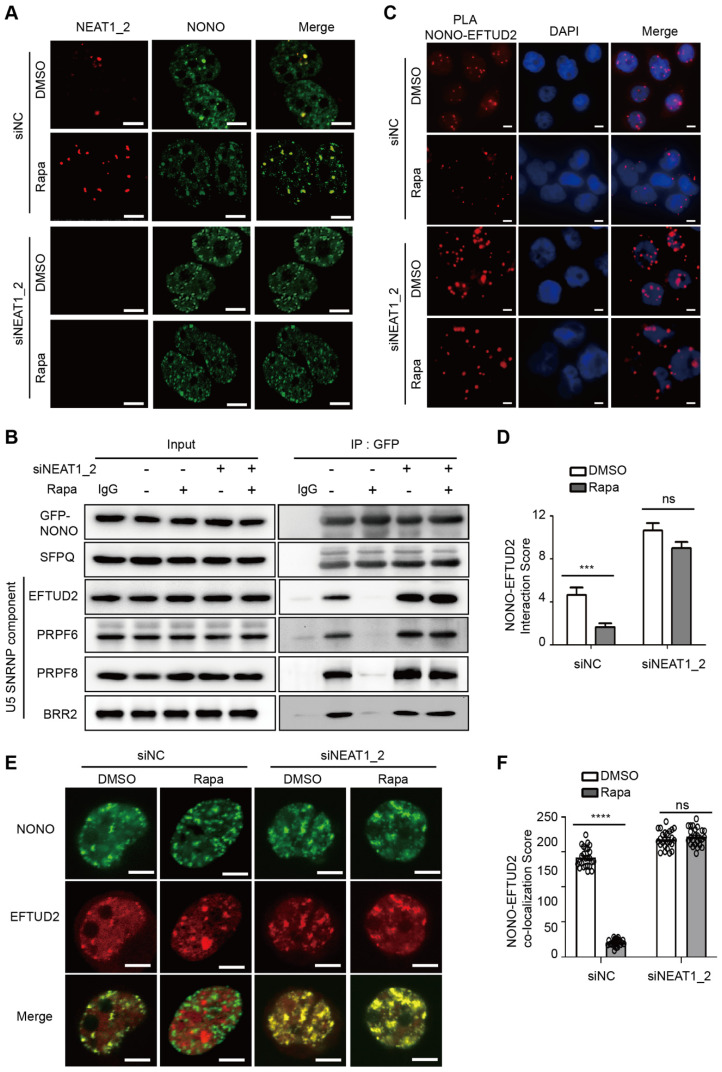
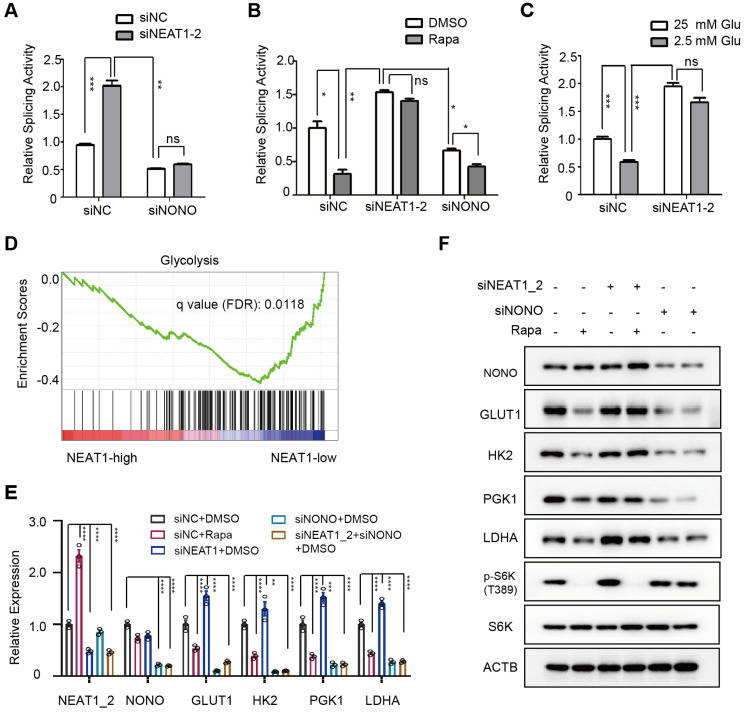
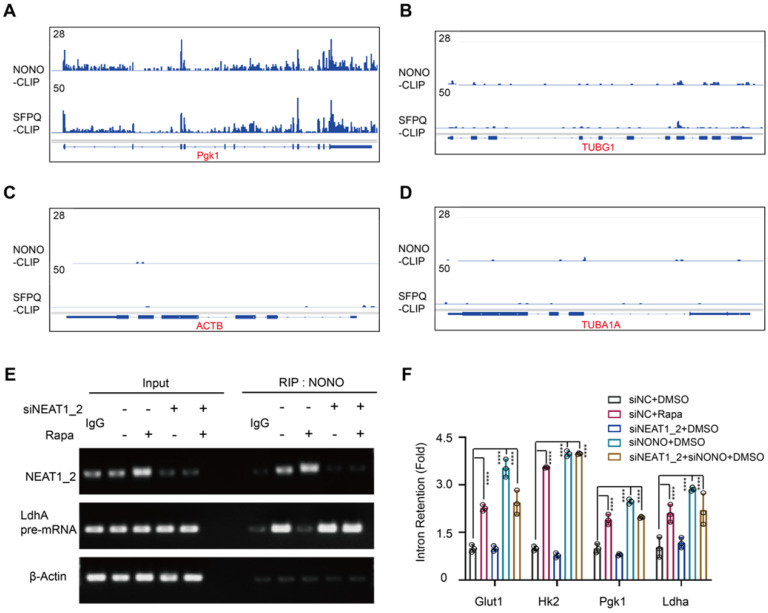
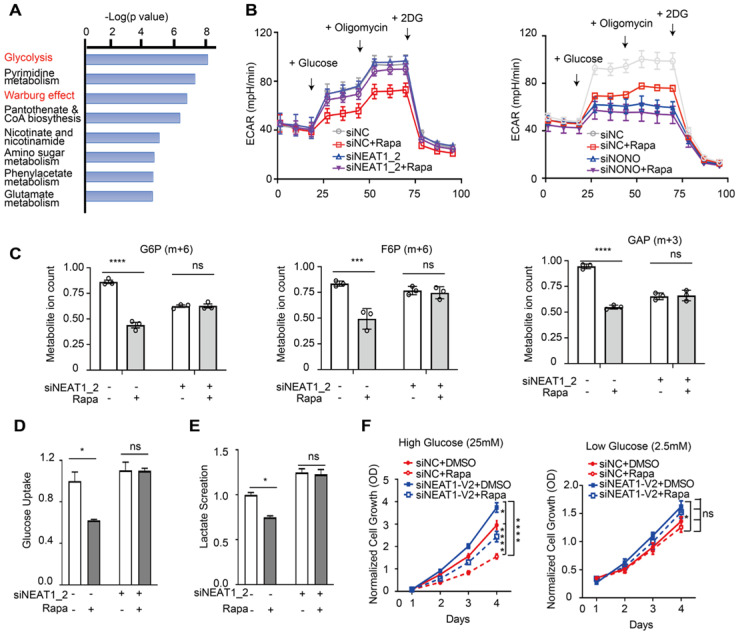
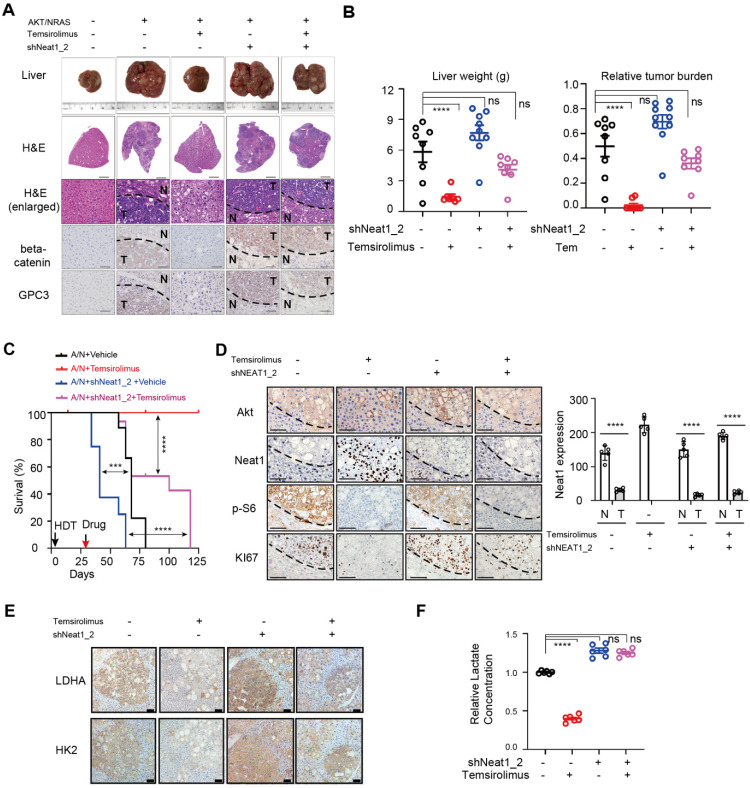
Background: Hepatocellular Carcinoma (HCC) is a major form of liver cancer and a leading cause of cancer-related death worldwide. New insights into HCC pathobiology and mechanism of drug actions are urgently needed to improve patient outcomes. HCC undergoes metabolic reprogramming of glucose metabolism from respiration to aerobic glycolysis, a phenomenon known as the 'Warburg Effect' that supports rapid cancer cell growth, survival, and invasion. mTOR is known to promote Warburg Effect, but the underlying mechanism(s) remains poorly defined. The aim of this study is to understand the mechanism(s) and significance of mTOR regulation of aerobic glycolysis in HCC. Methods: We profiled mTORC1-dependent long non-coding RNAs (lncRNAs) by RNA-seq of HCC cells treated with rapamycin. Chromatin immunoprecipitation (ChIP) and luciferase reporter assays were used to explore the transcriptional regulation of NEAT1 by mTORC1. [U-13C]-glucose labeling and metabolomic analysis, extracellular acidification Rate (ECAR) by Seahorse XF Analyzer, and glucose uptake assay were used to investigate the role of mTOR-NEAT1-NONO signaling in the regulation of aerobic glycolysis. RNA immunoprecipitation (RIP) and NONO-binding motif scanning were performed to identify the regulatory mechanism of pre-mRNA splicing by mTOR-NEAT1. Myristoylated AKT1 (mAKT1)/NRASV12-driven HCC model developed by hydrodynamic transfection (HDT) was employed to explore the significance of mTOR-NEAT1 signaling in HCC tumorigenesis and mTOR-targeted therapy. Results: mTOR regulates lncRNA transcriptome in HCC and that NEAT1 is a major mTOR transcriptional target. Interestingly, although both NEAT1_1 and NEAT1_2 are down-regulated in HCC, only NEAT1_2 is significantly correlated with poor overall survival of HCC patients. NEAT1_2 is the organizer of nuclear paraspeckles that sequester the RNA-binding proteins NONO and SFPQ. We show that upon oncogenic activation, mTORC1 suppresses NEAT1_2 expression and paraspeckle biogenesis, liberating NONO/SFPQ, which in turn, binds to U5 within the spliceosome, stimulating mRNA splicing and expression of key glycolytic enzymes. This series of actions lead to enhanced glucose transport, aerobic glycolytic flux, lactate production, and HCC growth both in vitro and in vivo. Furthermore, the paraspeckle-mediated mechanism is important for the anticancer action of US FDA-approved drugs rapamycin/temsirolimus. Conclusions: These findings reveal a molecular mechanism by which mTOR promotes the 'Warburg Effect', which is important for the metabolism and development of HCC, and anticancer response of mTOR-targeted therapy.

Keywords: Aerobic Glycolysis; HIF1; Hepatocellular carcinoma; Hypoxia; NEAT1; Normoxia; Paraspeckles; Rapamycin; Splicing; Warburg Effect; mTOR.


Conflict of interest statement

Competing Interests: The authors have declared that no competing interest exists.

Figures

Figure 1
Figure 1
mTORC1 regulates lncRNA transcriptome, NEAT1 expression and nuclear paraspeckle biogenesis. (A) Identification of mTORC1-regulated lncRNAs by RNA-seq of SNU423 cells treated with 100 nM rapamycin for 2 h. Shown is volcano plot of differentially-expressed lncRNAs (FC ≥2, p ≤0.05). (B) Down-regulation of NEAT1 mRNA in human HCC tumors. NEAT1 RNA expression was analyzed in 369 primary HCC and 160 normal liver tissues (GEPIA dataset). p value was determined by unpaired two-tailed Student's t test (bar represents mean value). * p < 0.05. (C) HCC patients with low NEAT1 expression have poor overall survival. Kaplan-Meier analysis was used to compare overall survival of HCC patients with high and low NEAT1 expression. p value was calculated using the two-sided log-rank test. (D and E) Rapamycin rapidly induces expression of total NEAT1, NEAT1_1 and NEAT1_2 in HCC cells. SNU423 (D) and Huh1 (E) cells were treated with 100 nM rapamycin for 2 h and RNA expression was analyzed by qRT-PCR. Values are normalized against ACTIN mRNA. Bar graphs represent mean ± SEM (n = 3). P value was determined by two-tailed unpaired t test. *** p < 0.001. (F) Rapamycin promotes paraspeckle biogenesis in HCC cells. SNU423 cells were treated with 100 nM rapamycin for different times. Paraspeckles were stained by RNA-FISH with NEAT1_2 probe (red) and nuclei were counterstained with DAPI (blue). Right panel shows quantification of the result (paraspeckles/nucleus view). Bar graphs represent mean ± SEM (n = 5) and p value was determined by one-way ANOVA followed by Tukey's multiple comparisons test. *** p < 0.001.
Figure 2
Figure 2
Hyperactivated mTORC1 suppresses NEAT1 expression in vitro and in vivo. (A) NEAT1 expression is negatively correlated with mTORC1 signaling, not mTORC2 signaling in HCC cell lines. mTORC1 and mTORC2 signaling were measured by immunoblot of p-S6K(T389) and p-Akt (S473), respectively (left panel) in a panel of HCC cell lines (SNU387, SNU423, Hep3B, PLC5, Huh1, MHCC97H, C3A, Huh7). NEAT1 expression was determined by qRT-PCR (middle panel) in the same panel of HCC cell lines. Correlation analysis of NEAT1 expression with mTORC1 and mTORC2 signaling was determined by nonparametric Spearman correlation test (right panels). (B) Hyperactive mTORC1 represses NEAT1 expression. HCC cells with high mTORC1 activity (Hep3B, SNU387) and low mTORC1 activity (Huh1, SNU423) were treated without or with 100 nM rapamycin for 2 h (upper panel), and analyzed for NEAT1 expression by qRT-PCR. WT and Tsc1-/- MEF cells were treated without or with 100 nM rapamycin for 2 h and analyzed for NEAT1 expression by qRT-PCR (lower panel). NEAT1 expression was calculated as relative to ACTIN. Bar graphs represent mean ± SEM (n = 3). Data are shown as mean ± SEM (n = 3); Statistical significance was tested using two-tailed unpaired t test. *** p < 0.001, **** p < 0.0001, ns, not significant. (C) Oncogenic activation of mTORC1 signaling represses NEAT1 expression in vivo. Mouse livers were transfected with a vector control, HA-mAKT or HA-mAKT plus NRAS through hydrodynamic transfection (HDT) in mice. Liver tissues were analyzed by HE staining, anti-HA IHC staining, and Neat1_2 RNAscope staining. Mouse liver tumor tissues were stained by IHC positively for the HCC marker Arginase, but negatively for the cholangiocarcinoma marker CK19. (D) Quantification of Neat1_2 staining results in (C). Data are shown as mean ± SEM (n = 5); Statistical significance was tested using two-tailed unpaired t test. *** p < 0.001, ** p < 0.01. N, normal liver; T, tumor. (E) NEAT1 expression is negatively correlated with mTORC1 signaling in human HCC tumors. Correlation analysis of NEAT1 RNA expression with TSC1 mRNA (left panel) and ATP5G1 mRNA (right panel) in 369 primary human HCC tumors (http://gepia.cancer-pku.cn/). p value was analyzed by nonparametric Spearman correlation test. (F) NEAT1 expression is negatively correlated with mTORC1 signaling in HCC cells as determined protein expression analysis. NEAT1 expression and p-S6 (S235/236) was performed in a CCLE HCC panel. Protein and NEAT1 expression data was downloaded from the CCLE portal (https://portals.broadinstitute.org/ccle). The correlation score was analyzed using Pearson correlation test.
Figure 3
Figure 3
mTORC1 acts at NEAT1 promoter and negatively regulates NEAT1 transcription. (A-B) Rapamycin stimulates NEAT1 promoter activity. Activity of NEAT1 promoter-driven luciferase reporter was measured in SNU423 (A) and Huh1 (B) cells treated with or without 100 nM rapamycin for 24 h. Mean ± SEM (n = 3), Unpaired two-tail t test; (C) NEAT1 promoter activity is regulated by glucose and growth factors. SNU423 cells transfected with NEAT1 promoter luciferase reporter were starved from fetal bovine serum (FBS) or glucose. Data (mean ± SEM, n = 3) were analyzed by unpaired two-tail t test. (D) Shown are peaks of mTOR-binding and histone H3K4me3 across a region of Chromosome 19 in mouse liver as determined by analysis of the ChIP-seq (mTOR dataset: GSM1067407; H3K4me3 dataset: GSM1970920). Boxed region shows Neat1 locus. (E) mTOR binds to the NEAT1 promoter in a rapamycin-sensitive manner in HCC cells. SNU423 cells were treated without or with 100 nM rapamycin for 2 h. Anti-mTOR ChIP was performed and the results were analyzed by qRT-PCR. Blue boxes indicate NEAT1 coding, promoter and upstream region used for ChIP analysis. GAPDH promoter was used as a negative control. % Input = 100*2^(Adjusted input - Ct (IP). Mean ± SEM (n = 3), unpaired two-tail t test. (F) mTOR binding to NEAT1 promoter is blocked by mTOR knockdown in HCC cells. SNU423 cells were transfected with mTOR siRNA (simTOR) or control siRNA (siNC). mTOR binding to NEAT1 promoter was assayed by anti-mTOR ChIP. (G) mTORC1 binds to NEAT1 promoter in a rapamycin-sensitive manner. HA-mTOR or HA-Raptor was transiently expressed in SNU423 cells and then treated without or with rapamycin. HA-mTOR and HA-Raptor binding to NEAT1 promoter was assayed by anti-HA ChIP. (H) mTORC2 does not bind to NEAT1 promoter in HCC cells. Myc-Rictor was transiently expressed in SNU423 cells and then treated without or with rapamycin. Myc-Rictor binding to NEAT1 promoter was assayed by anti-Myc ChIP. Mean ± SEM (n = 3), unpaired two-tail t test. *** p < 0.001. ns, not significant.
Figure 4
Figure 4
mTORC1 regulates NONO-U5 SNRNP interaction in a paraspeckle-dependent manner. (A) Rapamycin promotes NEAT1-dependent adsorption of NONO to paraspeckles. SNU423 cells transfected with NEAT1_2 or control siRNA were treated without or with 100 nM rapamycin for 24 h. Localization of NEAT1 and NONO were analyzed by FISH and IF staining, respectively. The nuclei were counterstained by DAPI. Confocal images are shown: Scale bar, 10 µm. (B) Rapamycin disrupts NONO interaction with U5 spliceosome in a NEAT1-dependent manner. GFP-NONO was assayed for interaction with U5 components by co-IP from extracts of SNU423 cells treated without or with 100 nM rapamycin. (C and D) Rapamycin disrupts NONO interaction with EFTUD2 in intact SNU423 cells, as measured by proximity ligation assay (PLA). PLA was performed in SNU423 cells treated without or with 100 nM rapamycin in the absence or presence of NEAT1_2 knockdown. Scale bar, 10 µm (C). Quantification of NONO-EFTUD2 interaction by PLA (D). Bar graphs represent mean ± SEM (n = 5) and p value was determined by unpaired two-tail t test. *** p < 0.001. ns, not significant. (E and F) Rapamycin disrupts NONO-EFTUD2 co-localization in a NEAT1-dependent manner. SNU423 cells were treated with or without 100 nM rapamycin in the absence or presence of NEAT1_2 knockdown. NONO and EFTUD2 localization was analyzed by IF (E) and the results were quantified for co-localization (F). Scar bar, 10 µm. Bar graphs represent mean ± SEM (n = 25, number of cells counted) and p value was determined by unpaired two-tail t test. **** p < 0.0001. ns, not significant.
Figure 5
Figure 5
mTORC1-NEAT1-NONO axis regulates mRNA splicing and expression of glycolytic enzymes. (A) NEAT1_2 negatively regulates RNA splicing activity in a NONO-dependent manner. SNU423 cells were transfected with pTN24 splicing luciferase reporter and without or with NEAT1_2 knockdown in the absence or presence of NONO siRNA for 48 h. Activity of RNA splicing reporter was measured by luciferase activity, which was then normalized against the β-galactosidase reporter. mean ± SEM (n = 3) and p value was determined by unpaired two-tail Student's t test. *** p < 0.001, ** p < 0.01. (B) mTORC1 positively regulates RNA splicing activity in a NEAT1_2- and NONO-dependent manner. Activity of the luciferase splicing reporter was measured in SNU423 cells treated with 100 nM rapamycin for 24 h in the absence or presence of NEAT1_2 or NONO knockdown. β-galactosidase reporter was used for normalization. mean ± SEM (n = 3). p value was determined by unpaired two-tail Student's t test. ** p < 0.01, * p < 0.05. (C) Glucose stimulates RNA splicing in a NEAT1_2-dependent manner. Activity of the luciferase splicing reporter was measured in SNU423 cells cultured in high (25 mM) or low (2.5 mM) glucose for 24 h. β-galactosidase reporter was used for normalization. Data represents mean ± SEM (n = 3). p value was determined by unpaired two-tail Student's t test. ** p < 0.01, * p < 0.05.*** p < 0.001; ns, not significant. (D) Glycolysis genes are enriched in low NEAT1 expressing human primary HCC tumors. Gene enrichment analysis (GSEA) was performed in high and low NEAT1 expressing human primary HCC tumors from TCGA hepatocellular carcinoma (LIHC) transcriptome dataset. (E) mTORC1 positively regulates mRNA expression of glycolysis genes through NEAT1 and NONO. SNU423 cells were treated with 100 nM rapamycin for 16 h in the presence or absence of NEAT1 and/or NONO knockdown. mRNA expression of different glycolytic genes was analyzed by qRT-PCR and values are normalized against ACTIN. Data are shown as mean ± SEM (n = 3); Statistical significance was tested using two-tailed unpaired Student's t test. **** p < 0.0001. (F) mTORC1-NEAT1-NONO axis regulates expression of glycolytic enzyme proteins. SNU423 cells transfected with NEAT1 siRNA or a control siRNA were treated with 100 nM rapamycin for 16 h. Expression of 4 glycolytic proteins and mTORC1 signaling were analyzed by immunoblot. ACTB was used as a loading control.
Figure 6
Figure 6
mTORC1-NEAT1 regulates binding of NONO/SFPQ to and splicing of glycolytic pre-mRNAs. (A and B) Binding profiles of NONO and SFPQ to LDHA and PGK1 pre-mRNA transcripts as revealed by anti-NONO and anti-SFPQ CLIP-seq. Bottom graph shows the intron-exon organization of LDHA and PGK1 pre-mRNA transcripts. (C and D) NONO and SFPQ do not bind to ACTB and TUBA1A pre-mRNA transcripts as revealed by anti-NONO and anti-SFPQ CLIP-seq. Bottom graph shows the intron-exon organization of ACTB and TUBA1A transcripts. (E) Rapamycin inhibits NONO association with the splicing junction of LDHA pre-mRNA in a NEAT1_2-dependent manner. SNU423 cells were treated with 100 nM rapamycin for 24 h in the presence or absence of NEAT1_2 knockdown. NONO was immunoprecipitated and NONO-associated LDHA pre-mRNA and NEAT1_2 was analyzed by qRT-PCR. β-ACTIN was used as negative control. (F) mTORC1 positively regulates splicing of glycolytic pre-mRNAs through NEAT1 and NONO. SNU423 cells were treated with 100 nM rapamycin for 16 h in the presence or absence of NEAT1 and/or NONO knockdown. Intron retention of glycolytic RNA transcripts was analyzed by qRT-PCR. Intron retention is calculated by the ratio of (Expression of intron-included region) to (Expression of intron-excluded region). Data are shown as mean ± SEM (n = 3); Statistical significance was tested using two-tailed unpaired Student's t test. **** p < 0.0001.
Figure 7
Figure 7
mTORC1-NEAT1 signaling regulates aerobic glycolysis in HCC cells, which is important for rapamycin action. (A) Metabolic pathways negatively correlated with NEAT1 expression. The overrepresentation analysis (ORA) is used to determine the significance of metabolic pathways. Metabolites Set Enrichment Analysis (MSEA) are used to evaluate the correlation of NEAT1 expression with metabolites levels. The mRNA expression and metabolomic dataset of primary liver cancer cells referenced during the study are downloaded from Cancer Cell Line Encyclopedia (CCLE) portal [https://portals.broadinstitute.org/ccle/data]. (B) Left panel: Rapamycin inhibits aerobic glycolysis in a NEAT1_2-dependent manner. SNU423 cells with or without NEAT1_2 knockdown were treated with 100 nM rapamycin. ECAR was analyzed by Seahorse XF Analyzer. Kinetic ECAR response of HCC cells to glucose (10 mM), oligomycin (1 µM) and 2-DG (50 mM), respectively. Each data point represents mean ± SEM, n = 4. Right panel: NONO is required for mTORC1 to promote aerobic glycolysis. SNU423 cells with or without NONO knockdown were treated with 100 nM rapamycin. ECAR was analyzed by Seahorse XF Analyzer. Kinetic ECAR response of HCC cells to glucose (10 mM), oligomycin (1 µM) and 2-DG (50 mM), respectively. Each data point represents mean ± SEM, n = 4. (C) mTORC1 regulates glycolytic flux in a NEAT1_2-dependent manner. SNU423 cells with or without NEAT1_2 knockdown were treated with 100 nM rapamycin, and labeled with 25 mM [U-13C]-glucose for 15 min. Glycolytic metabolites were analyzed by mass spectrometry. Shown are the ion counts for G6P (m+6), F6P (m+6) and GAP (m+3) relative to untreated control. Data (mean ± SEM, n = 3) was tested using two-tailed unpaired Student's t test. **** p < 0.0001. ns, not significant. (D and E) mTORC1 regulates glucose uptake and lactate secretion in a NEAT1_2-dependent manner in HCC cells. SNU423 cells with or without NEAT1_2 knockdown were treated with 100 nM rapamycin for 16 h and measured for glucose uptake (D) or lactate secretion (E). Data was normalized to cell number and presented as mean ± SEM and analyzed by unpaired two-tail Student's t test; * p < 0.05; ns, not significant. (F) Rapamycin significantly affects HCC cell growth under high glucose, not low glucose, culture condition. SNU423 cells with or without NEAT1_2 knockdown were cultured in high (25 mM) (I) or low (2.5 mM) (J) glucose medium and treated with 100 nM rapamycin. Cell growth was measured daily by SRB assay. Data (mean ± SEM, n = 3) were analyzed by Repeated measures ANOVA followed by Tukey's honest significance test; **** p < 0.0001; * p < 0.05, ns, not significant.
Figure 8
Figure 8
NEAT1 is important for mTORC1-targeted therapeutic response in vivo. (A) Representative images of liver and liver tissues with H&E staining and IHC staining with HCC markers beta-catenin and glypican 3 (GPC3) from HDT mouse liver tumor models (mAKT/NRAS +/- shNEAT1_2) treated with temsirolimus or a drug vehicle. Liver tissues were collected at 63 days post HDT. (B) Liver weight (left panel) and relative tumor burden (right panel) from 4 different animal groups (AKT/NRAS/Vehicle, n = 8; AKT/NRAS/temsirolimus, n = 7; AKT/NRAS/shNEAT1/Vehicle, n = 9; AKT/NRAS/shNEAT1/temsirolimus, n = 8). p value was determined by one-way ANOVA followed by Tukey's multiple comparisons test. **** p < 0.0001. ns, not significant. (C) Kaplan‐Meier survival analysis of different animal groups (AKT/NRAS/Vehicle, n = 9; AKT/NRAS/temsirolimus, n = 10; AKT/NRAS/shNEAT1/Vehicle, n = 8; AKT/NRAS/shNEAT1/temsirolimus, n = 7). *** p < 0.001, **** p < 0.0001. (D) Representative IHC staining for AKT, NEAT1, p-S6 and Ki67 from liver tumor tissues (mAKT/NRAS +/- shNEAT1_2 treated with temsirolimus or a drug vehicle). Scale bar, 100 µm. (E) Protein levels of LDHA and HK2 as determined by IHC analysis from different liver tumor tissues (mAKT/NRAS +/- shNEAT1_2 treated with temsirolimus or a drug vehicle). Scale bar, 100 µm. (F) Temsirolimus inhibits glycolysis of AKT/NRAS-driven liver tumors in a NEAT1_2-dependent manner. Lactate concentration in liver tumors tissues (mAKT/NRAS +/- shNEAT1_2 treated with temsirolimus or a drug vehicle) was measured using a colorimetric lactate assay kit. Data was normalized and Results represent mean ± SEM (n = 6). p value was determined by one-way ANOVA followed by Tukey's multiple comparisons test. **** p < 0.0001. ns, not significant.

Similar articles

Cited by

References

    1. Marquardt JU, Thorgeirsson SS. SnapShot: Hepatocellular carcinoma. Cancer Cell. 2014;25:550. e1. - PubMed
    1. Starley BQ, Calcagno CJ, Harrison SA. Nonalcoholic fatty liver disease and hepatocellular carcinoma: a weighty connection. Hepatology. 2010;51:1820–32. - PubMed
    1. Mokdad AH, Dwyer-Lindgren L, Fitzmaurice C. et al. Trends and patterns of disparities in cancer mortality among us counties, 1980-2014. JAMA. 2017;317:388–406. - PMC - PubMed
    1. Verslype C, Van Cutsem E, Dicato M, Arber N, Berlin JD, Cunningham D. et al. The management of hepatocellular carcinoma. Current expert opinion and recommendations derived from the 10th World Congress on Gastrointestinal Cancer, Barcelona, 2008. Ann Oncol. 2009;20(Suppl 7):vii1–vii6. - PubMed
    1. Llovet JM, Ricci S, Mazzaferro V, Hilgard P, Gane E, Blanc JF. et al. Sorafenib in advanced hepatocellular carcinoma. N Engl J Med. 2008;359:378–90. - PubMed

Publication types