. 2022 Apr 24;12(7):3456-3473.
doi: 10.7150/thno.71129. eCollection 2022.

Polymer chimera of stapled oncolytic peptide coupled with anti-PD-L1 peptide boosts immunotherapy of colorectal cancer

Affiliations

Polymer chimera of stapled oncolytic peptide coupled with anti-PD-L1 peptide boosts immunotherapy of colorectal cancer

Lu Lu et al. Theranostics. .

Abstract

Rationale: Scarce tumor mutation burden and neoantigens create tremendous obstacles for an effective immunotherapy of colorectal cancer (CRC). Oncolytic peptides rise as a promising therapeutic approach that boosts tumor-specific immune responses by inducing antigenic substances. However, the clinical application of oncolytic peptides has been hindered because of structural instability, proteolytic degradation, and undesired toxicity when administered systemically. Methods: Based on wasp venom peptide, an optimized stapled oncolytic peptide MP9 was developed with rigid α-helix, protease-resistance, and CRC cell cytotoxicity. By incorporating four functional motifs that include D-peptidomimetic inhibitor of PD-L1, matrix metalloproteinase-2 (MMP-2) cleavable spacer, and MP9 with 4-arm PEG, a novel peptide-polymer conjugate (PEG-MP9-aPDL1) was obtained and identified as the most promising systemic delivery vehicle with PD-L1 targeting specificity and favorable pharmacokinetic properties. Results: We demonstrated that PEG-MP9-aPDL1-driven oncolysis induces a panel of immunogenic cell death (ICD)-relevant damage-associated molecular patterns (DAMPs) both in vitro and in vivo, which are key elements for immunotherapy with PD-L1 inhibitor. Further, PEG-MP9-aPDL1 exhibited prominent immunotherapeutic efficacy in a CRC mouse model characterized by tumor infiltration of CD8+ T cells and induction of cytotoxic lymphocytes (CTLs) in the spleens. Conclusion: Our findings suggest that PEG-MP9-aPDL1 is an all-in-one platform for oncolytic immunotherapy and immune checkpoint blockade (ICB).

Keywords: colorectal cancer; immunogenic cell death; oncolytic immunotherapy; peptide-polymer conjugate; stapled mastoparan peptide.


Conflict of interest statement

Competing Interests: The authors have declared that no competing interest exists. The image of graphic abstract was created with Biorender.com. Other images were created with Adobe Illustrator.

Figures

Figure 1
Figure 1
α-helicity, antiproliferative and hemolytic activities of stapled MP derivatives. (A) Sequence, C18-HPLC retention time (TR), α-helicity, hemolytic activity (HC50, half maximal hemolysis concentration), antitumor activity (IC50, half maximal inhibitory concentration), therapeutic index (HC50/IC50), and lyticity index of MP and derivatives. S5 = (S)-pentenyl alanine residue. (B) CD spectra of MP and derivatives. (C) Red blood cell (RBC) hemolytic activity of MP and derivatives (n = 3). (D) HNM of MP9. (E) Surface and cartoon views of the hydrophilic (left) and hydrophilic (right) faces of the amphipathic MP9 α-helix. The hydrophobic face contains two patches of highly hydrophobic residues (L, yellow) separated by low hydrophobic residues (A, gray) and polar, uncharged residue (N, green). Cationic residue (K) is represented in blue on the structures and helical wheel.
Figure 2
Figure 2
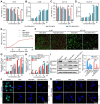
MP9 exhibits potent and rapid oncolytic activity to CRC cells. Cell viability analysis of CT26 (A) and HCT116 cells (C) cultured in the MP and MP9 for 24 h by CCK-8 assay. LDH release of CT26 (B) and HCT116 cells (D) following treatment with MP and MP9. CT26 (E) and HCT116 cells (F) after treatment with MP and MP9 and stained with the LIVE/DEAD cell viability/cytotoxicity kit. (G) The lytic effect of FITC-MP9 on CT26 and HCT116 cells, as observed by a confocal microscope. (H) Proteolytic stability of peptides MP and MP9 incubated in α-Chymotrypsin solution. (I) Kinetic curves of the cytotoxicity of CT26 cells after treatment with MP9 in different concentrations, as assessed by xCELLigence RTCA-DP. Data are presented as mean ± s.d.; n = 3. The representative photographs of the cells were shown. Statistical significance: ***p < 0.001.
Figure 3
Figure 3
Design, synthesis, and oncolytic effect of peptide-polymer conjugates. (A) Schematic illustration of the construction of peptide-polymer conjugate PEG-MP9-aPDL1. (B) MST analysis of aPD-L1 and PD-L1 binding (Kd = 4 μM). (C) Confocal microscopic images of the FITC-aPD-L1 peptide localized on CT26 and HCT116 cell membrane. (D) HPLC traces of peptide MMP-2-aPD-L1 treated with exogenous MMP-2 for different length of time. (E) CD spectra of PEG-aPDL1, PEG-MP9, and PEG-MP9-aPDL1. Particle size (F) and zeta potential (G) of PEG-aPDL1, PEG-MP9, and PEG-MP9-aPDL1 were measured by dynamic light scattering (DLS). Confocal microscopic images showed cellular uptake of FITC-PEG-MP9 and FITC-PEG-MP9-aPDL1 after 30 min treatment in CT26 (H) and HCT116 cells (J). The mean fluorescence intensity (MFI) of CT26 (I) and HCT116 cells (K) after incubation with PEG-MP9 and PEG-MP9-aPDL1, respectively, for different amount of time. Data are presented as mean ± s.d.; n = 3. Representative photographs were shown. Statistical significance: *p < 0.05, **p < 0.01, and ***p < 0.001.
Figure 4
Figure 4
PEG-MP9-aPDL1-mediated oncolysis induces immunogenic cell death of CRC cells. Concentration-response results of CT26 (A) and HCT116 cells (C) cultured in the presence of PEG-MP9-aPDL1, PEG-MP9, and PEG-aPDL1 for 24 h and cell viability determined by CCK-8 assay. LDH release of CT26 (B) and HCT116 cells (D) following treatment with PEG-MP9-aPDL1, PEG-MP9, and PEG-aPDL1. (E) RBC hemolytic activity of MP9, PEG-aPDL1, PEG-MP9, and PEG-MP9-aPDL1. (F) CT26 and HCT116 cells after treatment with PEG-MP9-aPDL1, PEG-MP9, and PEG-aPDL1 and stained with the LIVE/DEAD cell viability/cytotoxicity kit. Extracellular ATP levels of CT26 (G) and HCT116 cells (H) following free MP9, PEG-MP9, and PEG-MP9-aPDL1 treatment. (I) Expression of HMGB1 protein in CT26 and HCT116 cells after treatment with MP9, PEG-MP9, and PEG-MP9-aPDL1 for 6 h, detected by Western blot. Confocal microscopic images showing HMGB1 (J) and CRT (K) in CT26 and HCT116 cells incubated with MP9, PEG-MP9, and PEG-MP9-aPDL1 for 6 h. Data are presented as mean ± s.d.; n = 3. Statistical significance: *p < 0.05, **p < 0.01, and ***p< 0.001.
Figure 5
Figure 5
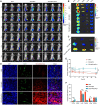
In vivo tumor targeting of PEG-MP9-aPDL1. (A) Female BALB/c bearing CT26 tumor (~200 mm3) were given a single intravenous injection of ICG-labeled MP9, ICG-labeled PEG-MP9 or ICG-labeled PEG-MP9-aPDL1 at the ICG dose of 0.5 mg/kg. At 1, 2, 4, 8, 12, and 24 h after injection, mice with in vivo ICG fluorescence were imaged by a Bio Imaging Technologies (VISQUE In Vivo Elite). The tumors were shown in red. At 24 h after injection, the mice were sacrificed, and major organs (B) and tumors (C) were harvested for ex vivo imaging. (D) Distribution of ICG-labeled MP9, ICG-labeled PEG-MP9 or ICG-labeled PEG-MP9-aPDL1 in cryosectioned tumor tissue samples. (E) After injection of ICG-labeled MP9, ICG-labeled PEG-MP9 and ICG-labeled PEG-MP9-aPDL1, the average radiant efficiency of tumors in vivo at 1, 2, 4, 8, 12, and 24 h. (F) The average radiant efficiency of major organs and tumors. Statistical significance: *p < 0.05, **p < 0.01, and ***p < 0.001 (n = 3).
Figure 6
Figure 6
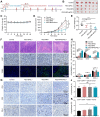
In vivo antitumor efficacy and the evaluation of the immune response in CT26 tumor model. (A) Schematic illustration of the timeline for the in vivo study. (B) Images of excised CT26 tumors. (C) Body weight of mice bearing CT26 tumors throughout the study. (D) Tumor growth curves (n = 6). (E) Weight of CT26 tumors. Representative images of H&E, Ki-67, and TUNEL staining of tumor samples collected from different groups (F) and image-based quantitative results (H) (n = 6). Representative images of tumor samples following immunohistochemical staining for CD4+, CD8+, and PD-L1 (G) and quantified results of the images (I) (n = 6). Flow cytometry analysis of CD4+ (J), CD8+ T cells (K) isolated from CT26 tumors after PBS, PEG-aPDL1, PEG-MP9, and PEG-MP9-aPDL1 treatment (n = 3). Statistical significance: *p < 0.05, **p < 0.01, and ***p < 0.001.

Similar articles

Cited by

References

    1. Sung H, Ferlay J, Siegel RL, Laversanne M, Soerjomataram I, Jemal A. et al. Global cancer statistics 2020: GLOBOCAN estimates of incidence and mortality worldwide for 36 cancers in 185 countries. CA Cancer J Clin. 2021;71:209–49. - PubMed
    1. Guo J, Yu Z, Das M, Huang L. Nano codelivery of oxaliplatin and folinic acid achieves synergistic chemo-immunotherapy with 5-fluorouracil for colorectal cancer and liver metastasis. ACS Nano. 2020;14:5075–89. - PubMed
    1. Dekker E, Tanis PJ, Vleugels JLA, Kasi PM, Wallace MB. Colorectal cancer. Lancet. 2019;394:1467–80. - PubMed
    1. Pardoll DM. The blockade of immune checkpoints in cancer immunotherapy. Nat Rev Cancer. 2012;12:252–64. - PMC - PubMed
    1. Le DT, Hubbard-Lucey VM, Morse MA, Heery CR, Dwyer A, Marsilje TH. et al. A blueprint to advance colorectal Cancer Immunotherapies. Cancer Immunol Res. 2017;5:942–9. - PubMed

Publication types