. 2022 Apr 24;12(7):3534-3552.
doi: 10.7150/thno.70194. eCollection 2022.

SCD1/FADS2 fatty acid desaturases equipoise lipid metabolic activity and redox-driven ferroptosis in ascites-derived ovarian cancer cells

Affiliations

SCD1/FADS2 fatty acid desaturases equipoise lipid metabolic activity and redox-driven ferroptosis in ascites-derived ovarian cancer cells

Yang Xuan et al. Theranostics. .

Abstract

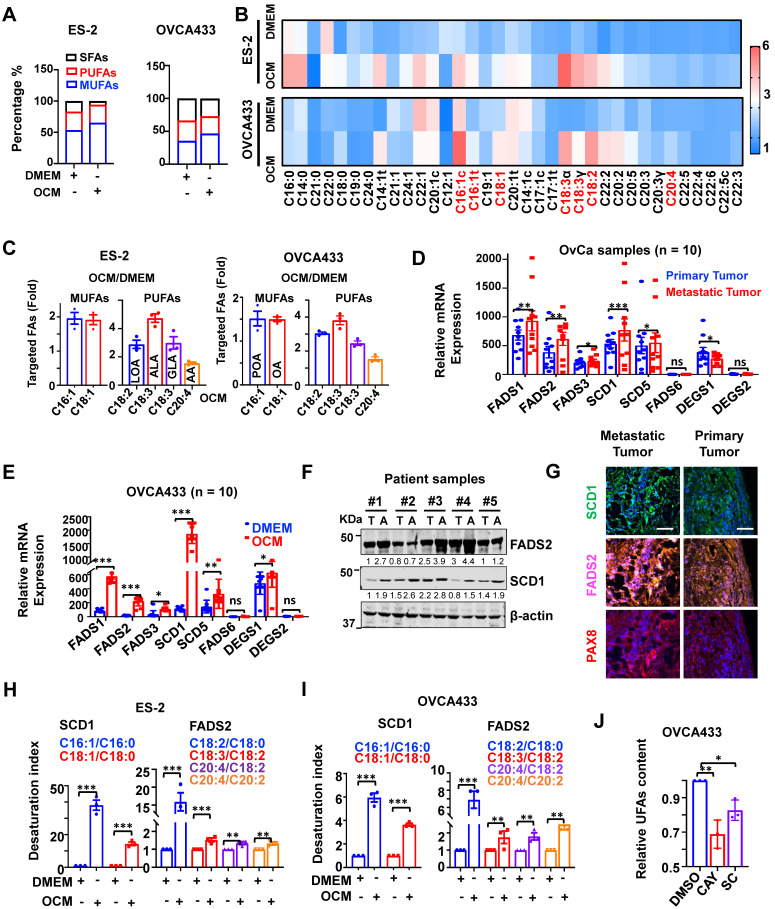
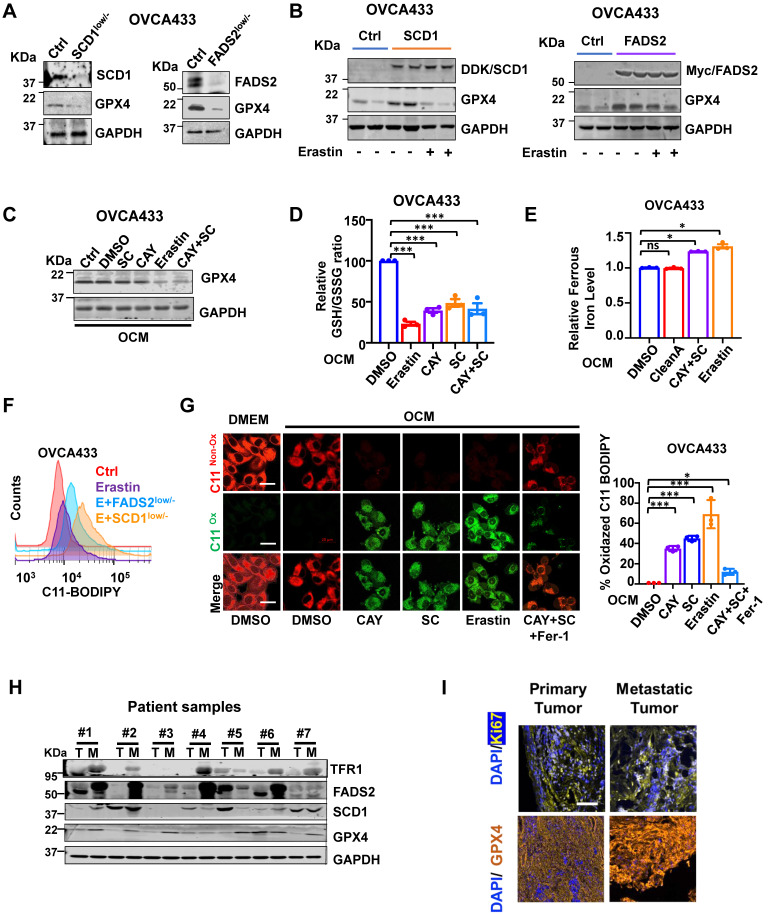
Rationale: Malignant ascites in peritoneal metastases is a lipid-enriched microenvironment and is frequently involved in the poor prognosis of epithelial ovarian cancer (EOC). However, the detailed mechanisms underlying ovarian cancer (OvCa) cells dictating their lipid metabolic activities in promoting tumor progression remain elusive. Methods: The omental conditioned medium (OCM) was established to imitate the omental or ascites microenvironment. Mass spectrometry, RT-qPCR, IHC, and western blot assays were applied to evaluate human fatty acid desaturases expressions and activities. Pharmaceutical inhibition and genetic ablation of SCD1/FADS2 were performed to observe the oncogenic capacities. RNA sequencing, lipid peroxidation, cellular iron, ROS, and Mito-Stress assays were applied to examine ferroptosis. OvCa patient-derived organoid and mouse model of peritoneal metastases were used to evaluate the combined effect of SCD1/FADS2 inhibitors with cisplatin. Results: We found that two critical fatty acid desaturases, stearoyl-CoA desaturase-1 (SCD1) and acyl-CoA 6-desaturase (FADS2), were aberrantly upregulated, accelerating lipid metabolic activities and tumor aggressiveness of ascites-derived OvCa cells. Lipidomic analysis revealed that the elevation of unsaturated fatty acids (UFAs) was positively associated with SCD1/FADS2 levels and the oncogenic capacities of OvCa cells. In contrast, pharmaceutical inhibition and genetic ablation of SCD1/FADS2 retarded tumor growth, cancer stem cell (CSC) formation and reduced platinum resistance. Inhibition of SCD1/FADS2 directly downregulated GPX4 and the GSH/GSSG ratio, causing disruption of the cellular/mitochondrial redox balance and subsequently, iron-mediated lipid peroxidation and mitochondrial dysfunction in ascites-derived OvCa cells. Conclusions: Combinational treatment with SCD1/FADS2 inhibitors and cisplatin synergistically repressed tumor cell dissemination, providing a promising chemotherapeutic strategy against EOC peritoneal metastases.

Keywords: lipid desaturases; lipid metabolism; ovarian cancer; oxidative stress; peritoneal metastases.


Conflict of interest statement

Competing Interests: The authors have declared that no competing interest exists.

Figures

Figure 1
Figure 1
SCD1 and FADS2 are activated and overexpressed in metastatic OvCa cells. (A-C) Percentage bar chart (A), heatmap (B), and column scatter graph (C) show LC-MS/MS lipidomic analysis of the amount of intercellular SFAs, PUFAs, and MUFAs in OVCA433 and ES-2 cells, respectively. Cells were co-cultured in OCM for 12 h. 1% FBS-DMEM was used as the negative control. The experiments were conducted in three replicated sets of OCM, and the results are presented as the means of replicates. (D) mRNA levels of the indicated FA desaturases in paired primary and metastatic OvCa tissues (n = 10). 18S was used as an internal control. (E) mRNA levels of the indicated FA desaturases in OCM-co-cultured OVCA433 cells. OCM was established from 10 patients. 18S was used as an internal control. (F) Representative western blot and quantification analysis of indicated proteins in ascites tumor spheroids (A) and paired original tumors (T). β-actin was used as the internal control. (G) Representative fluorescent mIHC images of indicated proteins in 10 paired primary and omental metastatic OvCa tissue samples. Scale bar, 100 µm. (H and I) LC-MS/MS lipidomic analysis shows SCD1 and FADS2 desaturation indexes in OVCA433 and ES-2 cells. (J) UFA quantification after treatment with SCD1 inhibitor (CAY10566, 10 nM) or FADS2 inhibitor (sc26196, 100 nM) in OVCA433 cells for 48 h. Relative UFA quantification was normalized to the DMSO group. The results are representative findings of three independent experiments. Error bars represent the mean ± SEM. *P < 0.05, **P < 0.01, and ***P < 0.001.
Figure 2
Figure 2
SCD1/FADS2 deficiency inhibits OvCa propagation and invasion and promotes cell death. (A) Representative western blot analysis of SCD1 and FADS2 in SCD1low/- or FADS2low/- clones of OVCA433 and ES-2 cells, same cells were found in Figure 3D. Ctrl = scrambled controls. Cells in B, D, F, and H are SCD1low/- or FADS2low/- clones of OVCA433 cells. OCM-co-cultured OVCA433 cells in C, E, G, and I were treated with SCD1 inhibitor (CAY10566, 10 nM) or FADS2 inhibitor (sc26196, 100 nM) for 48 h. (B and C) XTT cell proliferation analysis. (D) Representative caspase-3/7 fluorescent images. Nuclei were stained with Hoechst (blue). (E) Cell apoptosis was analyzed by flow cytometry. Cells were stained by Annexin V and propidium iodide (PI). (F and G) Representative images of the transwell migration assay. (H and I) Representative images of the cell cycle are determined by PI staining. Quantification in (B-I) is the mean ± SEM (n = 3 independent experiments). Statistical significance was determined by the two-tailed t-test. *P < 0.05, **P < 0.01, ***P < 0.001.
Figure 3
Figure 3
SCD1/FADS2 deficiency attenuates stemness and correlates negatively with aggressive OvCa. (A) Representative images and quantification of cell number in patient-derived spheroids and organoids after treatment with SCD1 inhibitor (CAY10566, 25 nM) or FADS2 inhibitor SC (sc26196, 500 nM) for 2 weeks. (B) Representative western blot analysis shows indicated proteins in SCD1low/- or FADS2low/- clones of OVCA433 cells. (C) Measurement of membrane fluidity evaluated by fluorescence spectroscopy quantification. OVCA433 were treated with SCD1 inhibitor (CAY10566, 10 nM) or FADS2 inhibitor (sc26196, 100 nM) for 48h. (D and E) Representative western blot analysis in (D) SCD1low/- or FADS2low/- clones of ES2 cells (same cells in Figure 2A) and (E) SCD1/FADS2-overexpressing clones of OVCA433 cells. (F) Representative fluorescence confocal images in OvCa patient-derived organoids. Scale bars, 100 µm. (G) TGF-β (5 ng/mL)-induced EMT model from patient-derived organoids treated with combined CAY10566 (25 nM) or sc26196 (500 nM) for 2 weeks. Scale bars, 100 µm. The results in (A-G) are representative findings of at least three independent experiments. Error bars represent the mean ± SEM. Statistical significance was determined by the two-tailed t-test. *P < 0.05, **P < 0.01, ***P < 0.001.
Figure 4
Figure 4
SCD1/FADS2 blockade contributes to augmented cellular ROS and lipid peroxidation in metastatic OvCa. (A-D) OCM-co-cultured ES-2 and OVCA433 cells were treated with the SCD1 inhibitor CAY (CAY10566, 10 nM), the FADS2 inhibitor SC (sc26196, 100 nM), or Fer-1 (Ferrostatin-1, 10 µM) for 48 h. (A) Measurement of the oxygen consumption rate (OCR). (B) Column scatter shows cellular ROS production. (C) Lipid peroxidation was measured by C11-BODIPY581/591 staining with flow cytometry. (D) Cell viability was measured by XTT assay. (E) Left: Venn diagram shows common and unique sets of differentially expressed genes among SCD1low/-, FADS2low/-, and control (Ctrl) OVCA433 cells. Right: KEGG analysis shows enriched signaling pathways in the common sets. (F) A schematic diagram shows the metabolic adaptation of FAO in metastatic OvCa cells. Both oxidant ROS and antioxidant GPX4 were highly expressed, and inhibition of SCD1/FADS2-mediated GPX4 suppression and elevated ROS/lipid peroxidation production promoted cell death.
Figure 5
Figure 5
Inhibition of SCD1/FADS2 increases cellular ROS and ferrous iron and downregulates GPX4 in OCM cotreated OvCa cells. (A and B) Representative western blot analysis in SCD1/FADS2 (A) knockout clones and (B) stable overexpression clones of OVCA433. GAPDH was used as the internal control. (C, D, E, G) ES-2/OVCA433 cells co-cultured with OCM were treated with CAY10566 (10 nM), sc26196 (100 nM), Erastin (5 µM), or Ferrostatin-1 (10 µM) for 48 h. (C) Representative western blot. (D) Measurement of cellular GSH/GSSG ratio by fluorometric microplate. (E) Measurement of cellular ferrous. (F) Measurement of lipid peroxidation by C11-BODIPY581/591 staining with flow cytometry. (G) Left: Representative confocal images of lipid peroxidation. Red represents non-oxidation status, and the Green represents oxidation status. DMSO was used as the negative control (Ctrl). Scale bar, 20 µm. Right: Relative quantification of the percentage of green-positive lipid peroxidation. (H) Representative western blot analysis of indicated proteins in omental metastatic tumor tissues (M) and their primary counterpart tissues (T) in OvCa. GAPDH was used as the internal control. (I) Representative fluorescent mIHC images of 10 paired OvCa tissue samples. Scale bar, 100 µm. The results are representative of three independent experiments. For the results in (D, F and G), error bars represent the mean ± SEM (n = 3). Statistical significance was determined by the two-tailed t-test. *P < 0.05, **P < 0.01, ***P < 0.001.
Figure 6
Figure 6
Effects of SCD1/FADS2 inhibitors with or without cisplatin synergistically inhibit oncogenic and malignant transformation in OvCa and sensitizes OvCa to cisplatin. (A) FA (fraction affected) and CI (combination index) values were calculated using the CalcuSyn software program. (B-D, and H) OCM-co-cultured OVCA433/PEO1/PEO4 cells treated with SCD1 inhibitor (CAY10566, 5 nM), FADS2 inhibitor (sc26196, 100 nM), DDP (cisplatin, 2 µM), combination (CAY10566+sc26196+cisplatin) or lipid removal reagent Cleanascite (CleanA) for 48 h. (B) Cell apoptosis was analyzed by flow cytometry. Cells were stained by Annexin V and propidium iodide (PI). (C) Representative images of the transwell migration assay. (D) Representative images of the cell cycle are determined by PI staining. (E) TGF-β (5 ng/mL)-induced EMT model from patient-derived organoids treated with combined CAY10566 (25 nM) and sc26196 (500 nM) for 2 weeks. Scale bars, 100 µm. (F) Representative fluorescence confocal images of patient-derived organoids show E-cadherin, Vimentin, and DAPI. Scale bars, 100 µm. (G) XTT results in PEO1 (cisplatin sensitive) and PEO4 (cisplatin-resistant) cells. FA (fraction affected) and CI (combination index) values were calculated using the CalcuSyn software program. (H) Representative western blot analysis. GAPDH was used as the internal control. The results are representative of three independent experiments. For the results in (A-E), error bars represent the mean ± SEM (n = 3). Statistical significance was determined by the two-tailed t-test. *P < 0.05, **P < 0.01, ***P < 0.001.
Figure 7
Figure 7
SCD1 and FADS2 deficiency combined with cisplatin is highly efficacious in suppressing OvCa peritoneal metastases in vivo. (A) Schematic diagram showing the ex vivo protocol of the omental metastasis model. The fresh omental tissue of C57BL/6 mice co-cultured with GFP-ID8 mouse OvCa cells with each treatment for 30 days. The treatments in each group were Ctrl (DMSO), CAY (CAY10566, 25 nM), SC (sc26196, 500 nM), DDP (cisplatin, 5 µg/mL), combination (CAY10566+sc26196+cisplatin), and combination+Fer-1 (combo+Ferrostatin-1). Fer-1 (20 µM) (B) Left: Representative images captured by ZOE Fluorescent Cell Imager show fluorescence of tumor colonization in the ex vivo model. Scale bar, 100 µm. Right: Quantification of tumor colonization numbers in an ex vivo model. Total viable colonies were measured. (C) The schematic diagram shows the experimental strategy for in vivo OvCa treatment. SCID mouse OvCa peritoneal metastases model was established by GFP-ES-2 cell intraperitoneal injection. After 2 weeks, the mice were subjected to different treatments. CAY10566 (2.5 mg/kg, q.2d), sc26196 (100 mg/kg, q.2d), and cisplatin (2 mg/kg, q.3d) were administered separately or in combination. (D) Luminescence IVIS images and quantitative analysis show peritoneal metastases after each treatment. (E) GFP fluorescence IVIS images show metastasis in different organs. (F) Average mouse ascites volume. (G) Average mouse body weight. (H) Representative IHC images show EMT markers in resected mouse tumors. Scale bar, 100 µm. The results are representative of three independent experiments. For the results in (B, D, and G), error bars represent the mean ± SEM (n = 3). Statistical significance was determined by the two-tailed t-test. *P < 0.05, **P < 0.01, ***P < 0.001.

Similar articles

Cited by

References

    1. Mehlen P, Puisieux A. Metastasis: a question of life or death. Nat Rev Cancer. 2006;6:449–58. - PubMed
    1. Ahmed N, Stenvers KL. Getting to know ovarian cancer ascites: opportunities for targeted therapy-based translational research. Front Oncol. 2013;3:256. - PMC - PubMed
    1. Halkia E, Spiliotis J, Sugarbaker P. Diagnosis and management of peritoneal metastases from ovarian cancer. Gastroenterol Res Pract. 2012;2012:541842. - PMC - PubMed
    1. Thibault B, Castells M, Delord JP, Couderc B. Ovarian cancer microenvironment: implications for cancer dissemination and chemoresistance acquisition. Cancer Metastasis Rev. 2014;33:17–39. - PubMed
    1. Kim S, Kim B, Song YS. Ascites modulates cancer cell behavior, contributing to tumor heterogeneity in ovarian cancer. Cancer Sci. 2016;107:1173–8. - PMC - PubMed