. 2022 Apr 18;12(7):3420-3437.
doi: 10.7150/thno.70346. eCollection 2022.

Intelligent design of polymer nanogels for full-process sensitized radiotherapy and dual-mode computed tomography/magnetic resonance imaging of tumors

Affiliations

Intelligent design of polymer nanogels for full-process sensitized radiotherapy and dual-mode computed tomography/magnetic resonance imaging of tumors

Changchang Zhang et al. Theranostics. .

Abstract

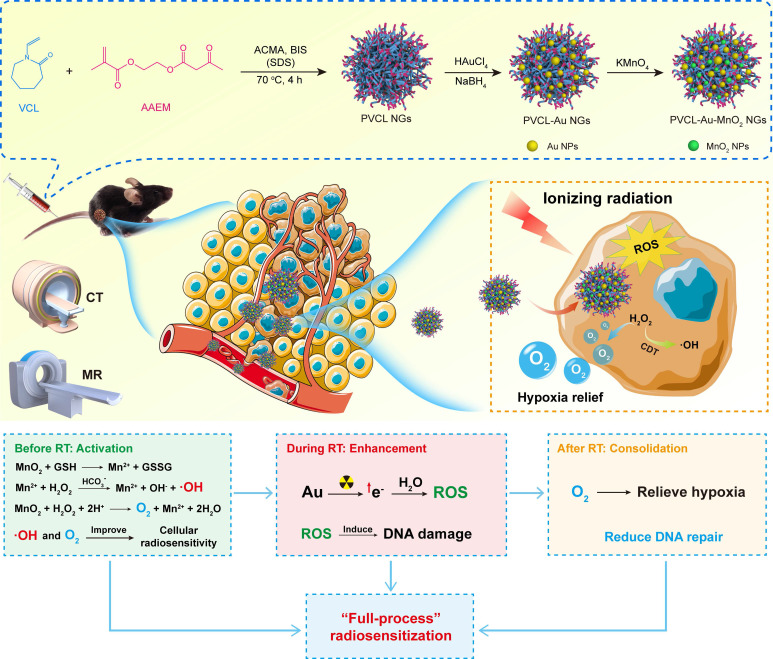
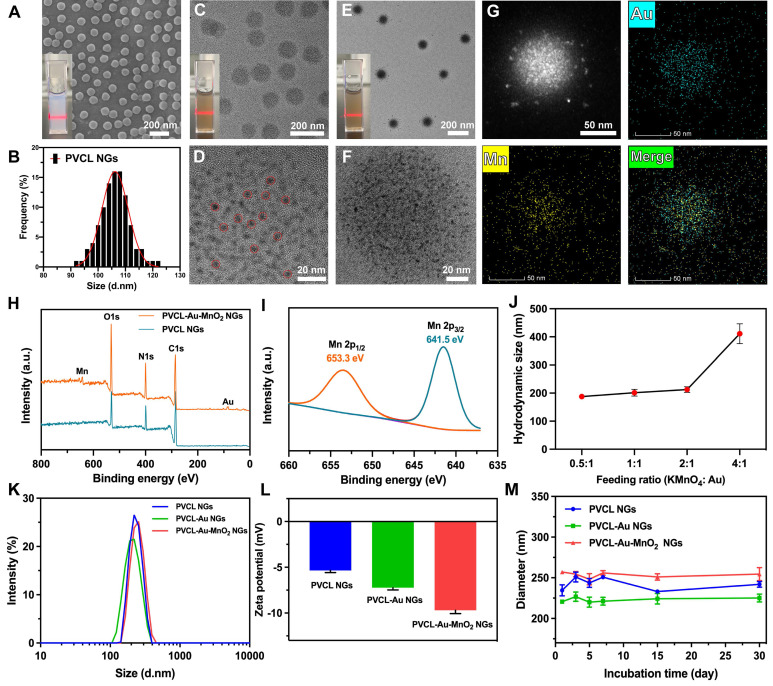
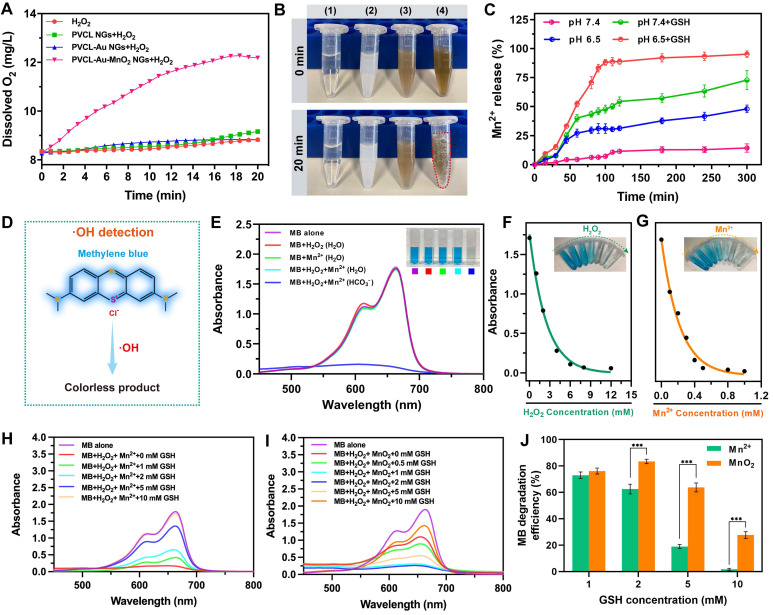
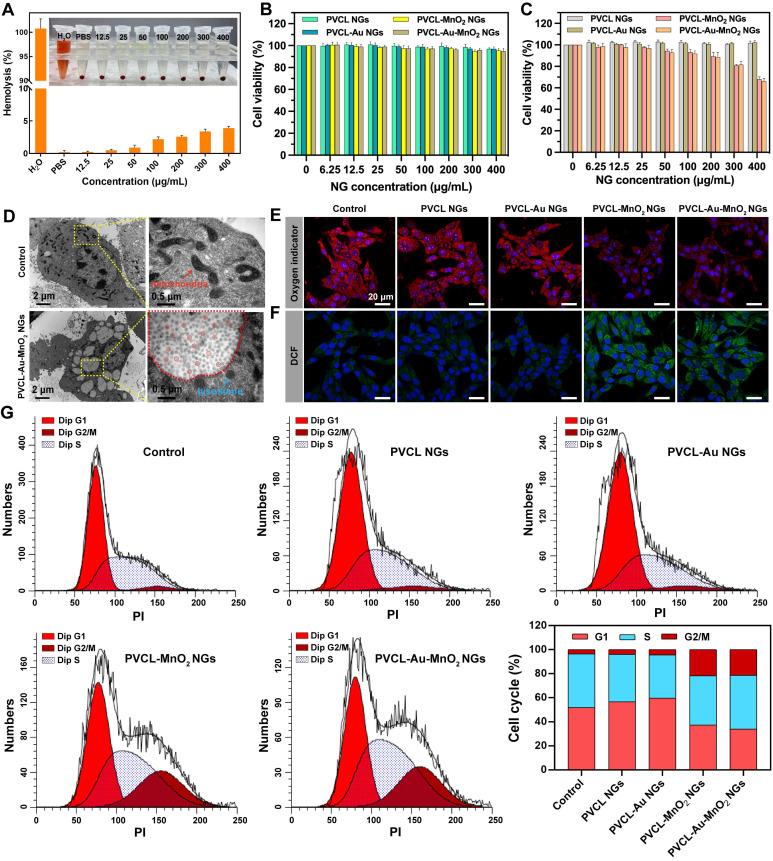
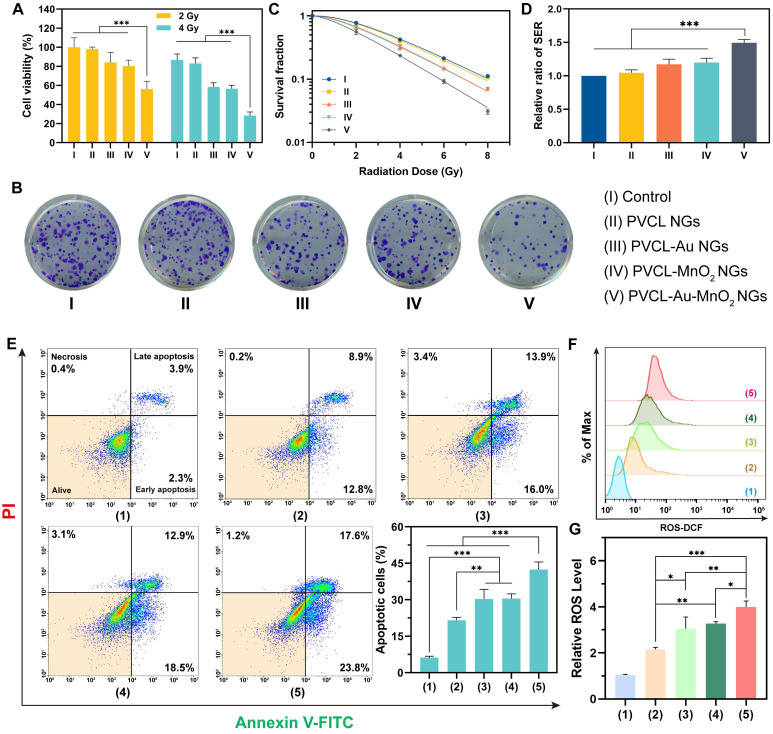
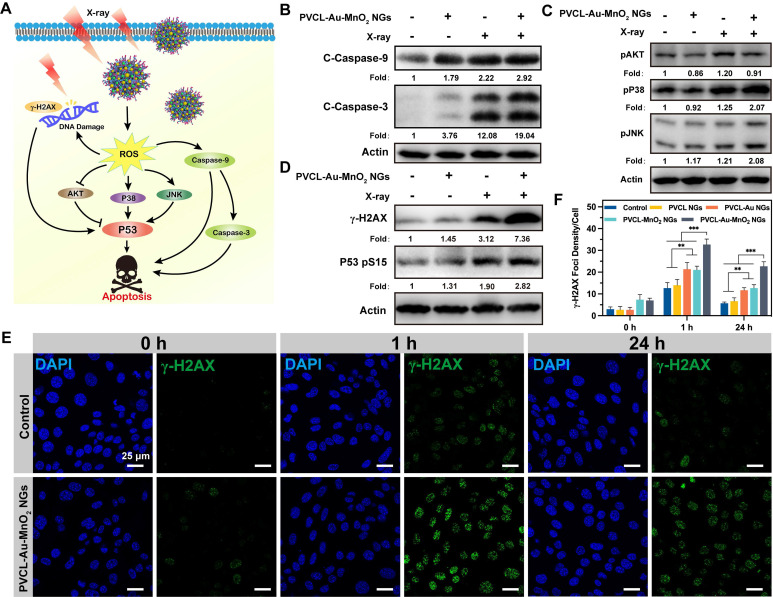
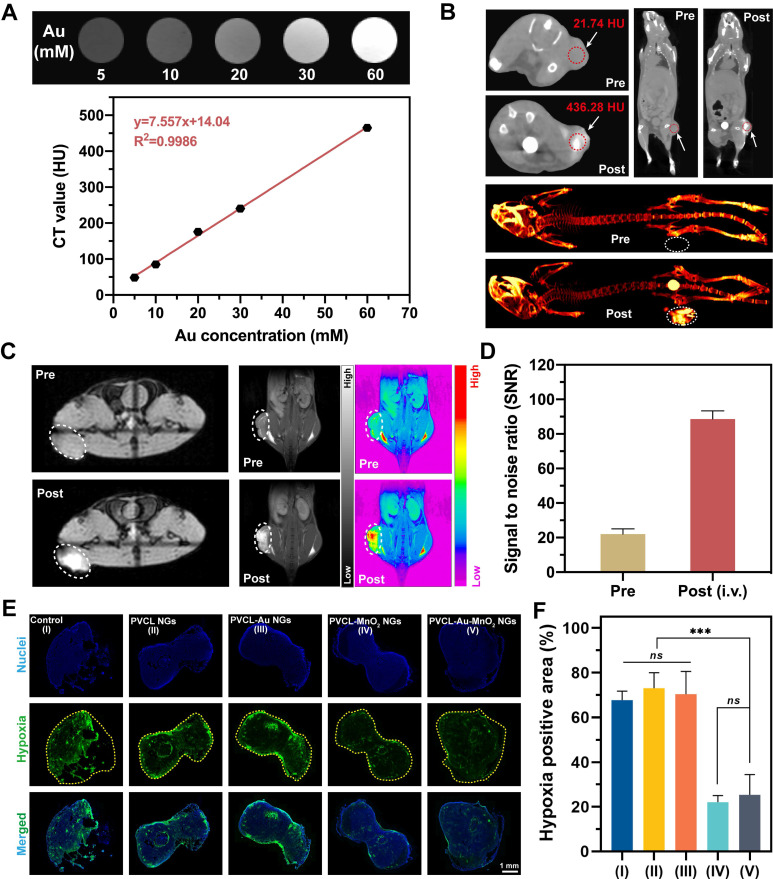
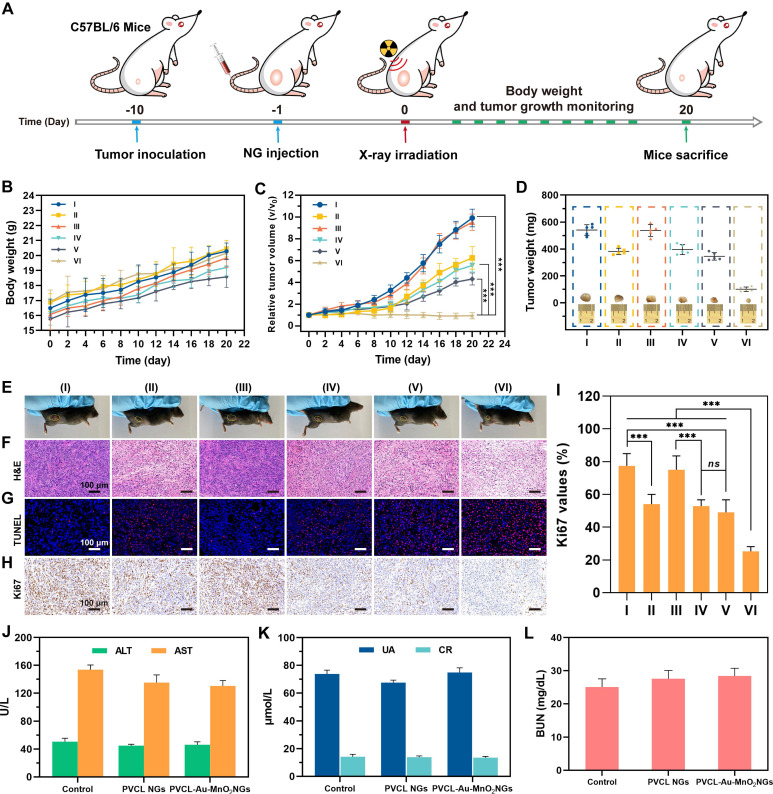
Rationale: Development of intelligent radiosensitization nanoplatforms for imaging-guided tumor radiotherapy (RT) remains challenging. We report here the construction of an intelligent nanoplatform based on poly(N-vinylcaprolactam) (PVCL) nanogels (NGs) co-loaded with gold (Au) and manganese dioxide (MnO2) nanoparticles (NPs) for dual-mode computed tomography (CT)/magnetic resonance (MR) imaging-guided "full-process" sensitized RT of tumors. Methods: PVCL NGs were synthesized via precipitation polymerization and in situ loaded with Au and MnO2 NPs. The created PVCL-Au-MnO2 NGs were well characterized and systematically examined in their cytotoxicity, cellular uptake, intracellular oxygen and ·OH production, and cell cycle arrest in vitro, evaluated to disclose their RT sensitization effects of cancer cells and a tumor model, and assessed to validate their dual-mode CT/MR imaging potential, pharmacokinetics, biodistribution, and biosafety in vivo. Results: The formed PVCL-Au-MnO2 NGs with a size of 121.5 nm and good stability can efficiently generate reactive oxygen species through a Fenton-like reaction to result in cell cycle distribution toward highly radiosensitive G2/M phase prior to X-ray irradiation, sensitize the RT of cancer cells under X-ray through the loaded Au NPs to induce the significant DNA damage, and further prevent DNA-repairing process after RT through the continuous production of O2 catalyzed by MnO2 in the hybrid NGs to relieve the tumor hypoxia. Likewise, the in vivo tumor RT can also be guided through dual mode CT/MR imaging due to the Au NPs and Mn(II) transformed from MnO2 NPs. Conclusion: Our study suggests an intelligent PVCL-based theranostic NG platform that can achieve "full-process" sensitized tumor RT under the guidance of dual-mode CT/MR imaging.

Keywords: Fenton-like reaction; Hybrid PVCL nanogels; full-process sensitization; manganese dioxide; tumor radiotherapy.


Conflict of interest statement

Competing Interests: The authors have declared that no competing interest exists.

Figures

Scheme 1
Scheme 1
Synthesis of Au/MnO2-loaded PVCL NGs for enhanced RT via a full-process radiosensitization.
Figure 1
Figure 1
(A) SEM image of PVCL NGs (inset: digital photo of PVCL NGs dispersed in water). (B) Size distribution histogram of PVCL NGs. TEM images of (C) PVCL-Au NGs and (E) PVCL-Au-MnO2 NGs (insets: digital photos of the corresponding PVCL-Au and PVCL-Au-MnO2 NGs dispersed in water). High-resolution TEM images of (D) PVCL-Au and (F) PVCL-Au-MnO2 NGs. The red dotted circles in (D) show the single Au NPs in NGs. (G) Element mapping TEM images of PVCL-Au-MnO2 NGs. (H) XPS survey spectra of PVCL and PVCL-Au-MnO2 NGs. (I) High-resolution XPS spectrum of PVCL-Au-MnO2 NGs. (J) Hydrodynamic size of PVCL-Au-MnO2 NGs at different KMnO4/Au feeding mass ratios (n = 3). (K) Hydrodynamic size distribution and (L) ζ-potentials of PVCL, PVCL-Au and PVCL-Au-MnO2 NGs (n = 3). (M) Size changes of different NG formulations incubated with PBS containing 10% FBS for 30 days (n = 3).
Figure 2
Figure 2
(A) O2 generation in water, PVCL, PVCL-Au and PVCL-Au-MnO2 NG dispersions (pH 6.5) in the presence of H2O2 (100 μM) as a function of incubation time. (B) Digital photos of (1) water, (2) PVCL NG, (3) PVCL-Au NG and (4) PVCL-Au-MnO2 NG dispersions (pH 6.5) incubated with H2O2 (500 μM) at 0 min (upper panel) and 20 min (bottom panel). (C) Mn2+ release from PVCL-Au-MnO2 NG dispersion containing 100 μM of H2O2 at different pHs (6.5 and 7.4) with or without GSH measured by a Spectroquant® Mn2+ test kit (n = 3). (D) The reaction of blue-colored MB with ·OH to form colorless product (·OH detection). (E) UV-vis spectra and digital photo (inset) of MB treated in different solutions. Fitting of the MB absorbance at 665 nm as a function of (F) H2O2 and (G) Mn2+ concentration. (H) MB degradation by Mn2+-mediated Fenton-like reaction in the presence of GSH at different concentrations (0, 1, 2, 5 and 10 mM, respectively). (I) MB degradation by PVCL-Au-MnO2 NGs in the presence of GSH at different concentrations (0, 0.5, 1, 2, 5 and 10 mM, respectively). (J) MB degradation efficiency of Mn2+ and PVCL-Au-MnO2 NGs in the presence of GSH at different concentrations (1, 2, 5 and 10 mM, respectively, n = 3, and *** represents for p < 0.001).
Figure 3
Figure 3
(A) Hemolysis percentage of red blood cells (RBCs) treated with PVCL-Au-MnO2 NGs at various concentrations for 2 h (n = 3). Inset shows the photograph of RBCs treated with the hybrid NGs at different concentrations, followed by centrifugation. Water and PBS were used as positive and negative controls, respectively. Viability of (B) L929 and (C) Pan02 cells after 24 h of incubation with PVCL, PVCL-Au, PVCL-MnO2 or PVCL-Au-MnO2 NGs (n = 4). (D) Bio-TEM images of Pan02 cells incubated with PVCL-Au-MnO2 NGs for 12 h (red box indicate the internalized NGs). CLSM images of intracellular (E) O2 and (F) ROS generation after 12 h of incubation with different NG formulations at an NG concentration of 200 μg mL-1. (G) Flow cytometric analysis of cell cycle distribution of Pan02 cells in different treatment groups.
Figure 4
Figure 4
(A) Viability of Pan02 cells incubated with different NG formulations under X-ray irradiation (2 or 4 Gy). (B) The corresponding colony formation assay of Pan02 cells treated with different NGs plus 4 Gy of X-ray. (C) Survival fraction of NG-treated Pan02 cells under different doses of X-ray (0, 2, 4, 6 or 8 Gy). (D) SER of each group calculated by the multitarget single-hit model. (E) Flow cytometric assay of Pan02 cells and corresponding percentage of apoptotic cells under different treatments. (F, G) Flow cytometric analysis of ROS level in Pan02 cells after different treatments. The treatments are as follows: (1) PBS, (2) 4 Gy X-ray alone, (3) PVCL-Au NGs plus 4 Gy X-ray, (4) PVCL-MnO2 NGs plus 4 Gy X-ray, and (5) PVCL-Au-MnO2 NGs plus 4 Gy X-ray. In (A, D, E and G), n = 3 for each sample (*** for p < 0.001, ** for p < 0.01, and * for p < 0.05, respectively).
Figure 5
Figure 5
(A) Proposed molecular mechanism for the enhanced cell death triggered by PVCL-Au-MnO2 NGs and X-ray irradiation. Western blot analysis of the expression or phosphorylation of the (B) cleaved caspase-9/-3, (C) AKT and MAPKs signaling, and (D) γ-H2AX as well as p53 in Pan02 cells after incubation with PVCL-Au-MnO2 NGs (200 μg mL-1) with (+) and without (-) X-ray (4 Gy). (E) Change of γ-H2AX foci (green) in cell nuclei (blue) of Pan02 cells treated with PVCL-Au-MnO2 NGs plus X-ray (4 Gy) or by X-ray alone (control). (F) The corresponding γ-H2AX foci density in Pan02 cells at different time points post X-ray irradiation (n = 5, *** for p < 0.001 and ** for p < 0.01, respectively).
Figure 6
Figure 6
(A) In vitro CT images and CT values of PVCL-Au-MnO2 NG aqueous solutions with different Au concentrations. (B) In vivo CT images of Pan02 tumor-bearing mice before and at 24 h post i.v. injection with PVCL-Au-MnO2 NGs ([Au] = 10 mM, in 100 μL of PBS for each mouse). (C) MR imaging of tumor-bearing mice before injection and at 24 h post i.v. administration ([Mn] = 10 mM, in 100 μL of PBS for each mouse) and (D) corresponding MR SNR values of the tumors (n = 3). The tumor sites were circled by white or red dashed line for Panel (B) or (C). (E) Hypoxia-positive immunofluorescence images of tumor slices and (F) quantitative analysis of hypoxia relief in tumor sites (n = 3). The yellow dashed lines indicate the tumor boundaries. *** represents p < 0.001, and ns indicates p > 0.05, respectively.
Figure 7
Figure 7
(A) Schematic illustration of the in vivo RT of tumor-bearing mice. (B) body weight and (C) tumor volume change of mice after different treatments. (D) Average tumor weight in different treatment groups (inset shows graphs of the excised tumor from each group). (E) Representative photographs of tumor-bearing mice in different treatment groups. (F) H&E-, (G) TUNEL- and (H) Ki67-staining photographs of tumor slices from different treatment groups. (I) Corresponding Ki67 values of tumor cells from the treatment groups in (H). (J, K and L) The blood biochemistry analyses of healthy female C57BL/6 mice at 7 days post i.v. injection of PBS, PVCL NGs or PVCL-Au-MnO2 NGs (45 mg mL-1, in 100 μL of PBS for each mouse), respectively (n = 3). The liver function was examined with alanine aminotransferase (ALT) and aspartate aminotransferase (AST), and the kidney function was examined with urea (UA), creatinine (CR) and blood urea nitrogen (BUN). The referred normal ranges for healthy mice from Servicebio, Inc. are as follows: ALT (10.06-96.47 U L-1), AST (36.3-235.48 U L-1), UA (44.42-224.77 μmol L-1), CR (10.91-85.09 μmol L-1) and BUN (10.81-34.74 mg dL-1), respectively. In (B-D, and I), n = 5 for each sample. *** represents p < 0.001, and ns indicates p > 0.05.

Similar articles

Cited by

References

    1. DuRoss AN, Neufeld MJ, Rana S, Thomas CR, Sun C. Integrating nanomedicine into clinical radiotherapy regimens. Adv Drug Deliv Rev. 2019;144:35–56. - PMC - PubMed
    1. Delaney G, Jacob S, Featherstone C, Barton M. The role of radiotherapy in cancer treatment. Cancer. 2005;104:1129–37. - PubMed
    1. Sharma RA, Plummer R, Stock JK, Greenhalgh TA, Ataman O, Kelly S. et al. Clinical development of new drug-radiotherapy combinations. Nat Rev Clin Oncol. 2016;13:627–42. - PubMed
    1. Willers H, Azzoli CG, Santivasi WL, Xia F. Basic mechanisms of therapeutic resistance to radiation and chemotherapy in lung cancer. Cancer J. 2013;19:200–7. - PMC - PubMed
    1. Brown JM, Wilson WR. Exploiting tumour hypoxia in cancer treatment. Nat Rev Cancer. 2004;4:437–47. - PubMed

Publication types