. 2022 Apr 25:10:757042.
doi: 10.3389/fcell.2022.757042. eCollection 2022.

TMPRSS12 Functions in Meiosis and Spermiogenesis and Is Required for Male Fertility in Mice

Affiliations

TMPRSS12 Functions in Meiosis and Spermiogenesis and Is Required for Male Fertility in Mice

Jingjing Zhang et al. Front Cell Dev Biol. .

Abstract

Serine proteases are involved in many physiological activities as initiators of proteolytic cascades, and some members have been reported to play roles in male reproduction. Transmembrane serine protease 12 (TMPRSS12) has been shown to regulate sperm motility and uterotubal junction migration in mice, but its role in the testis remains unknown. In this study, we verified that TMPRSS12 was expressed in the spermatocytes and spermatids of testis and the acrosome of sperm. Mice deficient in Tmprss12 exhibited male sterility. In meiosis, TMPRSS12 was demonstrated to regulate synapsis and double-strand break repair; spermatocytes of Tmprss12 -/- mice underwent impaired meiosis and subsequent apoptosis, resulting in reduced sperm counts. During spermiogenesis, TMPRSS12 was found to function in the development of mitochondria; abnormal mitochondrial structure in Tmprss12 -/- sperm led to reduced availability of ATP, impacting sperm motility. The differential protein expression profiles of testes in Tmprss12 -/- and wild-type mice and further molecule identification revealed potential targets of TMPRSS12 related to meiosis and mitochondrial function. Besides, TMPRSS12 was also found to be involved in a series of sperm functions, including capacitation, acrosome reaction and sperm-egg interaction. These data imply that TMPRSS12 plays a role in multiple aspects of male reproduction.

Keywords: TMPRSS12; male infertility; meiosis; serine protease; spermiogenesis.


Conflict of interest statement

The authors declare that the research was conducted in the absence of any commercial or financial relationships that could be construed as a potential conflict of interest.

Figures

FIGURE 1
FIGURE 1
TMPRSS12 is expressed in testicular spermatocytes and spermatids as well as sperm. (A) Expression of Tmprss12 mRNA in various tissues from adult mice was detected by RT-PCR. TMPRSS12 was specifically expressed in the testis. Actin was used as an internal control. (B) Expression of testicular Tmprss12 mRNA at the indicated time points after birth was examined by RT-PCR, showing that its expression first appeared in 10-day-old mice. Actin was used as an internal control. (C) Western blot of TMPRSS12 from the testes of mice at different weeks of age. TMPRSS12 was observed in 2-week-old mice and continued until adulthood. β-ACTIN was used as an internal control. (D) Immunofluorescence staining of testis sections from adult mice for TMPRSS12 (red), with nuclei counterstained by DAPI (blue). Each image exhibits a stage of the seminiferous epithelial cycle, and they are denoted by Roman numerals at the top of each image. The expression of TMPRSS12 initiated from spermatocytes and remained until step 12 elongated spermatids. Scale bar: 10 µm. (E) Expression of Tmprss12 was examined by RT-PCR using RNA isolated from mouse sperm. Actin was used as an internal control. (F) Western blot of TMPRSS12 in mouse sperm. α-TUBULIN was used as an internal control. (G) Immunofluorescence staining of mouse sperm for TMPRSS12 (red). The nuclei and acrosomes of sperm were labelled with DAPI (blue) and PNA (green), respectively. The images in the upper right corner are enlarged views of the sperm. Scale bar: 20 µm.
FIGURE 2
FIGURE 2
Tmprss12 knockout mice display male sterility. (A) Schematic strategies for the generation of Tmprss12 −/− mice using CRISPR/Cas9 technology. Image of Sanger sequencing results showing a 2-bp deletion in exon 2. (B) Western blot of the testes and sperm from WT and Tmprss12 −/− mice to verify the validation of Tmprss12 knockout. β-ACTIN and α-TUBULIN were used as internal controls. (C) TMPRSS12 expression in the testes of WT and Tmprss12 −/− mice was evaluated through immunofluorescence analysis. No TMPRSS12 signal was detected in Tmprss12 −/− mice. Scale bar: 50 µm. (D) TMPRSS12 expression in the sperm of WT and Tmprss12 −/− mice was determined by immunofluorescence analysis. A positive signal was not observed in Tmprss12 −/− sperm. Scale bar: 20 µm. (E) Number of pups per litter produced by Tmprss12 −/− mice and WT mice. Tmprss12 −/− male mice are infertile (n = 3). Data are the mean ± s.d.
FIGURE 3
FIGURE 3
Tmprss12 knockout mice exhibit oligoasthenospermia, with decreased spermatogenic cells in testes. (A) Computer assisted sperm analysis (CASA) showed that the sperm concentration was reduced and motility and progressive motility were decreased in Tmprss12 −/− mice (n = 3). Data are the mean ± s.d. ∗∗ p < 0.01. (B) Gross morphology of testes from WT and Tmprss12 −/− mice and relative testis weight to body weight in the two groups showed no significant difference (n = 3). Data are the mean ± s.d. (C) The sperm morphology of WT and Tmprss12 −/− mice. The sperm of Tmprss12 −/− mice showed no obvious abnormality. Scale bar: 20 µm. (D) Periodic acid-Schiff staining of testis sections from WT and Tmprss12 −/− mice. Complete spermatogenic tubules and orderly arranged spermatogenic cells could be seen in the testes of Tmprss12 −/− mice. Scale bar: 10 µm. (E) Reduced number of spermatogenic cells in Tmprss12 −/− testes. Numbers of spermatogenic cells per tubule are shown. 10 tubules cross sections for each stage were counted. Compared with the WT, the number of pachytene spermatocytes, diplotene spermatocytes and spermatids of Tmprss12 −/− mice decreased significantly (n = 6). Data are the mean ± s.d. *p < 0.05, **p < 0.01.
FIGURE 4
FIGURE 4
Tmprss12 deletion leads to damaged synapsis and DSB repair in meiosis. (A) Terminal deoxynucleotidyl transferase nick-end-labelling (TUNEL) staining (red) in the testes. Apoptosis in Tmprss12 −/− mice was significantly increased, and the apoptotic cells were mainly spermatocytes. Nuclei are stained with DAPI (blue). Scale bar: 50 µm. (B) Analysis of the apoptotic tubule rate and the number of apoptotic cells per tubule. All spermatogenic tubules from testis sections of the same size in two groups were observed. The data showed increased apoptosis in Tmprss12 −/− mouse testes (n = 3). Data are the mean ± s.d. ∗∗ p < 0.01. (C) Immunofluorescence staining of SYCP1 and SYCP3 on spermatocyte spreads produced from WT and Tmprss12 −/− mouse testes. Chromothripsis (white arrows), no synapsed sex chromosomes (boxed area), and abnormal SYCP1 signals in non-PAR (yellow arrows) were observed in Tmprss12 −/− mice. Scale bars: 10 µm. (D) Percentage of pachynema spermatocytes with abnormal synapses. The quantitative value was increased in Tmprss12 −/− mice (n = 3). Data are the mean ± s.d. p < 0.05. (E) Immunofluorescence staining of SYCP3 and γH2AX on spermatocyte spreads produced from adult WT and Tmprss12 −/− mouse testes. In Tmprss12 −/− images, white arrows indicate chromothripsis, and asterisks indicate the abnormal γH2AX signal. Scale bars: 10 µm. (F) Statistical analysis showing that the percentage of pachytene spermatocytes with abnormal DSB repair was increased compared with that in WT mice (n = 3). Data are the mean ± s.d. p < 0.05.
FIGURE 5
FIGURE 5
Tmprss12 deletion causes increased sperm apoptosis. (A) Fluorescence microscopy observation of sperm after JC-1 staining between WT and Tmprss12 −/− mice. The red fluorescent sperm were normal, and the green sperm had a low mitochondrial membrane potential (MMP). Scale bars: 20 µm. (B) Sperm from WT and Tmprss12 −/− mice stained with JC-1 dye were checked for their corresponding MMP through flow cytometry analysis. Q2, red-stain sperm; Q3, green-stain sperm. Neg and carbonyl cyanide 3-chlorophenylhydrazone (CCCP) were used as a negative control and positive control, respectively. (C) MMP was analysed by the relative ratio of red/green fluorescence. The sperm of Tmprss12 −/− mice showed low MMP levels (n = 3). Data are the mean ± s.d. p < 0.05. (D) Western blot of apoptosis-related molecules from sperm of WT and Tmprss12 −/− mice. α-TUBULIN was used as an internal control. (E) Grey intensity analysis showing the expression level of the above markers. The expression levels of BAX and CASPASE3 were increased while BCL-2 was decreased in Tmprss12 −/− mice (n = 3). Data are the mean ± s.d. p < 0.05.
FIGURE 6
FIGURE 6
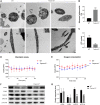
Impaired mitochondrial structure and function in the sperm of Tmprss12 −/− mice. (A) Transmission electron microscopy (TEM) images of the sperm ultrastructure are shown, revealing blurred or absent inner mitochondrial membrane (IMM) cristae (white arrows). The images in the upper right corner of the second row are enlarged views of the mitochondria. Scale bars: 1 µm. (B) Percentage of mitochondria with an abnormal structure. The percentage was increased in Tmprss12 −/− mice (n = 4). Data are the mean ± s.d. ∗∗∗ p < 0.001. (C) Tested ATP contents of sperm between WT and Tmprss12 −/− mice. There were no energy substrates in the sperm isolation buffer and background ATP was consumed before detection. The ATP level was significantly lower in Tmprss12 −/− mice (n = 3). Data are the mean ± s.d. p < 0.05. (D) Glycolysis assay measured as cytoplasmic acidification. Sperm of WT and Tmprss12 −/− mice were extracted from the cauda epididymis and suspended in respiration buffer, followed by glycolysis measurement for 60 min via fluorescent emission. There was no significant difference in glycolysis between sperm of WT and Tmprss12 −/− mice (n = 3). Data are the mean ± s.d. (E) Oxygen consumption analysis. Sperm of WT and Tmprss12 −/− mice were extracted from the cauda epididymis and suspended in PBS. Then fluorescent emission was measured and compared during 60 min via fluorescence spectroscopy. Tmprss12 −/− sperm showed lower oxygen consumption than WT sperm (n = 3). Data are the mean ± s.d. ****p < 0.0001. (F) Western blot of key markers in the mitochondrial electron transfer chain from sperm of WT and Tmprss12 −/− mice. β-ACTIN was used as an internal control. (G) Grey intensity analysis showing the expression level of the above markers. The expression levels of MTATP and MTCYB were decreased in Tmprss12 −/− mice (n = 3). Data are the mean ± s.d. **p < 0.01.
FIGURE 7
FIGURE 7
Mitochondrial development in testicular spermatids was impaired in Tmprss12 knockout mice. (A) Western blot of special molecules involved in spermiogenesis from the testes of WT and Tmprss12 −/− mice. β-ACTIN was used as an internal control. (B) Grey intensity analysis showing that the expression level of KLC3 decreased in Tmprss12 −/− mice (n = 3). Data are the mean ± s.d. p < 0.05.
FIGURE 8
FIGURE 8
Analysis of differential protein expression profiles of testes from WT and Tmprss12 −/− mice. (A) Proteins showing a difference of more than 2-fold were analysed according to IPA (ingenuity pathway analysis), and they were mainly related to meiosis, apoptosis, mitochondrial function and cell adhesion. (B) Verification of the expression levels of some differential proteins related to key events in WT and Tmprss12 −/− mouse testes by western blot. β-ACTIN was used as an internal control. (C) Grey intensity analysis showing the expression level of the above proteins. The results were consistent with the differential expression profiles (n = 3). Data are the mean ± s.d. p < 0.05.

Similar articles

Cited by

References

    1. Akhmanova A., Mausset-Bonnefont A.-L., van Cappellen W., Keijzer N., Hoogenraad C. C., Stepanova T. (2005). The Microtubule Plus-End-Tracking Protein CLIP-170 Associates with the Spermatid Manchette and Is Essential for Spermatogenesis. Genes Dev. 19, 2501–2515. 10.1101/gad.344505 - DOI - PMC - PubMed
    1. Al-Jamea L. H., Woodman A., Heiba N. M., Elshazly S. A., Khalaf N. B., Fathallah D. M., et al. (2021). Genetic Analysis of TMPRSS6 Gene in Saudi Female Patients with Iron Deficiency Anemia. Hematol. Oncol. Stem Cel Ther 14, 41–50. 10.1016/j.hemonc.2020.04.007 - DOI - PubMed
    1. Antalis T. M., Bugge T. H., Wu Q. (2011). Membrane-anchored Serine Proteases in Health and Disease. Prog. Mol. Biol. Transl Sci. 99, 1–50. 10.1016/B978-0-12-385504-6.00001-4 - DOI - PMC - PubMed
    1. Antonsson B., Montessuit S., Lauper S., Eskes R., Martinou J. C. (2000). Bax Oligomerization Is Required for Channel-Forming Activity in Liposomes and to Trigger Cytochrome C Release from Mitochondria. Biochem. J. 345 Pt 2, 271–278. 10.1042/bj3450271 - DOI - PMC - PubMed
    1. Barrett A. J. (2004). Bioinformatics of Proteases in the MEROPS Database. Curr. Opin. Drug Discov. Devel 7, 334–341. - PubMed