

Placental Abnormalities are Associated With Specific Windows of Embryo Culture in a Mouse Model
- PMID: 35547813
- PMCID: PMC9081528
- DOI: 10.3389/fcell.2022.884088
Placental Abnormalities are Associated With Specific Windows of Embryo Culture in a Mouse Model
Abstract
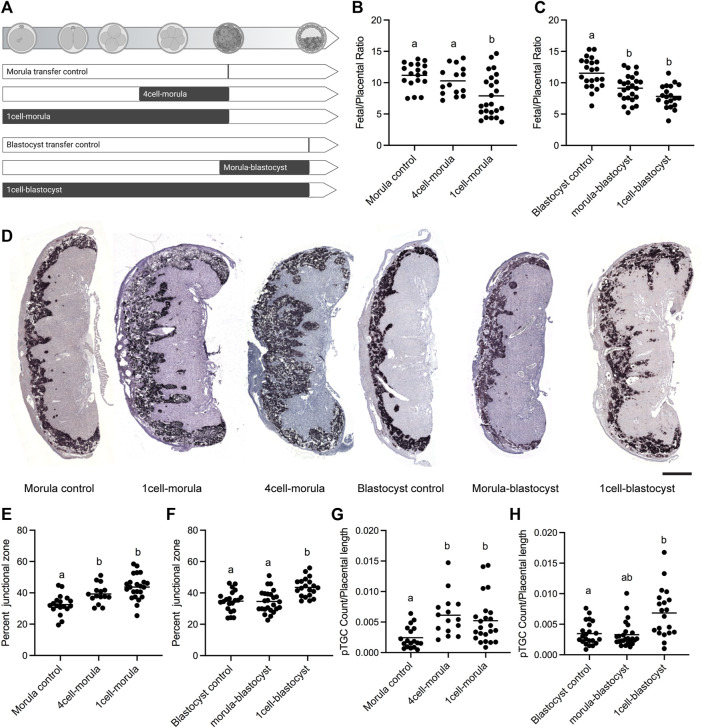
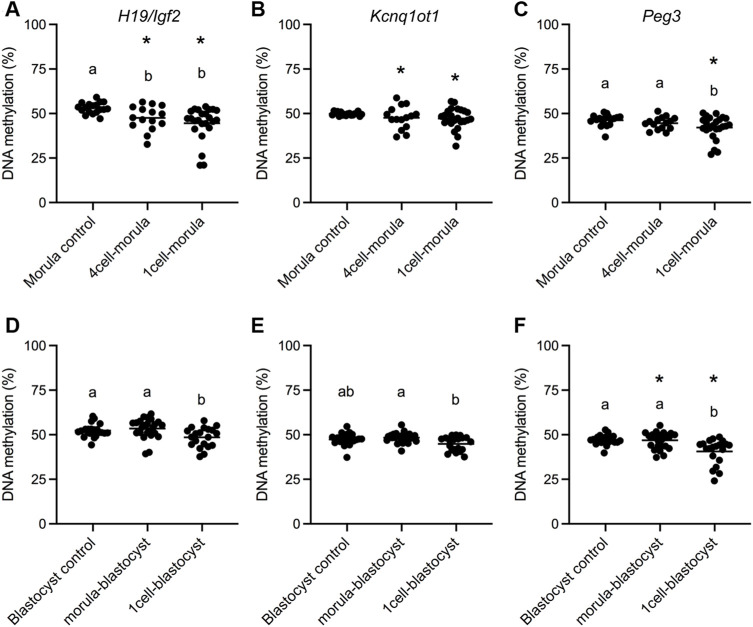
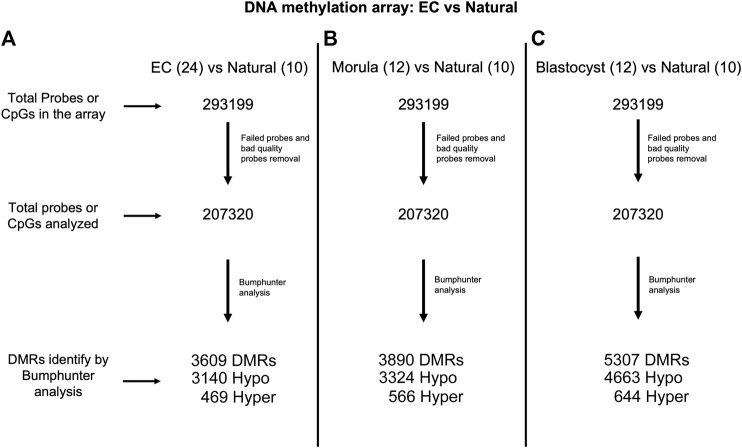
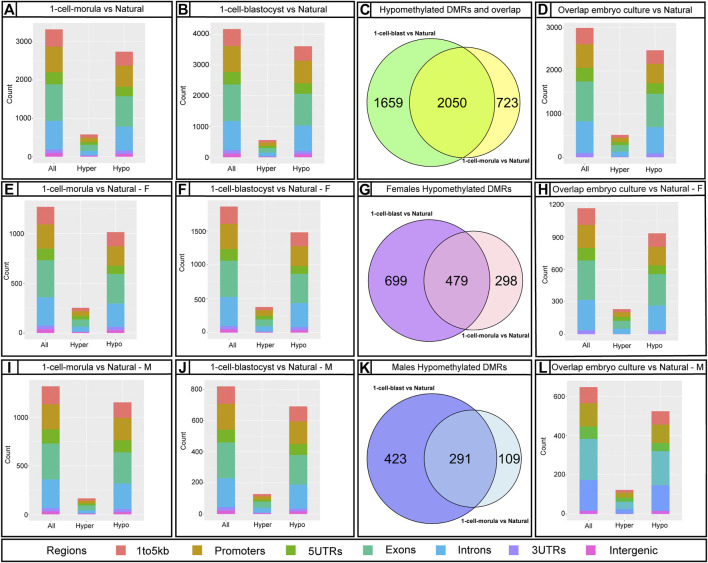
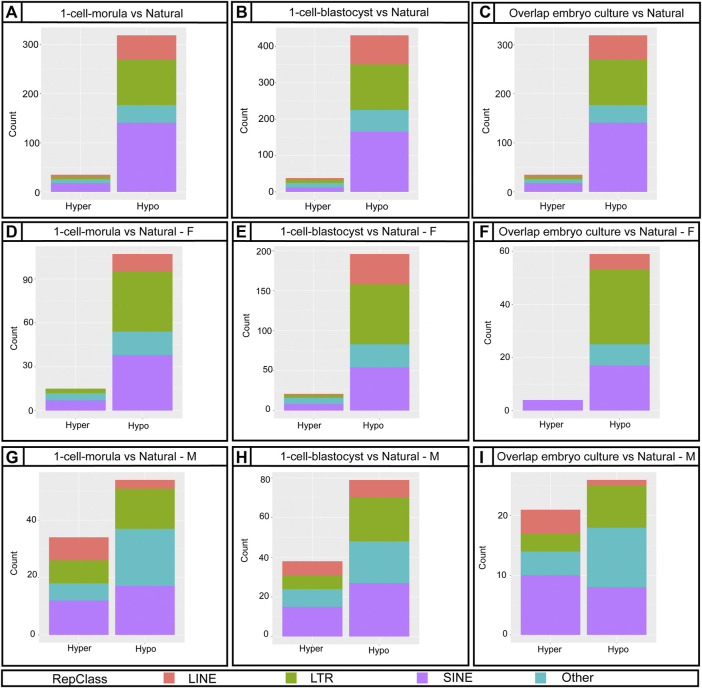
Assisted Reproductive Technologies (ART) employ gamete/embryo handling and culture in vitro to produce offspring. ART pregnancies have an increased risk of low birth weight, abnormal placentation, pregnancy complications, and imprinting disorders. Embryo culture induces low birth weight, abnormal placental morphology, and lower levels of DNA methylation in placentas in a mouse model of ART. Whether preimplantation embryos at specific stages of development are more susceptible to these perturbations remains unresolved. Accordingly, we performed embryo culture for several discrete periods of preimplantation development and following embryo transfer, assessed fetal and placental outcomes at term. We observed a reduction in fetal:placental ratio associated with two distinct windows of preimplantation embryo development, one prior to the morula stage and the other from the morula to blastocyst stage, whereas placental morphological abnormalities and reduced imprinting control region methylation were only associated with culture prior to the morula stage. Extended culture to the blastocyst stage also induces additional placental DNA methylation changes compared to embryos transferred at the morula stage, and female concepti exhibited a higher loss of DNA methylation than males. By identifying specific developmental windows of susceptibility, this study provides a framework to optimize further culture conditions to minimize risks associated with ART pregnancies.
Keywords: assisted reproductive technologies (ART); embryo culture; imprinted gene; perinatal outcome; placenta; preimplantation embryo.
Copyright © 2022 Vrooman, Rhon-Calderon, Suri, Dahiya, Lan, Schultz and Bartolomei.
Conflict of interest statement
The authors declare that the research was conducted in the absence of any commercial or financial relationships that could be construed as a potential conflict of interest.
Figures
Similar articles
-
The cumulative effect of assisted reproduction procedures on placental development and epigenetic perturbations in a mouse model.Hum Mol Genet. 2015 Dec 15;24(24):6975-85. doi: 10.1093/hmg/ddv400. Epub 2015 Sep 23. Hum Mol Genet. 2015. PMID: 26401051 Free PMC article.
-
In vitro culture increases the frequency of stochastic epigenetic errors at imprinted genes in placental tissues from mouse concepti produced through assisted reproductive technologies.Biol Reprod. 2014 Feb 6;90(2):22. doi: 10.1095/biolreprod.113.114785. Print 2014 Feb. Biol Reprod. 2014. PMID: 24337315 Free PMC article.
-
Moderate maternal folic acid supplementation ameliorates adverse embryonic and epigenetic outcomes associated with assisted reproduction in a mouse model.Hum Reprod. 2019 May 1;34(5):851-862. doi: 10.1093/humrep/dez036. Hum Reprod. 2019. PMID: 30989206 Free PMC article.
-
Guidelines for the number of embryos to transfer following in vitro fertilization No. 182, September 2006.Int J Gynaecol Obstet. 2008 Aug;102(2):203-16. doi: 10.1016/j.ijgo.2008.01.007. Int J Gynaecol Obstet. 2008. PMID: 18773532 Review.
-
Preimplantation genetic testing for aneuploidies (abnormal number of chromosomes) in in vitro fertilisation.Cochrane Database Syst Rev. 2020 Sep 8;9(9):CD005291. doi: 10.1002/14651858.CD005291.pub3. Cochrane Database Syst Rev. 2020. PMID: 32898291 Free PMC article.
Cited by
-
Paternal epigenetic influences on placental health and their impacts on offspring development and disease.Front Genet. 2022 Nov 18;13:1068408. doi: 10.3389/fgene.2022.1068408. eCollection 2022. Front Genet. 2022. PMID: 36468017 Free PMC article. Review.
-
Increased Risk of Preeclampsia with Assisted Reproductive Technologies.Curr Hypertens Rep. 2023 Sep;25(9):251-261. doi: 10.1007/s11906-023-01250-8. Epub 2023 Jun 12. Curr Hypertens Rep. 2023. PMID: 37303020 Review.
-
Preconception paternal alcohol exposure decreases IVF embryo survival and pregnancy success rates in a mouse model.Mol Hum Reprod. 2023 Jan 31;29(2):gaad002. doi: 10.1093/molehr/gaad002. Mol Hum Reprod. 2023. PMID: 36637195 Free PMC article.
-
Proteomic and metabolomic insights into oxidative stress response activation in mouse embryos generated by in vitro fertilization.Hum Reprod Open. 2025 Apr 28;2025(2):hoaf022. doi: 10.1093/hropen/hoaf022. eCollection 2025. Hum Reprod Open. 2025. PMID: 40416391 Free PMC article.
-
Trophectoderm biopsy of blastocysts following IVF and embryo culture increases epigenetic dysregulation in a mouse model.Hum Reprod. 2024 Jan 5;39(1):154-176. doi: 10.1093/humrep/dead238. Hum Reprod. 2024. PMID: 37994669 Free PMC article.
References
-
- Bany B. M., Simmons D. G. (2014). 50 – Nonradioactive In Situ Hybridization: Optimization for Tissue Sections from Pregnant Uteri and Placenta during the First Half of Pregnancy. Guide Invest. Mouse Pregnancy 2014, 591–603. 10.1016/B978-0-12-394445-0.00050-3 - DOI
Grants and funding
LinkOut - more resources
Full Text Sources
Molecular Biology Databases