NR4A Family Genes: A Review of Comprehensive Prognostic and Gene Expression Profile Analysis in Breast Cancer
- PMID: 35547878
- PMCID: PMC9082356
- DOI: 10.3389/fonc.2022.777824
NR4A Family Genes: A Review of Comprehensive Prognostic and Gene Expression Profile Analysis in Breast Cancer
Abstract
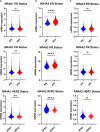
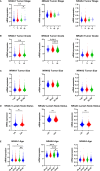
This report analyzes nuclear receptor (NR) subfamily 4A's potential role in treating those diagnosed with breast cancer. Here we reviewed the current literature on NR4 family members. We also examined the relative gene expression of the NR4A receptor subfamily in the basal, HER2 (human epidermal growth factor receptor 2) positive, luminal A, and luminal B subtypes using data from tumor samples in The Cancer Genome Atlas (TCGA) and Molecular Taxonomy of Breast Cancer International Consortium (METABRIC). These data showed a positive link between NR4A1-NR4A3 expression and increased overall survival and relapse-free survival in breast cancer patients. In addition, we observed that high expression of NR4A1, NR4A2, and NR4A3 led to better survival. Furthermore, NR4A family genes seem to play an essential regulatory role in glycolysis and oxidative phosphorylation in breast cancer. The novel prognostic role of the NR4A1-NR4A3 receptors implicates these receptors as important mediators controlling breast cancer metabolic reprograming and its progression. The review establishes a strong clinical basis for the investigation of the cellular, molecular, and physiological roles of NR4A genes in breast cancer.
Keywords: METABRIC; NR4A; TCGA; breast cancer; survival.
Copyright © 2022 Yousefi, Fong and Alahari.
Conflict of interest statement
The authors declare that the research was conducted in the absence of any commercial or financial relationships that could be construed as a potential conflict of interest.
Figures


Similar articles
-
A pan-cancer analysis unveiling the function of NR4A family genes in tumor immune microenvironment, prognosis, and drug response.Genes Genomics. 2024 Aug;46(8):977-990. doi: 10.1007/s13258-024-01539-1. Epub 2024 Jul 8. Genes Genomics. 2024. PMID: 38976216
-
Natural products and synthetic analogs as selective orphan nuclear receptor 4A (NR4A) modulators.Histol Histopathol. 2024 May;39(5):543-556. doi: 10.14670/HH-18-689. Epub 2023 Dec 13. Histol Histopathol. 2024. PMID: 38116863 Free PMC article. Review.
-
The nuclear orphan receptor NR4A1 and NR4A3 as tumor suppressors in hematologic neoplasms.Curr Drug Targets. 2015;16(1):38-46. doi: 10.2174/1389450115666141120112818. Curr Drug Targets. 2015. PMID: 25410408 Review.
-
Altered NR4A Subfamily Gene Expression Level in Peripheral Blood of Parkinson's and Alzheimer's Disease Patients.Neurotox Res. 2016 Oct;30(3):338-44. doi: 10.1007/s12640-016-9626-4. Epub 2016 May 9. Neurotox Res. 2016. PMID: 27159982
-
Parallel expression patterns of NR4A nuclear receptor family genes in the pituitary gland of proestrus rats.J Reprod Dev. 2024 Apr 4;70(2):115-122. doi: 10.1262/jrd.2023-090. Epub 2024 Feb 9. J Reprod Dev. 2024. PMID: 38346724 Free PMC article.
Cited by
-
Therapeutic potential of NR4A1 in cancer: Focus on metabolism.Front Oncol. 2022 Aug 16;12:972984. doi: 10.3389/fonc.2022.972984. eCollection 2022. Front Oncol. 2022. PMID: 36052242 Free PMC article. Review.
-
Integrative analysis of homologous recombination repair patterns unveils prognostic signatures and immunotherapeutic insights in breast cancer.J Appl Genet. 2024 Dec;65(4):823-838. doi: 10.1007/s13353-024-00848-1. Epub 2024 Mar 13. J Appl Genet. 2024. PMID: 38478326 Free PMC article.
-
A pan-cancer analysis unveiling the function of NR4A family genes in tumor immune microenvironment, prognosis, and drug response.Genes Genomics. 2024 Aug;46(8):977-990. doi: 10.1007/s13258-024-01539-1. Epub 2024 Jul 8. Genes Genomics. 2024. PMID: 38976216
-
A novel subtyping method for TNBC with implications for prognosis and therapy.bioRxiv [Preprint]. 2025 Jul 8:2025.07.04.663242. doi: 10.1101/2025.07.04.663242. bioRxiv. 2025. PMID: 40672200 Free PMC article. Preprint.
-
Transcriptomic Profiling of Influenza A Virus-Infected Mouse Lung at Recovery Stage Using RNA Sequencing.Viruses. 2023 Oct 31;15(11):2198. doi: 10.3390/v15112198. Viruses. 2023. PMID: 38005876 Free PMC article.
References
-
- Saha I, Rakshit S, Wlasnowolski M, Plewczyński D. Identification of Epigenetic Biomarkers With the Use of Gene Expression and DNA Methylation for Breast Cancer Subtypes. In: Tencon 2019-2019 Ieee Region 10 Conference (Tencon). Kochi, India: IEEE; (2019).
Publication types
LinkOut - more resources
Full Text Sources
Research Materials
Miscellaneous

