High-resolution lipidomics reveals dysregulation of lipid metabolism in respiratory syncytial virus pneumonia mice
- PMID: 35548018
- PMCID: PMC9084459
- DOI: 10.1039/c8ra05640d
High-resolution lipidomics reveals dysregulation of lipid metabolism in respiratory syncytial virus pneumonia mice
Abstract
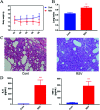
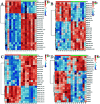
Respiratory syncytial virus (RSV) is a leading viral pathogen responsible for lower respiratory tract infections, particularly in children under five years worldwide, often resulting in hospitalization. At present, the molecular-level interactions between RSV and its host and the underlying mechanisms of RSV-induced inflammation are poorly understood. Herein, we describe an untargeted high-resolution lipidomics platform based on UHPLC-Q-Exactive-MS to assess the lipid alterations of lung tissues and plasma from a mouse model of RSV pneumonia. Untargeted lipidomics using LC-MS with multivariate analysis was applied to describe the lipidomic profiling of the lung tissues and plasma in RSV pneumonia mice. Lipid identification was conducted via an in silico MS/MS LipidBlast library using the MS-DIAL software. We observed distinct compartmental lipid signatures in the mice lung tissues and plasma and significant lipid profile changes between the systematic and localized host responses to RSV. A total of 87 and 68 differential lipids were captured in the mice lung tissue and plasma, respectively, including phospholipids, sphingolipids, acylcarnitine, and fatty acids. Some of these lipids belong to pulmonary surfactants, illustrating that RSV pneumonia-induced aberrations of the pulmonary surfactant system may play a vital role in the etiology of respiratory inflammation. Our findings reveal that the host responses to RSV and various lipid metabolic pathways were linked to disease pathology. Furthermore, our findings could provide mechanistic insights into RSV pneumonia.
This journal is © The Royal Society of Chemistry.
Conflict of interest statement
There are no conflicts to declare.
Figures


Similar articles
-
Integrated untargeted and targeted lipidomics discovers LPE 16:0 as a protector against respiratory syncytial virus infection.J Pharm Biomed Anal. 2024 Nov 15;250:116399. doi: 10.1016/j.jpba.2024.116399. Epub 2024 Aug 6. J Pharm Biomed Anal. 2024. PMID: 39151296
-
Comprehensive Lipidomic and Metabolomic Analysis for Studying Metabolic Changes in Lung Tissue Induced by a Vaccine against Respiratory Syncytial Virus.ACS Infect Dis. 2020 Aug 14;6(8):2130-2142. doi: 10.1021/acsinfecdis.0c00210. Epub 2020 Jul 20. ACS Infect Dis. 2020. PMID: 32633123
-
Integrated Network Pharmacology and Lipidomics to Reveal the Inhibitory Effect of Qingfei Oral Liquid on Excessive Autophagy in RSV-Induced Lung Inflammation.Front Pharmacol. 2021 Dec 1;12:777689. doi: 10.3389/fphar.2021.777689. eCollection 2021. Front Pharmacol. 2021. PMID: 34925035 Free PMC article.
-
Contribution of neuroimmune mechanisms to airway inflammation and remodeling during and after respiratory syncytial virus infection.Pediatr Infect Dis J. 2003 Feb;22(2 Suppl):S66-74; discussion S74-5. doi: 10.1097/01.inf.0000053888.67311.1d. Pediatr Infect Dis J. 2003. PMID: 12671455 Review.
-
New insights on the viral and host factors contributing to the airway pathogenesis caused by the respiratory syncytial virus.Crit Rev Microbiol. 2016 Sep;42(5):800-12. doi: 10.3109/1040841X.2015.1055711. Epub 2015 Jun 29. Crit Rev Microbiol. 2016. PMID: 26119025 Review.
Cited by
-
An Innovative Lipidomic Workflow to Investigate the Lipid Profile in a Cystic Fibrosis Cell Line.Cells. 2020 May 12;9(5):1197. doi: 10.3390/cells9051197. Cells. 2020. PMID: 32408521 Free PMC article.
-
Accumulation of oxysterols in the erythrocytes of COVID-19 patients as a biomarker for case severity.Respir Res. 2023 Aug 23;24(1):206. doi: 10.1186/s12931-023-02515-1. Respir Res. 2023. PMID: 37612691 Free PMC article.
-
Link between serum lipid signature and prognostic factors in COVID-19 patients.Sci Rep. 2021 Nov 4;11(1):21633. doi: 10.1038/s41598-021-00755-z. Sci Rep. 2021. PMID: 34737330 Free PMC article.
-
Carboxylic submetabolome-driven signature characterization of COVID-19 asymptomatic infection.Talanta. 2022 Mar 1;239:123086. doi: 10.1016/j.talanta.2021.123086. Epub 2021 Dec 1. Talanta. 2022. PMID: 34871866 Free PMC article.
-
Insights Gained Into the Treatment of COVID19 by Pulmonary Surfactant and Its Components.Front Immunol. 2022 May 3;13:842453. doi: 10.3389/fimmu.2022.842453. eCollection 2022. Front Immunol. 2022. PMID: 35592339 Free PMC article. Review.
References
-
- Nair H. Nokes D. J. Gessner B. D. Dherani M. Madhi S. A. Singleton R. J. O'Brien K. L. Roca A. Wright P. F. Bruce N. Chandran A. Theodoratou E. Sutanto A. Sedyaningsih E. R. Ngama M. Munywoki P. K. Kartasasmita C. Simoes E. A. Rudan I. Weber M. W. Campbell H. Lancet. 2010;375:1545–1555. doi: 10.1016/S0140-6736(10)60206-1. - DOI - PMC - PubMed
LinkOut - more resources
Full Text Sources

