

Titanium dioxide nanoparticles induce mitochondria-associated apoptosis in HepG2 cells
- PMID: 35548213
- PMCID: PMC9085782
- DOI: 10.1039/c8ra05132a
Titanium dioxide nanoparticles induce mitochondria-associated apoptosis in HepG2 cells
Retraction in
-
Retraction: Titanium dioxide nanoparticles induce mitochondria-associated apoptosis in HepG2 cells.RSC Adv. 2025 Feb 19;15(8):5648. doi: 10.1039/d5ra90014j. eCollection 2025 Feb 19. RSC Adv. 2025. PMID: 39981001 Free PMC article.
Abstract
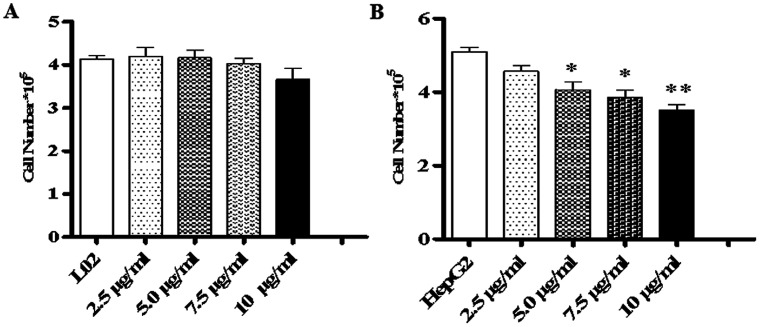
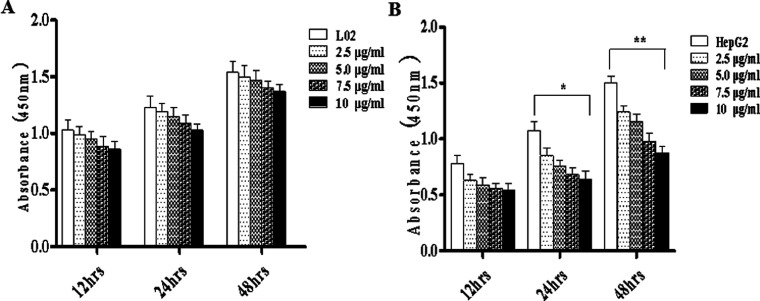
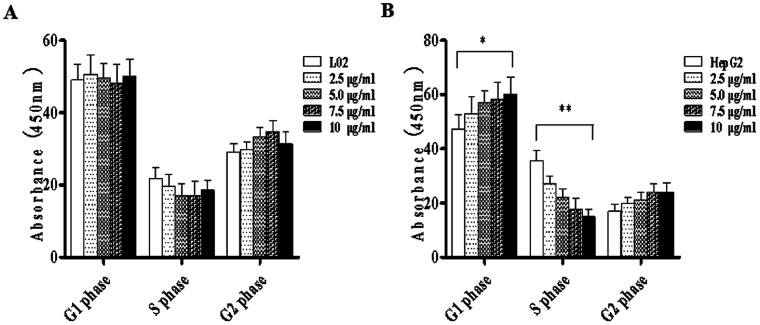
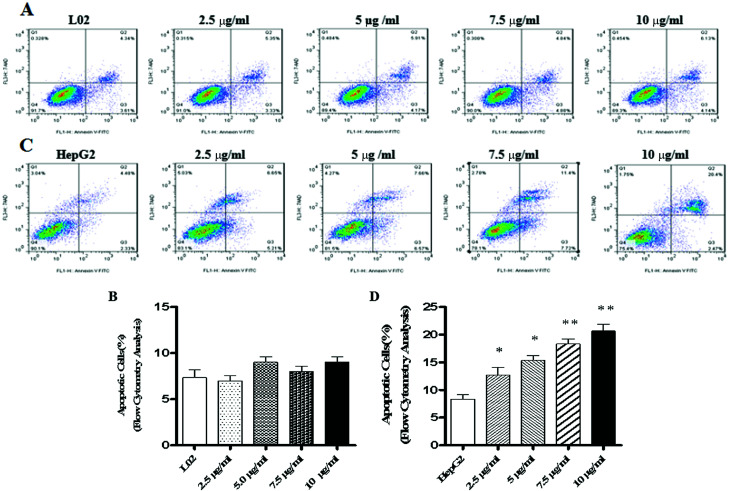
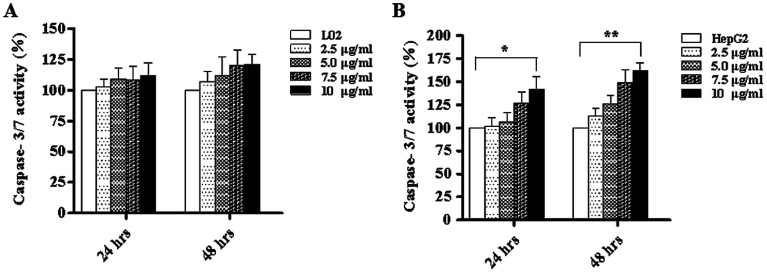
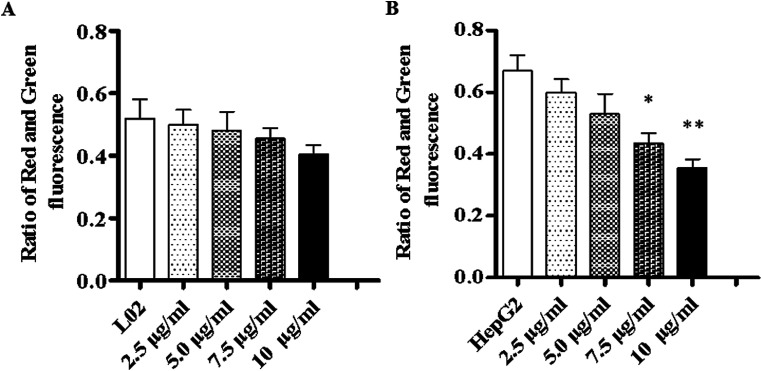
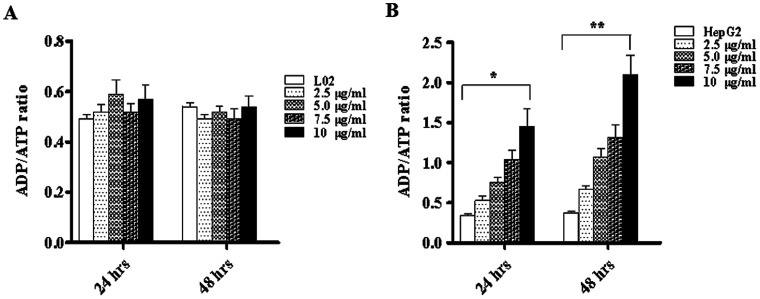
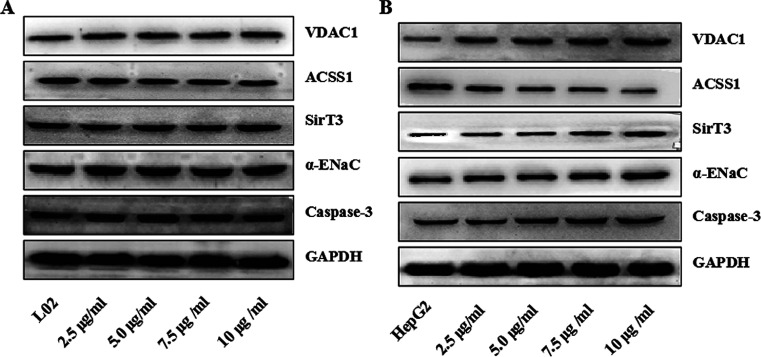
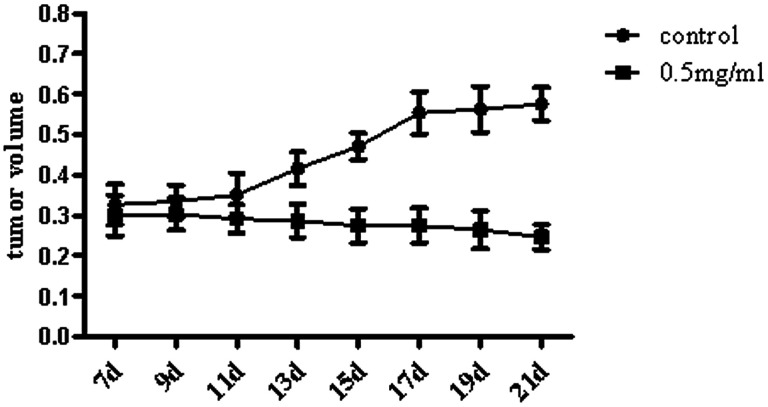
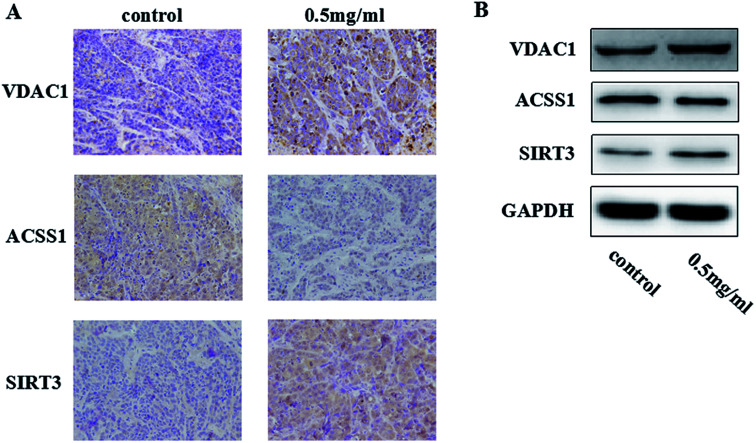
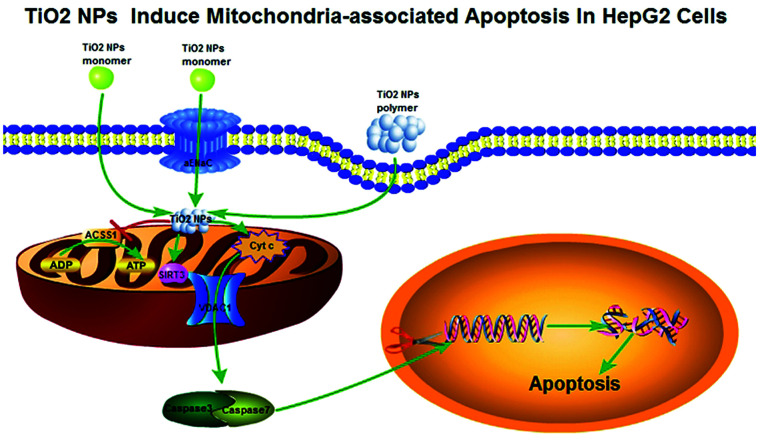
Widespread applications of nanosized materials over the past decade have prompted investigations of desirable properties and potential hazards to humans and the environment. Titanium dioxide (TiO2) nanoparticles are one of the most widely used nanoparticles. To investigate the effect of biological functions induced by TiO2 nanoparticles (10 nm: TiO2 NPs) on human liver cell lines, normal liver cell line L02 and hepatoma cell line HepG2 were co-cultured with exogenous TiO2 NPs. Cell growth and proliferation, cell cycle, and the apoptosis rate were analyzed. The effects of TiO2 NPs on the expression levels of apoptosis-associated protein caspase-3 and the membrane channel protein αENaC and caspase-3/7 activity were determined. Moreover, the influence of TiO2 NPs on the expression levels of the mitochondria-related proteins SIRT3, VDAC1, and ACSS1, the mitochondrial membrane potential and the ADP/ATP ratio were also examined. Our results revealed that TiO2 NPs inhibited the growth and proliferation of HepG2 cells, suppressed the S phase of cell cycling, and induced apoptosis of HepG2 cells. Following an increase in concentration, the inhibitory effect induced by TiO2 NPs on proliferation and cell cycle was more evident, and the apoptosis rate increased in a significant concentration-dependent manner, whereas there was no significant effect on the growth, proliferation, apoptosis, and cell cycle of L02 cells. In addition, the results of western blot showed that in HepG2 cells, TiO2 NPs upregulated the expressions of the apoptosis-related protein caspase-3 and the membrane channel protein αENaC in a concentration-dependent manner. However, in L02 cells, there was no significant difference in the expression levels of caspase-3 or αENaC. Furthermore, TiO2 NPs induced depolarization of the mitochondrial membrane, upregulated the expression levels of the mitochondria-related proteins SIRT3 and VDAC1, and downregulated the expression level of the key respiratory chain protein ACSS1 in HepG2 cells. However, in L02 cells, the expressions of SIRT3, VDAC1, and ACSS1 exhibited no clear change. The apoptosis of HepG2 cells induced by TiO2 NPs may be achieved by regulating intracellular osmotic pressure; moreover, upregulating the expression of the channel protein αENaC or the mitochondrial porin VDAC1 and depolarizing the mitochondrial membrane of HepG2 cells resulted in the loss of Cyt-c and ATP and further activated caspase-3. To further confirm the above results, a nude mouse xenograft model was employed. After a certain period of treatment with TiO2 NPs, the nude mice were sacrificed, tumors were removed, and the expression of related proteins was detected. Immunohistochemistry and western blot results showed that the expressions of the proteins VDAC1 and SIRT3 were clearly upregulated in tissues treated to TiO2 NPs, whereas the expression of ACSS1 was downregulated. The results were consistent with the above in vitro results. All the above results confirmed that TiO2 NPs can act as a safe antitumor agent.
This journal is © The Royal Society of Chemistry.
Conflict of interest statement
The authors declare that there is no conflict of interest.
Figures
Similar articles
-
The ROS Mediates MCUb in Mitochondria-Regulated Apoptosis of TM4 Cells Induced by Titanium Dioxide Nanoparticles.Biol Trace Elem Res. 2025 May;203(5):2760-2775. doi: 10.1007/s12011-024-04339-6. Epub 2024 Aug 27. Biol Trace Elem Res. 2025. PMID: 39192169
-
Single-walled carbon nanohorn aggregates promotes mitochondrial dysfunction-induced apoptosis in hepatoblastoma cells by targeting SIRT3.Int J Oncol. 2018 Sep;53(3):1129-1137. doi: 10.3892/ijo.2018.4459. Epub 2018 Jun 28. Int J Oncol. 2018. PMID: 29956732 Free PMC article.
-
NLRP3 inflammasome, oxidative stress, and apoptosis induced in the intestine and liver of rats treated with titanium dioxide nanoparticles: in vivo and in vitro study.Int J Nanomedicine. 2019 Mar 15;14:1919-1936. doi: 10.2147/IJN.S192382. eCollection 2019. Int J Nanomedicine. 2019. PMID: 30936694 Free PMC article.
-
Cytotoxicity, DNA damage, and apoptosis induced by titanium dioxide nanoparticles in human non-small cell lung cancer A549 cells.Environ Sci Pollut Res Int. 2015 Apr;22(7):5519-30. doi: 10.1007/s11356-014-3717-7. Epub 2014 Oct 24. Environ Sci Pollut Res Int. 2015. PMID: 25339530
-
Titanium Dioxide Nanoparticles Induce Cell Cycle Arrest and Apoptosis through Inhibiting PI3K/AKT/mTOR Pathway in Spermatogonia.Biol Trace Elem Res. 2024 Sep;202(9):4065-4077. doi: 10.1007/s12011-023-03984-7. Epub 2023 Dec 11. Biol Trace Elem Res. 2024. PMID: 38079059
Cited by
-
Hierarchical TiO2 nanotube arrays enhance mesenchymal stem cell adhesion and regenerative potential through surface nanotopography.J R Soc Interface. 2025 Feb;22(223):20240642. doi: 10.1098/rsif.2024.0642. Epub 2025 Feb 26. J R Soc Interface. 2025. PMID: 39999880
-
Facile sonochemically-assisted bioengineering of titanium dioxide nanoparticles and deciphering their potential in treating breast and lung cancers: biological, molecular, and computational-based investigations.RSC Adv. 2024 Mar 14;14(12):8583-8601. doi: 10.1039/d3ra08908h. eCollection 2024 Mar 6. RSC Adv. 2024. PMID: 38487521 Free PMC article.
-
Distinct metabolome and flux responses in the retinal pigment epithelium to cytokines associated with age-related macular degeneration: comparison of ARPE-19 cells and eyecups.Sci Rep. 2025 Apr 15;15(1):13012. doi: 10.1038/s41598-025-93882-w. Sci Rep. 2025. PMID: 40234500 Free PMC article.
-
Prospects of nanoparticle-based radioenhancement for radiotherapy.Mater Horiz. 2023 Oct 2;10(10):4059-4082. doi: 10.1039/d3mh00265a. Mater Horiz. 2023. PMID: 37555747 Free PMC article. Review.
-
Study of mitochondrial swelling, membrane fluidity and ROS production induced by nano-TiO2 and prevented by Fe incorporation.Toxicol Res (Camb). 2019 Jul 24;8(5):711-722. doi: 10.1039/c9tx00143c. eCollection 2019 Sep 1. Toxicol Res (Camb). 2019. PMID: 31588348 Free PMC article.
References
Publication types
LinkOut - more resources
Full Text Sources
Research Materials
Miscellaneous