

Transcriptome Meta-Analysis Associated Targeting Hub Genes and Pathways of Drought and Salt Stress Responses in Cotton (Gossypium hirsutum): A Network Biology Approach
- PMID: 35548277
- PMCID: PMC9083274
- DOI: 10.3389/fpls.2022.818472
Transcriptome Meta-Analysis Associated Targeting Hub Genes and Pathways of Drought and Salt Stress Responses in Cotton (Gossypium hirsutum): A Network Biology Approach
Abstract
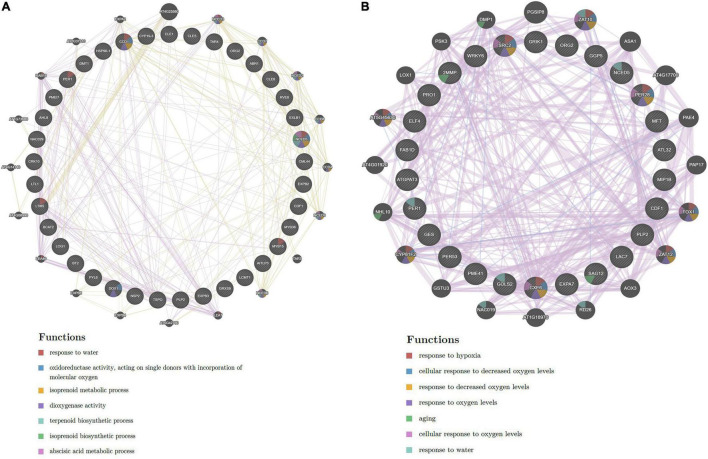
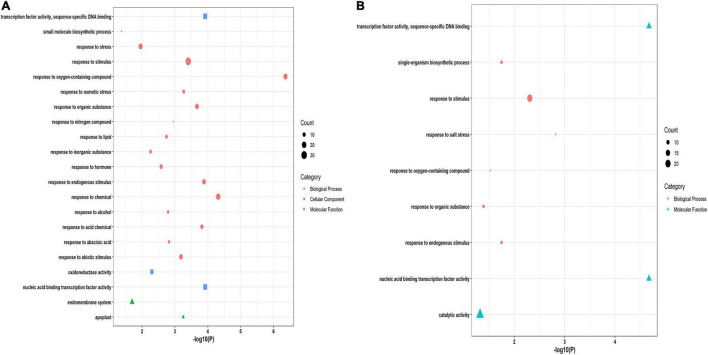
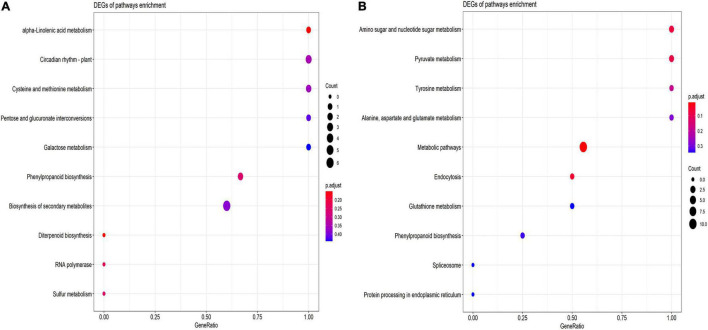
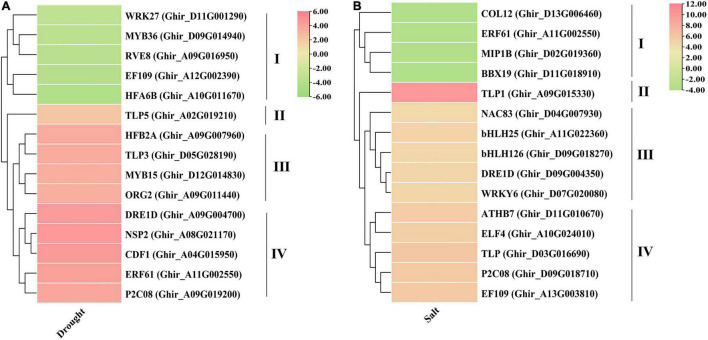
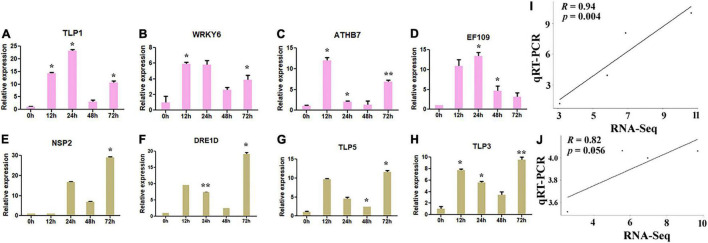
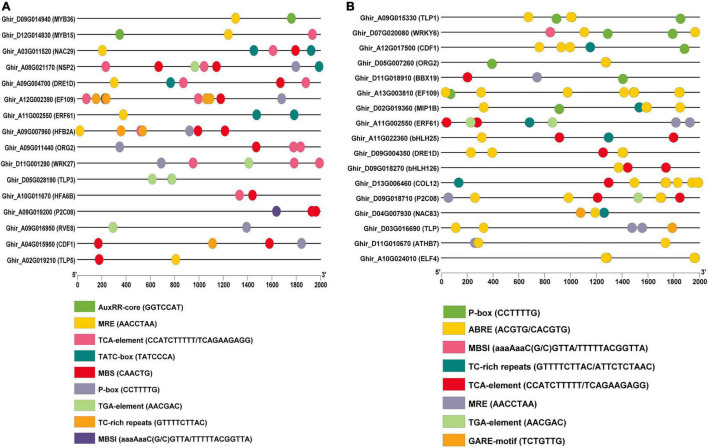
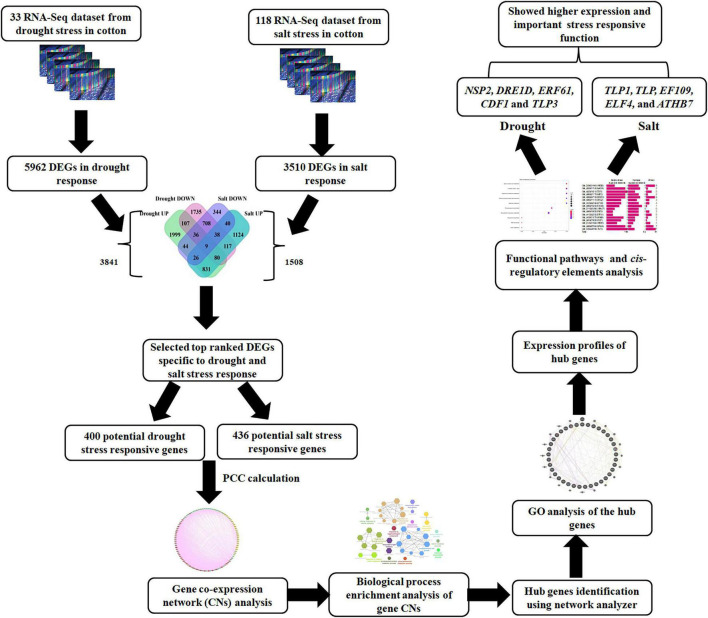
Abiotic stress tolerance is an intricate feature controlled through several genes and networks in the plant system. In abiotic stress, salt, and drought are well known to limit cotton productivity. Transcriptomics meta-analysis has arisen as a robust method to unravel the stress-responsive molecular network in crops. In order to understand drought and salt stress tolerance mechanisms, a meta-analysis of transcriptome studies is crucial. To confront these issues, here, we have given details of genes and networks associated with significant differential expression in response to salt and drought stress. The key regulatory hub genes of drought and salt stress conditions have notable associations with functional drought and salt stress-responsive (DSSR) genes. In the network study, nodulation signaling pathways 2 (NSP2), Dehydration-responsive element1 D (DRE1D), ethylene response factor (ERF61), cycling DOF factor 1 (CDF1), and tubby like protein 3 (TLP3) genes in drought and tubby like protein 1 (TLP1), thaumatin-like proteins (TLP), ethylene-responsive transcription factor ERF109 (EF109), ETS-Related transcription Factor (ELF4), and Arabidopsis thaliana homeodomain leucine-zipper gene (ATHB7) genes in salt showed the significant putative functions and pathways related to providing tolerance against drought and salt stress conditions along with the significant expression values. These outcomes provide potential candidate genes for further in-depth functional studies in cotton, which could be useful for the selection of an improved genotype of Gossypium hirsutum against drought and salt stress conditions.
Keywords: cotton; hub genes; meta-analysis; network; stress.
Copyright © 2022 Bano, Fakhrah, Mohanty and Bag.
Conflict of interest statement
The authors declare that the research was conducted in the absence of any commercial or financial relationships that could be construed as a potential conflict of interest.
Figures
Similar articles
-
Genome-Wide Identification and Evolutionary Analysis of Gossypium Tubby-Like Protein (TLP) Gene Family and Expression Analyses During Salt and Drought Stress.Front Plant Sci. 2021 Jul 21;12:667929. doi: 10.3389/fpls.2021.667929. eCollection 2021. Front Plant Sci. 2021. PMID: 34367198 Free PMC article.
-
Comprehensive analysis of differentially expressed genes and transcriptional regulation induced by salt stress in two contrasting cotton genotypes.BMC Genomics. 2014 Sep 5;15(1):760. doi: 10.1186/1471-2164-15-760. BMC Genomics. 2014. PMID: 25189468 Free PMC article.
-
Functional characterization of Gh_A08G1120 (GH3.5) gene reveal their significant role in enhancing drought and salt stress tolerance in cotton.BMC Genet. 2019 Jul 23;20(1):62. doi: 10.1186/s12863-019-0756-6. BMC Genet. 2019. PMID: 31337336 Free PMC article.
-
GhABF2, a bZIP transcription factor, confers drought and salinity tolerance in cotton (Gossypium hirsutum L.).Sci Rep. 2016 Oct 7;6:35040. doi: 10.1038/srep35040. Sci Rep. 2016. PMID: 27713524 Free PMC article.
-
Cotton GhERF38 gene is involved in plant response to salt/drought and ABA.Ecotoxicology. 2017 Aug;26(6):841-854. doi: 10.1007/s10646-017-1815-2. Epub 2017 May 23. Ecotoxicology. 2017. PMID: 28536792
Cited by
-
The BR signaling pathway regulates primary root development and drought stress response by suppressing the expression of PLT1 and PLT2 in Arabidopsis thaliana.Front Plant Sci. 2023 Jun 27;14:1187605. doi: 10.3389/fpls.2023.1187605. eCollection 2023. Front Plant Sci. 2023. PMID: 37441172 Free PMC article.
-
Genome-Wide Identification, Characterization, and Expression Analysis of Tubby-like Protein (TLP) Gene Family Members in Woodland Strawberry (Fragaria vesca).Int J Mol Sci. 2022 Oct 8;23(19):11961. doi: 10.3390/ijms231911961. Int J Mol Sci. 2022. PMID: 36233267 Free PMC article.
-
Integrated analysis of small RNAs, transcriptome and degradome sequencing reveal the drought stress network in Agropyron mongolicum Keng.Front Plant Sci. 2022 Aug 18;13:976684. doi: 10.3389/fpls.2022.976684. eCollection 2022. Front Plant Sci. 2022. PMID: 36061788 Free PMC article.
-
Advanced Biotechnological Interventions in Mitigating Drought Stress in Plants.Plants (Basel). 2024 Mar 4;13(5):717. doi: 10.3390/plants13050717. Plants (Basel). 2024. PMID: 38475564 Free PMC article. Review.
-
Roles of S-Adenosylmethionine and Its Derivatives in Salt Tolerance of Cotton.Int J Mol Sci. 2023 May 30;24(11):9517. doi: 10.3390/ijms24119517. Int J Mol Sci. 2023. PMID: 37298464 Free PMC article. Review.
References
-
- Abdelraheem A., Thyssen G. N., Fang D. D., Jenkins J. N., McCarty J. C., Wedegaertner T., et al. (2021). GWAS reveals consistent QTL for drought and salt tolerance in a MAGIC population of 550 lines derived from intermating of 11 upland cotton (Gossypium hirsutum) parents. Mol. Genet. Genomics 296 119–129. 10.1007/s00438-020-01733-2 - DOI - PubMed
-
- Abuelsoud W., Hirschmann F., Papenbrock J. (2016). “Sulfur metabolism and drought stress tolerance in plants,” in Drought Stress Tolerance in Plants: Physiology and Biochemistry, Vol. Vol 1 eds Hossain M. A., Wani S. H., Bhattacharjee S., Burritt D. J., Tran L.-S. P. (Berlin: Springer; ), 227–249. 10.1007/978-3-319-28899-4_9 - DOI
-
- Afrin S., Huang J. J., Luo Z. Y. (2015). JA-mediated transcriptional regulation of secondary metabolism in medicinal plants. Sci. Bull. 60 1062–1072. 10.1007/s11434-015-0813-0 - DOI
LinkOut - more resources
Full Text Sources
Molecular Biology Databases
Research Materials