. 2022 Apr 25:13:860682.
doi: 10.3389/fphar.2022.860682. eCollection 2022.

Small Molecule Inhibitor Targeting CDT1/Geminin Protein Complex Promotes DNA Damage and Cell Death in Cancer Cells

Affiliations

Small Molecule Inhibitor Targeting CDT1/Geminin Protein Complex Promotes DNA Damage and Cell Death in Cancer Cells

Nikolaos Karantzelis et al. Front Pharmacol. .

Abstract

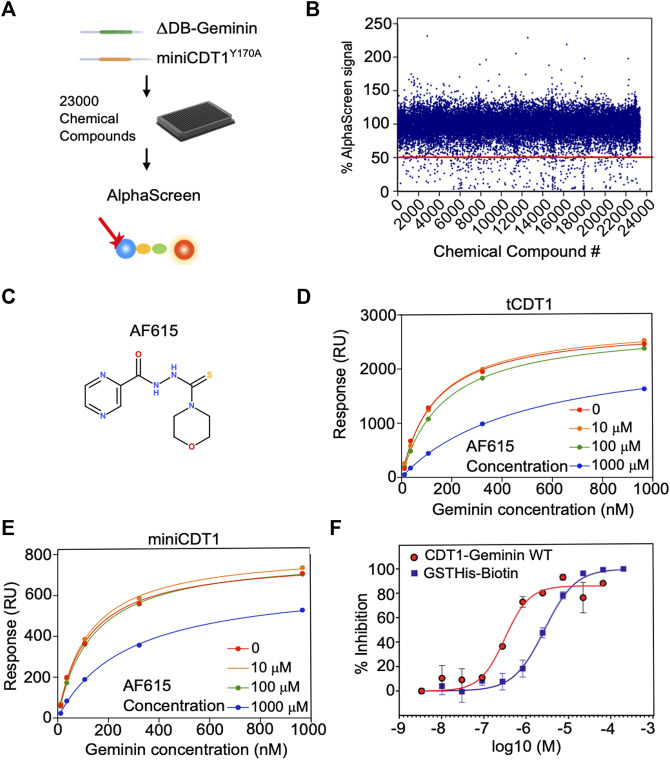
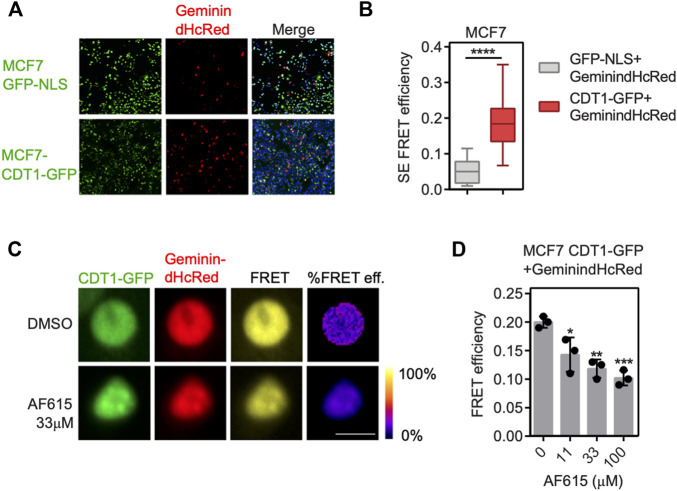
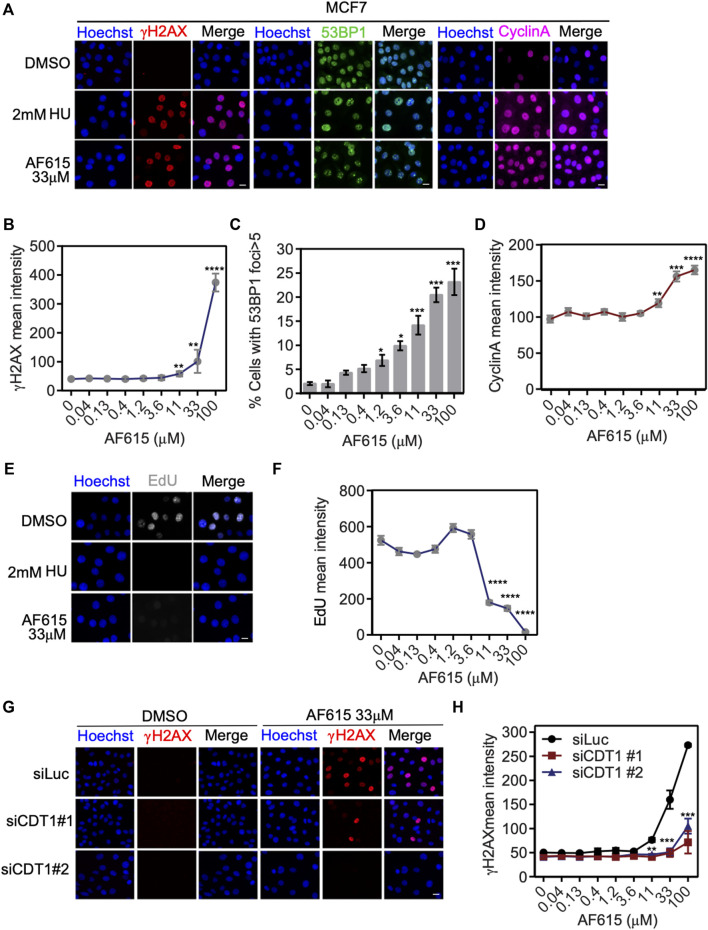
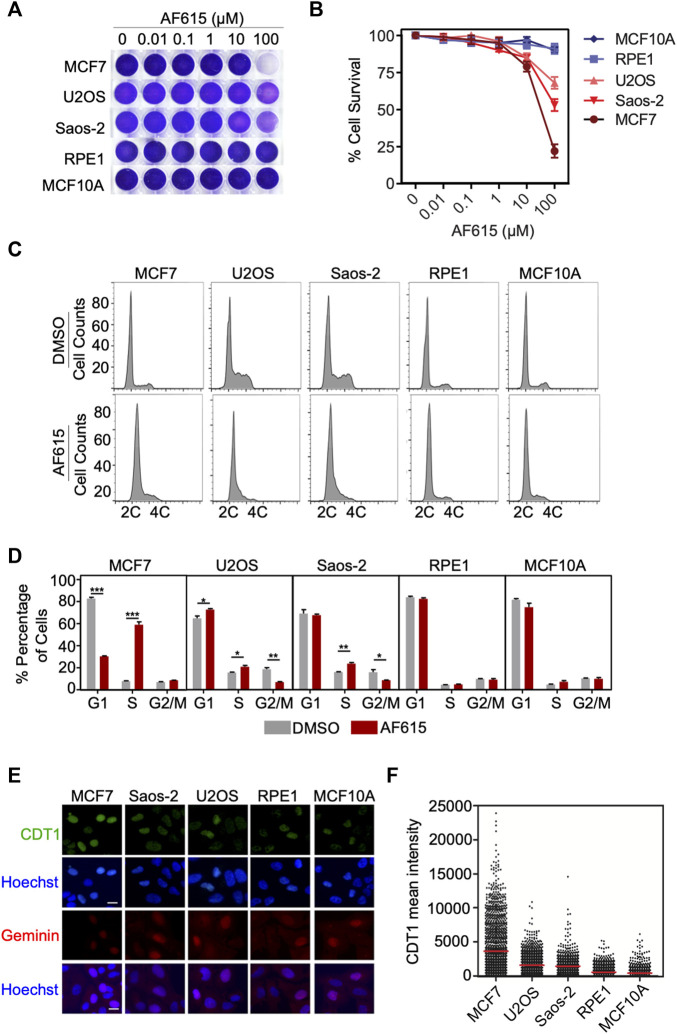
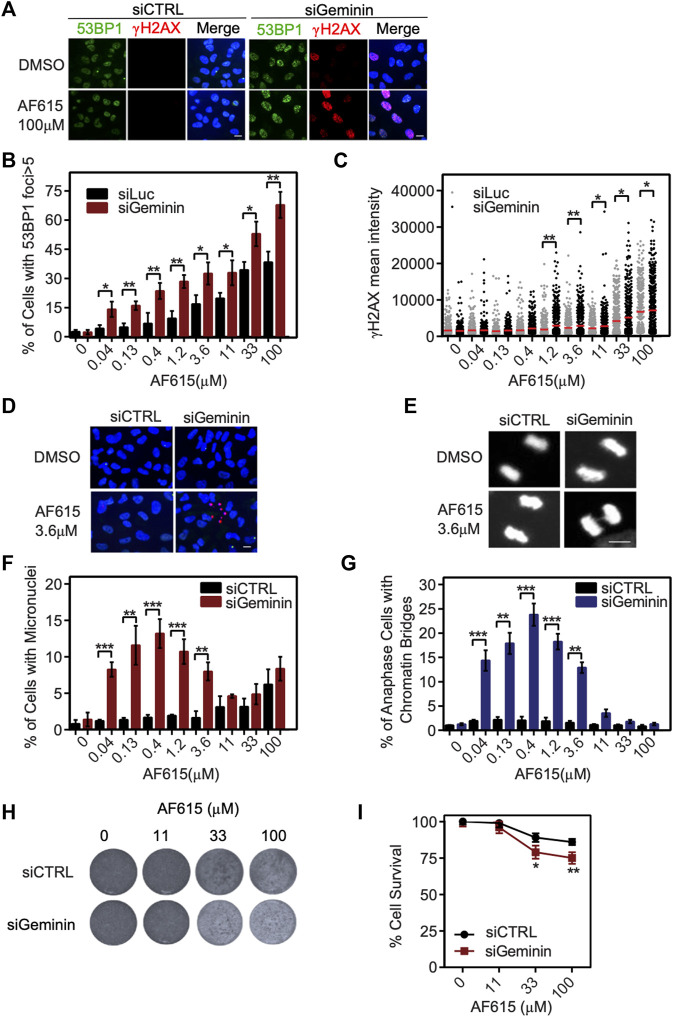
DNA replication initiation requires the loading of MCM2-7 complexes at the origins of replication during G1. Replication licensing renders chromatin competent for DNA replication and its tight regulation is essential to prevent aberrant DNA replication and genomic instability. CDT1 is a critical factor of licensing and its activity is controlled by redundant mechanisms, including Geminin, a protein inhibitor of CDT1. Aberrant CDT1 and Geminin expression have been shown to promote tumorigenesis in vivo and are also evident in multiple human tumors. In this study, we developed an in vitro AlphaScreen™ high-throughput screening (HTS) assay for the identification of small-molecule inhibitors targeting the CDT1/Geminin protein complex. Biochemical characterization of the most potent compound, AF615, provided evidence of specific, dose-dependent inhibition of Geminin binding to CDT1 both in-vitro and in cells. Moreover, compound AF615 induces DNA damage, inhibits DNA synthesis and reduces viability selectively in cancer cell lines, and this effect is CDT1-dependent. Taken together, our data suggest that AF615 may serve as a useful compound to elucidate the role of CDT1/Geminin protein complex in replication licensing and origin firing as well as a scaffold for further medicinal chemistry optimisation.

Keywords: AlphaScreen; CDT1; Geminin; cancer; high-throughput screening; small molecule inhibitor.


Conflict of interest statement

The authors declare that the research was conducted in the absence of any commercial or financial relationships that could be construed as a potential conflict of interest.

Figures

FIGURE 1
FIGURE 1
Chemical compound AF615 disrupts the CDT1-Geminin protein complex in vitro. (A) Schematic representation of the high-throughput screening for the identification of chemical compounds inhibiting the CDT1-Geminin protein interaction complex using AlphaScreen technology. ΔDB-Geminin and miniCDT1Y170A mutant proteins were used as screening targets. (B) In-vitro high-throughput screening for chemical compounds inhibiting the CDT1-Geminin protein-protein interaction. In total 23,360 compounds were screened at a single concentration of 5 μM using a 384-well plate format. Using a selection criterion of >50% signal reduction (solid line), 360 primary “hits” were identified and subjected to further validation. The x-axis represents the different compounds, while the y-axis represents the percentage (%) of AlphaScreen signal, as normalized against the median value of AlphaScreen signal in presence of the compounds arrayed in each plate. (C) Chemical structure of the chemical compound AF615. (D,E) Compound AF615 inhibits Geminin binding to CDT1 in a dose dependent manner. Graphical representation of Surface Plasmon Resonance (SPR) analysis of tCDT1 and miniCDT1 binding to Geminin in the presence of different concentrations of compound AF615. The x-axis represents Geminin concentrations, while the y-axis represents the Response (RU). (F) Inhibition of CDT1-Geminin wild type complex formation in a dose dependent manner in the presence of AF615 using Alphascreen technology. X-axis represents compound concentration on a logarithmic scale, while y-axis represents percentage (%) inhibition. AlphaScreen Signal was determined for each compound concentration in presence of the Geminin/CDT1 wild type complex (red line) and a single fusion protein containing both a GST- and a His-tag (blue line), as a control. Each data point is the mean ± SD from duplicate measurements. Data points were fitted using the non-linear regression function log (inhibitor) versus response variable slope (four parameters).
FIGURE 2
FIGURE 2
Compound AF615 inhibits CDT1-Geminin protein-protein interaction in cancer cells. (A) Representative images of MCF7CDT1-GFP and MCF7GFP-NLS transiently transfected with Geminin-dHcRed for 24 h. (B) Graphical representation of the quantification of SE-FRET efficiency. (C) Representative images of SE-FRET of MCF7CDT1-GFP transfected with Geminin-dHcRed treated for 24 h with 33 μΜ compound AF615. GFP-NLS + Geminin-dHcRed vs. CDT1-GFP + Geminin-dHcRed, ****p < 0.0001. (D) Quantification of the SE-FRET efficiency. Dots represent the mean FRET values of three independent biological repetitions. 0 μΜ AF615 vs. 11 μM AF615, *p < 0.05; 0 μΜ AF615 vs. 33 μM AF615, **p < 0.01; 0 μΜ AF615 vs. 100 μM AF615 ***p < 0.001. Statistical analysis was performed using two-tailed Student’s t-tests. Scale bars: 7 μm.
FIGURE 3
FIGURE 3
Compound AF615 induces DNA damage and blocks DNA synthesis in cancer cells. (A) Representative images of MCF7 cells treated with 33 μΜ compound AF615 for 24 h and immunostained for γH2ΑΧ, 53BP1 and CyclinA. Nuclei were counterstained with Hoechst. Control, 2 mM HU (Hydroxyurea) for 24 h. (B) Quantitative analysis of γH2ΑΧ mean intensity using high-content imaging and high-throughput automated image analysis. Graph depicts the mean γH2ΑΧ intensity of n = 3 biological independent experiments per compound AF615 concentration. (C) Quantification of the percentage of cells with 53BP1 foci (>5 foci per nucleus) per compound AF615 concentration. Graph depicts the mean % percentage of cells with 53BP1 foci of n = 3 biological independent experiments per compound AF615 concentration. (D) Quantitative analysis of CyclinA mean intensity using high-content imaging and high-throughput automated image analysis. Graph depicts the mean CyclinA intensity of n = 3 biological independent experiments per compound AF615 concentration. (E) Representative images of the control, HU (2 mM) and compound AF615 (33 μΜ) treated MCF7 cells labeled with EdU. Nuclei stained with Hoechst. (F) Quantitative analysis of EdU intensity per compound AF615 concentration. Graph depicts the mean EdU intensity of n = 3 biological independent experiments per compound AF615 concentration. (G) Representative images of MCF7 transfected with siRNA for CDT1, treated with 33 μΜ compound AF615 and immunostained for γH2ΑΧ. MCF7 cells transfected with siLuciferase were used as control. (H) Graph represents the quantification of γH2ΑΧ mean intensity from n = 3 biological independent experiments. For all conditions and replicates, at least 2,000 nuclei were analyzed. ****p < 0.0001, ***p < 0.001, **p < 0.01, *p < 0.05. Statistical analysis determined with two-tailed Student’s t-tests. Scale bars: 7 μm.
FIGURE 4
FIGURE 4
Cancer cells exhibit increased sensitivity to chemical compound AF615. (A) Survival assay for MCF7, U2OS, Saos-2, MCF10A, RPE1 cells treated with increasing concentrations of compound AF615 for 3 days. Cells stained with crystal violet. (B) Quantification of cell survival from n = 3 biologically independent experiments. (C) Flow cytometry (FACs) profiles of MCF7, U2OS, Saos-2, MCF10A and RPE1 cells treated with compound AF615 (100 μM) for 24 h. DNA content analysis was performed using propidium iodide (PI). Representative flow cytometry profiles of three biologically independent experiments are shown. 2C and 4C, DNA content of G1 and G2 cells, respectively. (D) Means and SDs (error bars) from n = 3 biologically independent experiments are shown, ***p < 0.001, **p < 0.01, *p < 0.05. Statistical analysis determined with two-tailed Student’s t-tests. (E) Representative images of MCF7, U2OS, Saos-2, MCF10A, RPE1 immunostained for CDT1 and Geminin. Nuclei counterstained with Hoechst. (F) Quantification of CDT1 mean intensity. Scale bars: 7 μm.
FIGURE 5
FIGURE 5
Geminin depletion enhances the potency of chemical compound AF615. (A) Representative images of RPE1 cells transfected with Geminin siRNA, treated with 33 μΜ compound AF615 for 24 h and immunostained for γH2ΑΧ and 53BP1. Nuclei were counterstained with Hoechst. RPE1 cells transfected with siCTRL were used as control. (B) Quantification of the % percentage of cells with 53BP1 foci. Statistical significance determined by two-tailed Student’s t-tests; **p < 0.01; *p < 0.05; n = 3 biologically independent replications. (C) Scatter plot depicts the per cell γH2ΑΧ mean intensity for the different compound AF615 concentrations examined. At least 1,000 cells were analyzed per condition and per experimental replicate. Statistical significance determined with Mann–Whitney U-tests; **p < 0.01; *p < 0.05; n = 3 biologically independent replications. (D) Representative images of micronuclei detected in RPE1 cells transfected with Geminin siRNA and treated with compound AF615 for 24 h. (E) Representative images showing chromatin bridges in anaphase cells following depletion of Geminin and treatment with compound AF615. (F) Graphical representation of the % percentage of cells harboring micronuclei. Means and SDs (error bars) from n = 3 biologically independent experiments are shown, ***p < 0.001, **p < 0.01. Statistical analysis determined with two-tailed Student’s t-tests. (G) Quantification of the % percentage of anaphase cells having chromatin bridges. Means and SDs (error bars) from n = 3 biologically independent experiments are shown, ***p < 0.001, **p < 0.01. Statistical analysis determined with two-tailed Student’s t-tests. (H) Crystal violet staining of cell survival upon treatment with AF615 in RPE1 cells transfected with Geminin and CTRL siRNAs. (I) Survival curves of RPE1 cells treated with increased concentrations of compound AF615 (0, 11, 33, and 100 μΜ). n = 3 biologically independent experiments per compound concentration. Scale bars: 7 μm.

Similar articles

Cited by

References

    1. Blow J. J., Gillespie P. J. (2008). Replication Licensing and Cancer-Aa Fatal Entanglement? Nat. Rev. Cancer 8, 799–806. 10.1038/nrc2500 - DOI - PMC - PubMed
    1. Bravou V., Nishitani H., Song S. Y., Taraviras S., Varakis J. (2005). Expression of the Licensing Factors, Cdt1 and Geminin, in Human colon Cancer. Int. J. Oncol. 27, 1511–1518. 10.3892/ijo.27.6.1511 - DOI - PubMed
    1. Champeris Tsaniras S., Kanellakis N., Symeonidou I. E., Nikolopoulou P., Lygerou Z., Taraviras S. (2014). Licensing of DNA Replication, Cancer, Pluripotency and Differentiation: an Interlinked World? Semin. Cell Dev. Biol. 30, 174–180. 10.1016/j.semcdb.2014.03.013 - DOI - PubMed
    1. Champeris Tsaniras S., Villiou M., Giannou A. D., Nikou S., Petropoulos M., Pateras I. S., et al. (2018). Geminin Ablation In Vivo Enhances Tumorigenesis through Increased Genomic Instability. J. Pathol. 246, 134–140. 10.1002/path.5128 - DOI - PubMed
    1. Cheung-Ong K., Giaever G., Nislow C. (2013). DNA-damaging Agents in Cancer Chemotherapy: Serendipity and Chemical Biology. Chem. Biol. 20, 648–659. 10.1016/j.chembiol.2013.04.007 - DOI - PubMed