

FUCCI-Based Live Imaging Platform Reveals Cell Cycle Dynamics and Identifies Pro-proliferative Compounds in Human iPSC-Derived Cardiomyocytes
- PMID: 35548410
- PMCID: PMC9081338
- DOI: 10.3389/fcvm.2022.840147
FUCCI-Based Live Imaging Platform Reveals Cell Cycle Dynamics and Identifies Pro-proliferative Compounds in Human iPSC-Derived Cardiomyocytes
Abstract
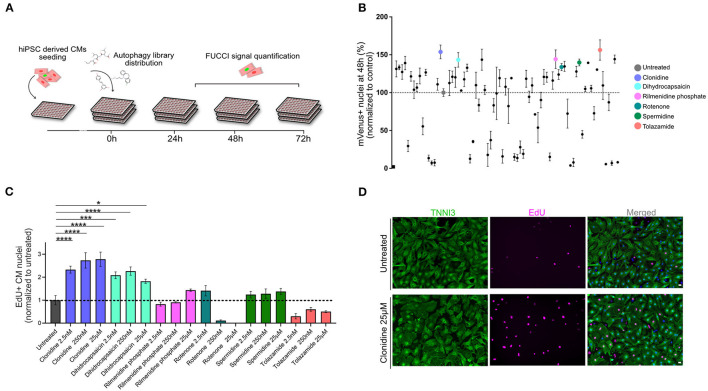
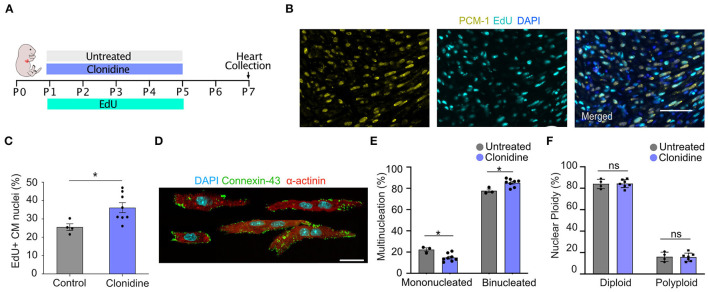
One of the major goals in cardiac regeneration research is to replace lost ventricular tissue with new cardiomyocytes. However, cardiomyocyte proliferation drops to low levels in neonatal hearts and is no longer efficient in compensating for the loss of functional myocardium in heart disease. We generated a human induced pluripotent stem cell (iPSC)-derived cardiomyocyte-specific cell cycle indicator system (TNNT2-FUCCI) to characterize regular and aberrant cardiomyocyte cycle dynamics. We visualized cell cycle progression in TNNT2-FUCCI and found G2 cycle arrest in endoreplicating cardiomyocytes. Moreover, we devised a live-cell compound screening platform to identify pro-proliferative drug candidates. We found that the alpha-adrenergic receptor agonist clonidine induced cardiomyocyte proliferation in vitro and increased cardiomyocyte cell cycle entry in neonatal mice. In conclusion, the TNNT2-FUCCI system is a versatile tool to characterize cardiomyocyte cell cycle dynamics and identify pro-proliferative candidates with regenerative potential in the mammalian heart.
Keywords: cardiomyocyte; cell cycle activity; cell cycle indicator; clonidine; fluorescence ubiquitination cell cycle indicator; induced pluripotent stem cell; polyploidy.
Copyright © 2022 Murganti, Derks, Baniol, Simonova, Trus, Neumann, Khattak, Guan and Bergmann.
Conflict of interest statement
The authors declare that the research was conducted in the absence of any commercial or financial relationships that could be construed as a potential conflict of interest.
Figures


Similar articles
-
Live cell screening identifies glycosides as enhancers of cardiomyocyte cell cycle activity.Front Cardiovasc Med. 2022 Sep 26;9:901396. doi: 10.3389/fcvm.2022.901396. eCollection 2022. Front Cardiovasc Med. 2022. PMID: 36225954 Free PMC article.
-
Cell cycle visualization tools to study cardiomyocyte proliferation in real-time.Open Biol. 2024 Oct;14(10):240167. doi: 10.1098/rsob.240167. Epub 2024 Oct 9. Open Biol. 2024. PMID: 39378987 Free PMC article. Review.
-
Cardiomyocyte cell cycle dynamics and proliferation revealed through cardiac-specific transgenesis of fluorescent ubiquitinated cell cycle indicator (FUCCI).J Mol Cell Cardiol. 2019 Feb;127:154-164. doi: 10.1016/j.yjmcc.2018.12.007. Epub 2018 Dec 18. J Mol Cell Cardiol. 2019. PMID: 30571978 Free PMC article.
-
Identification and characterization of distinct cell cycle stages in cardiomyocytes using the FUCCI transgenic system.Exp Cell Res. 2021 Nov 15;408(2):112880. doi: 10.1016/j.yexcr.2021.112880. Epub 2021 Oct 14. Exp Cell Res. 2021. PMID: 34655601
-
Meis1 Regulates Postnatal Cardiomyocyte Cell Cycle Arrest.2016 Jun 25. In: Nakanishi T, Markwald RR, Baldwin HS, Keller BB, Srivastava D, Yamagishi H, editors. Etiology and Morphogenesis of Congenital Heart Disease: From Gene Function and Cellular Interaction to Morphology [Internet]. Tokyo: Springer; 2016. Chapter 11. 2016 Jun 25. In: Nakanishi T, Markwald RR, Baldwin HS, Keller BB, Srivastava D, Yamagishi H, editors. Etiology and Morphogenesis of Congenital Heart Disease: From Gene Function and Cellular Interaction to Morphology [Internet]. Tokyo: Springer; 2016. Chapter 11. PMID: 29787104 Free Books & Documents. Review.
Cited by
-
Revitalizing the heart: strategies and tools for cardiomyocyte regeneration post-myocardial infarction.NPJ Regen Med. 2025 Jan 22;10(1):6. doi: 10.1038/s41536-025-00394-2. NPJ Regen Med. 2025. PMID: 39843488 Free PMC article. Review.
-
Recent advances in regulating the proliferation or maturation of human-induced pluripotent stem cell-derived cardiomyocytes.Stem Cell Res Ther. 2023 Aug 30;14(1):228. doi: 10.1186/s13287-023-03470-w. Stem Cell Res Ther. 2023. PMID: 37649113 Free PMC article. Review.
-
Live cell screening identifies glycosides as enhancers of cardiomyocyte cell cycle activity.Front Cardiovasc Med. 2022 Sep 26;9:901396. doi: 10.3389/fcvm.2022.901396. eCollection 2022. Front Cardiovasc Med. 2022. PMID: 36225954 Free PMC article.
-
Cell cycle visualization tools to study cardiomyocyte proliferation in real-time.Open Biol. 2024 Oct;14(10):240167. doi: 10.1098/rsob.240167. Epub 2024 Oct 9. Open Biol. 2024. PMID: 39378987 Free PMC article. Review.
-
Fluorescent biosensors illuminate the spatial regulation of cell signaling across scales.Biochem J. 2023 Oct 31;480(20):1693-1717. doi: 10.1042/BCJ20220223. Biochem J. 2023. PMID: 37903110 Free PMC article. Review.
References
LinkOut - more resources
Full Text Sources
Research Materials
Miscellaneous