. 2022 Apr 25:9:871852.
doi: 10.3389/fcvm.2022.871852. eCollection 2022.

Hydrogen Peroxide Scavenging Restores N-Type Calcium Channels in Cardiac Vagal Postganglionic Neurons and Mitigates Myocardial Infarction-Evoked Ventricular Arrhythmias in Type 2 Diabetes Mellitus

Affiliations

Hydrogen Peroxide Scavenging Restores N-Type Calcium Channels in Cardiac Vagal Postganglionic Neurons and Mitigates Myocardial Infarction-Evoked Ventricular Arrhythmias in Type 2 Diabetes Mellitus

Dongze Zhang et al. Front Cardiovasc Med. .

Abstract

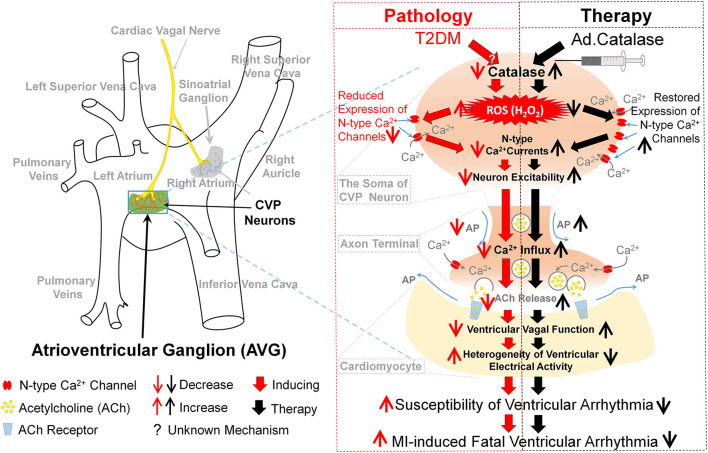
Objective: Withdrawal of cardiac vagal activity is associated with ventricular arrhythmia-related high mortality in patients with type 2 diabetes mellitus (T2DM). Our recent study found that reduced cell excitability of cardiac vagal postganglionic (CVP) neurons is involved in cardiac vagal dysfunction and further exacerbates myocardial infarction (MI)-evoked ventricular arrhythmias and mortality in T2DM. However, the mechanisms responsible for T2DM-impaired cell excitability of CVP neurons remain unclear. This study tested if and how elevation of hydrogen peroxide (H2O2) inactivates CVP neurons and contributes to cardiac vagal dysfunction and ventricular arrhythmogenesis in T2DM.

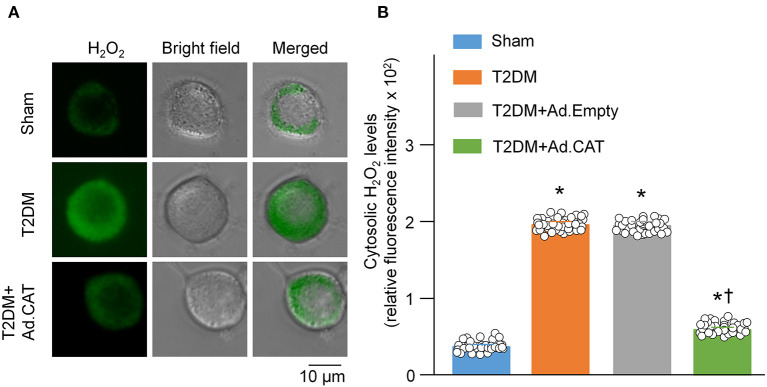
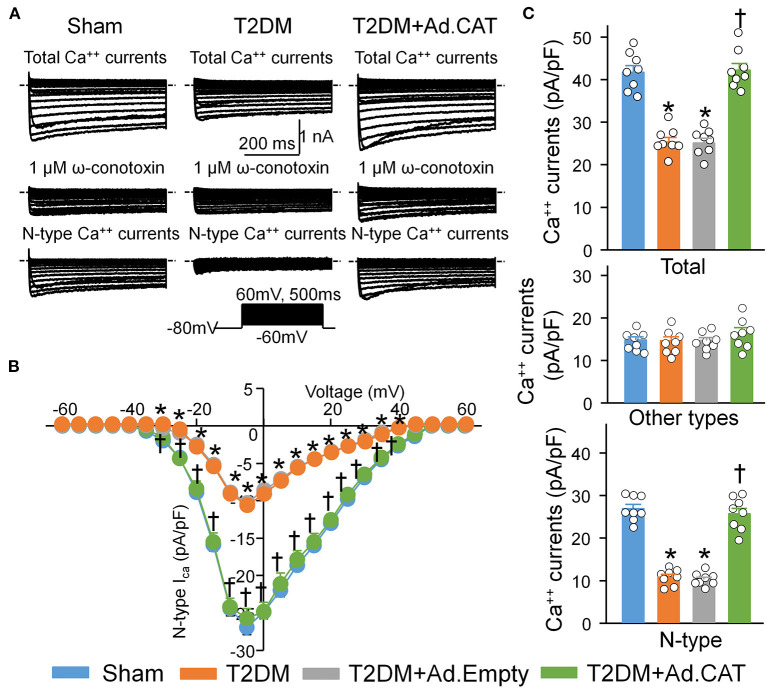
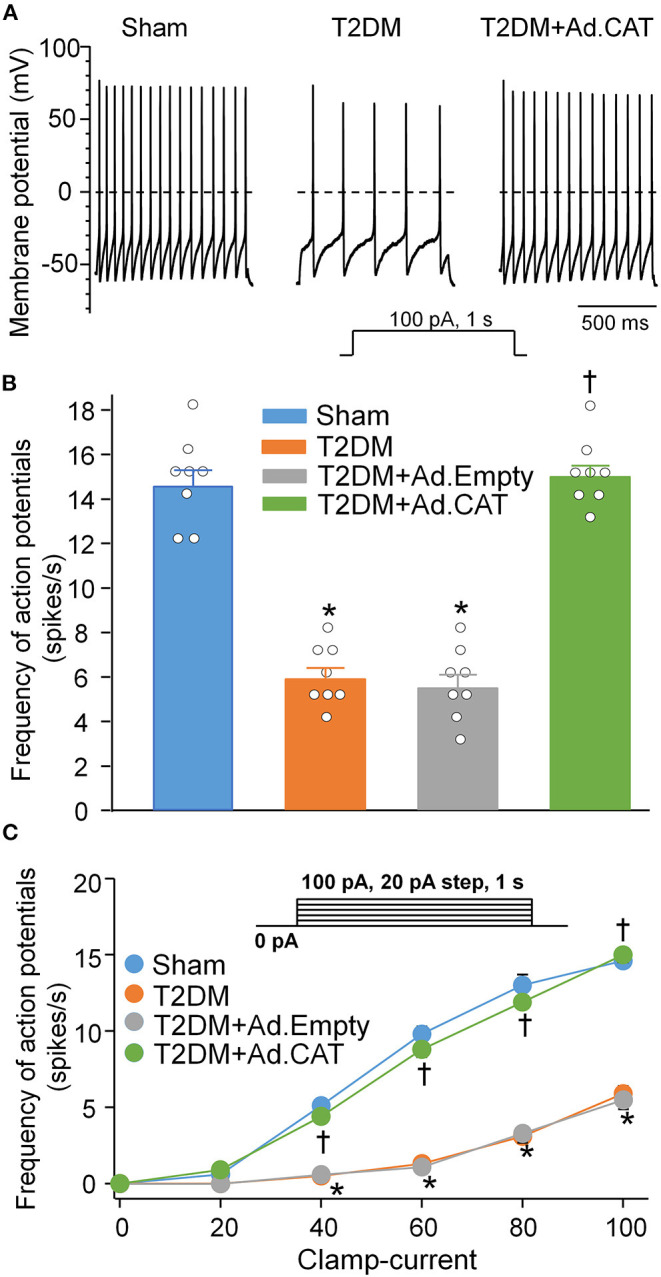
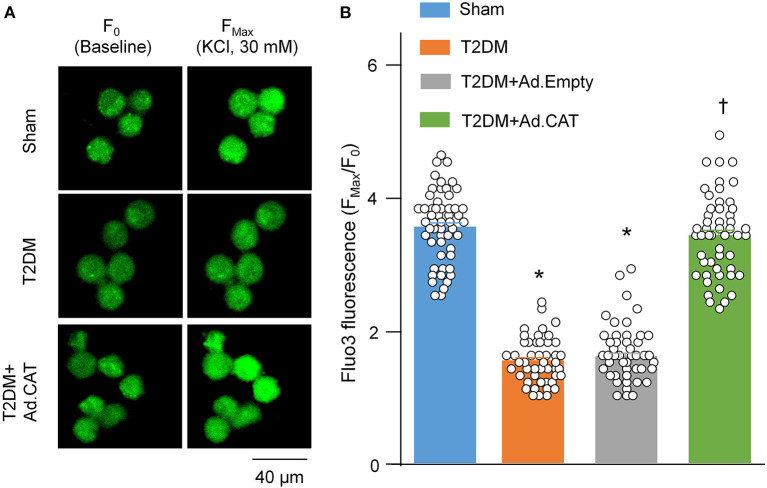
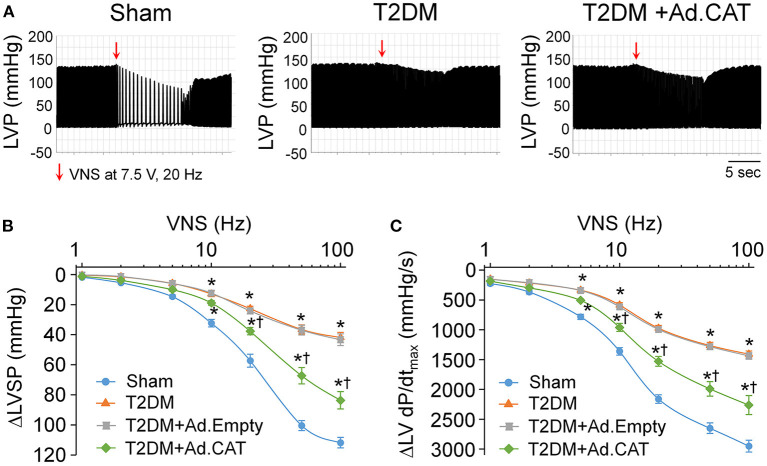
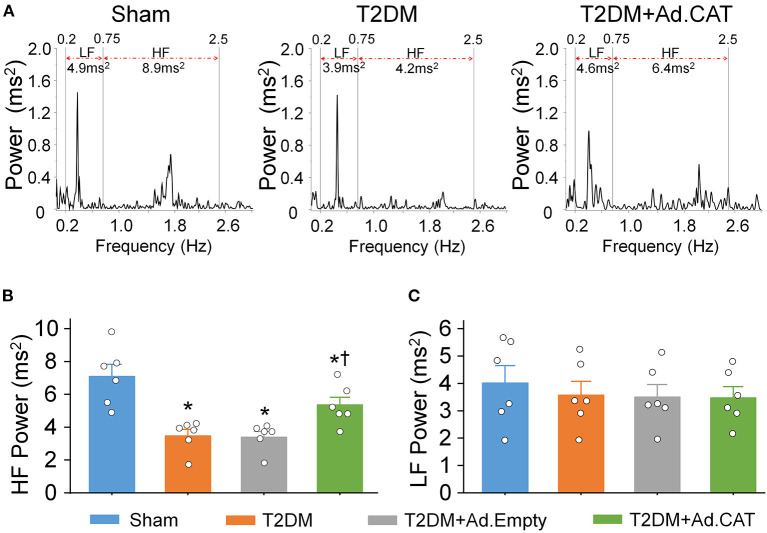
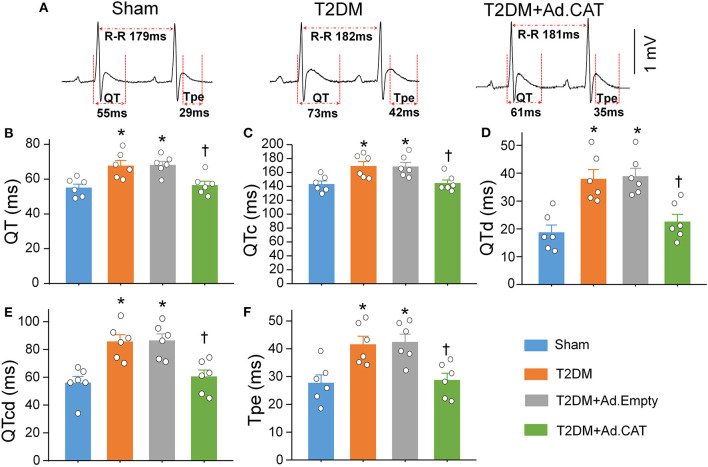
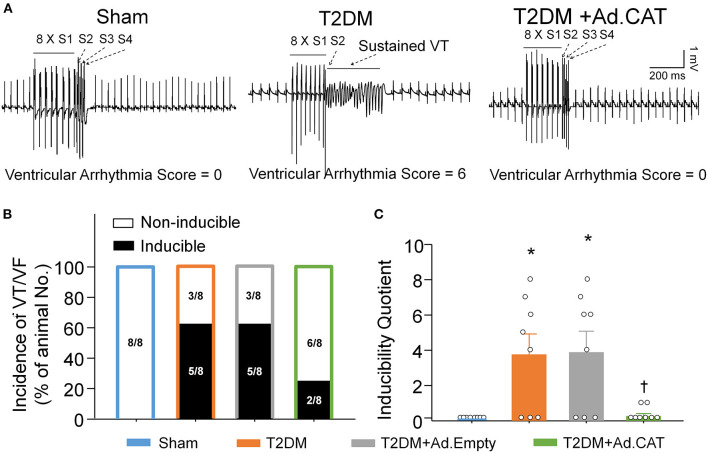
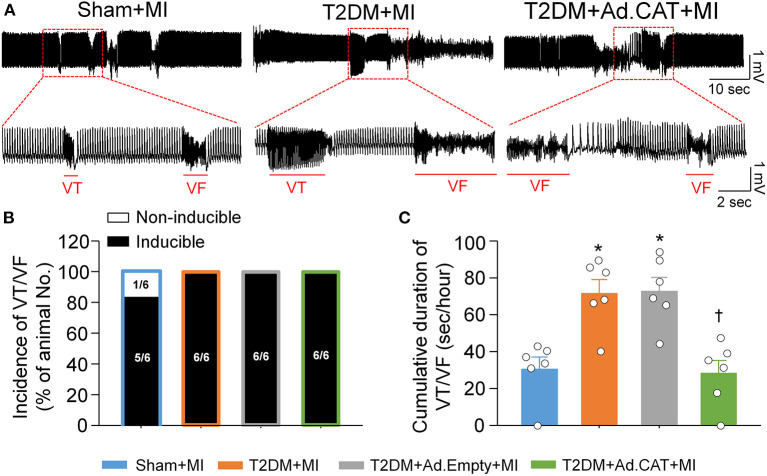
Methods and results: Rat T2DM was induced by a high-fat diet plus streptozotocin injection. Local in vivo transfection of adenoviral catalase gene (Ad.CAT) successfully induced overexpression of catalase and subsequently reduced cytosolic H2O2 levels in CVP neurons in T2DM rats. Ad.CAT restored protein expression and ion currents of N-type Ca2+ channels and increased cell excitability of CVP neurons in T2DM. Ad.CAT normalized T2DM-impaired cardiac vagal activation, vagal control of ventricular function, and heterogeneity of ventricular electrical activity. Additionally, Ad.CAT not only reduced the susceptibility to ventricular arrhythmias, but also suppressed MI-evoked lethal ventricular arrhythmias such as VT/VF in T2DM.

Conclusions: We concluded that endogenous H2O2 elevation inhibited protein expression and activation of N-type Ca2+ channels and reduced cell excitability of CVP neurons, which further contributed to the withdrawal of cardiac vagal activity and ventricular arrhythmogenesis in T2DM. Our current study suggests that the H2O2-N-type Ca2+ channel signaling axis might be an effective therapeutic target to suppress ventricular arrhythmias in T2DM patients with MI.

Keywords: calcium channel; cardiac vagal neuron; hydrogen peroxide; myocardial infarction; type 2 diabetes; ventricular arrhythmia.


Conflict of interest statement

The authors declare that the research was conducted in the absence of any commercial or financial relationships that could be construed as a potential conflict of interest.

Figures

Figure 1
Figure 1
Overexpression of catalase in CVP neurons reduced intracellular H2O2 levels in T2DM rats. (A) Representative images of cytosolic H2O2 levels in isolated CVP neurons from sham, T2DM, and T2DM+Ad.CAT rats, measured by detecting fluorescence intensity of pHyPer-cyto (green color, a H2O2 sensor). (B) Quantitative data showing fluorescence intensity of pHyPer-cyto in CVP neurons in all groups. N = 40 neurons from 6 rats per group; data are means ± SEM. Statistical significance was determined by one-way ANOVA with post-hoc Bonferroni test. *P < 0.05 vs. sham; P < 0.05 vs. T2DM.
Figure 2
Figure 2
Effect of Ad.CAT gene transfection on protein expression of catalase and N-type Ca2+ channels (Cav2.2-α) in CVP neurons in T2DM. (A) Raw images and (B) quantitative data showing protein expression of catalase in CVP neurons from all groups of rats, measured by revers–phase protein microarray. (C) Representative images and (D) quantitative data showing protein expression of Cav2.2-α in the CVP neurons from all groups of rats. N = 24 measurements from 6 rats per group. (E) Catalase activity measured in all groups. N = 6 rats per group. Ad.CAT gene transfection significantly increased T2DM-reduced catalase activity, and protein expression of catalase and Cav2.2-α in CVP neurons. Data are means ± SEM. Statistical significance was determined by one-way ANOVA with post-hoc Bonferroni test. *P < 0.05 vs. sham; P < 0.05 vs. T2DM.
Figure 3
Figure 3
Reduction of the H2O2 levels through transfection of Ad.CAT gene increased T2DM-reduced N-type Ca2+ currents in CVP neurons in T2DM rats. BaCl2 replaced CaCl2 in the extracellular solution for Ca2+ current recording. (A) Original whole-cell patch-clamp recording of Ca2+ currents from sham, T2DM, and T2DM+Ad.CAT rats. (B) Current-voltage (I–V) curve of N-type Ca2+ currents in CVP neurons from all groups of rats. (C) Quantitative data of total Ca2+ currents, other types of Ca2+ currents, and N-type Ca2+ currents elicited by 500-ms test pulse at 0 mV from holding potential of −80 mV in CVP neurons from all groups. ω-conotoxin GVIA, a specific N-type Ca2+ channel blocker, was used to block the N-type Ca2+ channel. N-type Ca2+ currents were obtained by subtracting Ca2+ currents under treatment of ω-conotoxin GVIA from total Ca2+ currents. N = 8 neurons from 6 rats per group; data are means ± SEM. Statistical significance was determined by two-way repeated measures ANOVA with post-hoc Bonferroni test for data presented in (B). Statistical significance was determined by one-way ANOVA with post-hoc Bonferroni test for data presented in (C). *P < 0.05 vs. sham; P < 0.05 vs. T2DM.
Figure 4
Figure 4
In vivo transfection of Ad.CAT gene restored T2DM-reduced cell excitability of CVP neurons in T2DM rats. (A) Original recording of action potentials (APs) in CVP neurons from sham, T2DM, and T2DM+Ad.CAT rats. (B,C) Quantitative data for the frequency of APs in CVP neurons from all groups. The frequency of APs was measured in a 1-s current clamp with a current injection of 100 pA. N = 8 neurons from 6 rats per group; data are means ± SEM. Statistical significance was determined by one-way ANOVA with post-hoc Bonferroni test for data presented in (B). Statistical significance was determined by two-way repeated measures ANOVA with post-hoc Bonferroni test for data presented in (C). *P < 0.05 vs. sham; P < 0.05 vs. T2DM.
Figure 5
Figure 5
In vivo transfection of Ad.CAT gene restored T2DM-decreased intracellular Ca2+ levels in CVP neurons from T2DM rats. (A) Raw images of fluo-3/AM (green color, a calcium indicator) in isolated CVP neurons from sham, T2DM, and T2DM+Ad.CAT rats, in which the fluorescent image was captured by a confocal microscope before (F0) and during KCl (30 mM) stimulation at 30 s (FMax). (B) Mean data for the fluorescence intensity of fluo-3/AM in isolated CVP neurons from all groups of rats. N = 60 neurons from 6 rats per group; data are means ± SEM. Statistical significance was determined by one-way ANOVA with post-hoc Bonferroni test. *P < 0.05 vs. sham; P < 0.05 vs. T2DM.
Figure 6
Figure 6
Effect of Ad.CAT gene transfection into CVP neurons on vagal control of ventricular function in T2DM rats, which was determined by changes of the left ventricular systolic pressure (LVSP) and the maximum rate of increase of left ventricular pressure (LV dP/dtmax) in response to different frequencies of left vagal efferent nerve stimulation (VNS) in anesthetized rats. (A) Representative recordings demonstrating changes of the LVSP in response to 7.5 V, 20 Hz of VNS in sham, T2DM, and T2DM+Ad.CAT rats. (B,C) Quantitative data for changes of the LVSP (B) and LV dP/dtmax (C) in response to different frequencies (1–100 Hz) of VNS in all groups of rats. In vivo Ad.CAT gene transfection into CVP neurons significantly improved T2DM-blunted vagal control of ventricular function. N = 6 rats per group; data are means ± SEM. Statistical significance was determined by two-way repeated measures ANOVA with post-hoc Bonferroni test. *P < 0.05 vs. sham; P < 0.05 vs. T2DM.
Figure 7
Figure 7
In vivo transfection of Ad.CAT gene into CVP neurons improved T2DM-attenuated cardiac vagal activation, measured by the power spectral analysis of heart rate variability (HRV) in conscious rats. (A) Representative tracings of HRV analyzed from 24-h ECG recording in sham, T2DM, and T2DM+Ad.CAT rats. Spectral power was quantified for LF from 0.2 to 0.75 Hz and HF from 0.75 to 2.5 Hz. (B,C) Quantitative data of HF (B) and LF (C) from all groups of conscious rats. N = 6 rats per group; data are means ± SEM. Statistical significance was determined by one-way ANOVA with post-hoc Bonferroni test. *P < 0.05 vs. sham; P < 0.05 vs. T2DM.
Figure 8
Figure 8
Reduction of intracellular H2O2 levels in CVP neurons attenuated the heterogeneity of ventricular electrical activities in conscious T2DM rats. (A) Representative tracings for QT and Tpe intervals in sham, T2DM, and T2DM+Ad.CAT rats. (B–F) Quantitative data for QT interval (B), QTc interval (C), QT dispersion (D), QTc dispersion (E), and Tpe (F) in all experimental groups. N = 6 rats per group; data are means ± SEM. Statistical significance was determined by one-way ANOVA with post-hoc Bonferroni test. *P < 0.05 vs. sham; P < 0.05 vs. T2DM.
Figure 9
Figure 9
Effect of Ad.CAT gene transfection into CVP neurons on susceptibility to ventricular tachyarrhythmia in anesthetized T2DM rats. (A) Raw data for PES-evoked VT/VF in anesthetized sham, T2DM, and T2DM+Ad.CAT rats. (B,C) Mean data for incidence (B) and inducibility quotient (C) of PES-evoked VT/VF in all groups of rats. Ad.CAT gene transfection into CVP neurons markedly decreased the inducibility quotient of PES-evoked VT/VF in T2DM rats. N = 8 rats per group; data are means ± SEM. Statistical significance was determined by Fisher exact test for the incidence of VT/VF and one-way ANOVA with post-hoc Bonferroni test for inducibility quotient of VT/VF. *P < 0.05 vs. sham; P < 0.05 vs. T2DM.
Figure 10
Figure 10
In vivo transfection of Ad.CAT gene into CVP neurons suppressed myocardial infarction (MI)-evoked ventricular arrhythmias in conscious T2DM rats. (A) Raw ECG recordings of VT/VF in conscious sham, T2DM, and T2DM+Ad.CAT rats. (B,C) Mean data for incidence (B) and cumulative duration of VT/VF (C) in all groups of conscious rats. N = 6 rats per group; data are means ± SEM. Statistical significances in the incidence of VT/VF and cumulative duration of VT/VF were determined by Fisher exact test and one-way ANOVA with post-hoc Bonferroni test, respectively. *P < 0.05 vs. sham; P < 0.05 vs. T2DM.
Figure 11
Figure 11
Contribution of endogenous H2O2 elevation in CVP neurons to ventricular arrhythmogenesis and related therapeutic strategy in T2DM. In the T2DM state, the oxidative stress, as evidenced by endogenous H2O2 elevation and lowered catalase occurred in CVP neurons. Consequently, endogenous H2O2 elevation reduced the neuronal excitability through reduction of the N-type Ca2+ channel expression and activation. H2O2 overproduction in CVP neurons further attenuated the cardiac vagal activation and enhanced the susceptibility to ventricular arrhythmogenesis, including the inducibility of ventricular arrhythmias in anesthetized rats and MI-evoked ventricular arrhythmias in conscious rats. Reduction of cytosolic H2O2 levels in the AVG through in vivo Ad.CAT gene transfection markedly increased T2DM-reduced expression and activation of N-type Ca2+ channels, intracellular Ca2+ levels, and cell excitability of CVP neurons. Ad.CAT gene transfection subsequently improved impaired cardiac vagal function and suppressed ventricular arrhythmogenesis in T2DM. Therefore, targeting H2O2-N-type Ca2+ channel signaling pathway could be a potential therapeutic strategy to improve the withdrawal of cardiac vagal activation and suppress ventricular arrhythmias in T2DM patients with MI.

References

    1. Holman RR, Paul SK, Bethel MA, Matthews DR, Neil HA. 10-Year follow-up of intensive glucose control in type 2 diabetes. N Engl J Med. (2008) 359:1577–89. 10.1056/NEJMoa0806470 - DOI - PubMed
    1. Gu K, Cowie CC, Harris MI. Mortality in adults with and without diabetes in a national cohort of the U.S. population, 1971-1993. Diabetes Care. (1998) 21:1138–45. 10.2337/diacare.21.7.1138 - DOI - PubMed
    1. Tancredi M, Rosengren A, Svensson AM, Kosiborod M, Pivodic A, Gudbjornsdottir S, et al. . Excess mortality among persons with type 2 diabetes. N Engl J Med. (2015) 373:1720–32. 10.1056/NEJMoa1504347 - DOI - PubMed
    1. Saeedi P, Petersohn I, Salpea P, Malanda B, Karuranga S, Unwin N, et al. . Global and regional diabetes prevalence estimates for 2019 and projections for 2030 and 2045: results from the international diabetes federation diabetes atlas, 9(Th) edition. Diabetes Res Clin Pract. (2019) 157:107843. 10.1016/j.diabres.2019.107843 - DOI - PubMed
    1. Souza BM, Assmann TS, Kliemann LM, Gross JL, Canani LH, Crispim D. The role of uncoupling protein 2 (Ucp2) on the development of type 2 diabetes mellitus and its chronic complications. Arq Bras Endocrinol Metabol. (2011) 55:239–48. 10.1590/S0004-27302011000400001 - DOI - PubMed