. 2022 Apr 20:12:858398.
doi: 10.3389/fcimb.2022.858398. eCollection 2022.

Adaptive Immune Response to Mycobacterium abscessus Complex (MABSC) in Cystic Fibrosis and the Implications of Cross-Reactivity

Collaborators, Affiliations

Adaptive Immune Response to Mycobacterium abscessus Complex (MABSC) in Cystic Fibrosis and the Implications of Cross-Reactivity

Renan Marrichi Mauch et al. Front Cell Infect Microbiol. .

Abstract

Background: We aimed to characterise the adaptive immune response to Mycobacterium abscessus complex (MABSC) and its cross-reactivity with Mycobacterium avium complex (MAC) and Mycobacterium bovis (Bacille Calmette-Guérin, BCG) in cystic fibrosis (CF) patients and non-CF controls in terms of lymphocyte proliferation and immunophenotyping, cytokine production and anti-MABSC IgG plasma levels.

Methods: In this cross-sectional analysis, peripheral blood mononuclear cells (PBMC) from CF patients with MABSC (CF/MABSC, n=12), MAC infection history (CF/MAC, n=5), no NTM history (CF/NTM-, n=15), BCG-vaccinated (C/BCG+, n=9) and non-vaccinated controls (C/BCG-, n=8) were cultured for four days under stimulation with an in-house MABSC lysate and we used flow cytometry to assess lymphocyte proliferation (given by lymphoblast formation) and immunophenotypes. Cytokine production was assessed after overnight whole blood stimulation with the same lysate, and anti-MABSC IgG levels were measured in plasma from non-stimulated blood.

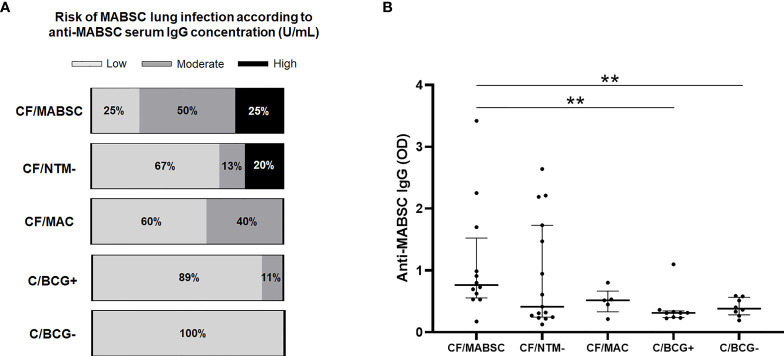
Results: All CF/MABSC patients had increased CD3+ and CD19+ lymphoblast formation upon PBMC stimulation with MABSC lysate. There was a higher rate of CD3+ than CD19+ lymphoblasts, predominance of CD4+ over CD8+ lymphoblasts, IFN-γ, TNF-α and IL-2 production, low production of the Th17-associated IL-17, and discrete or no production of Th2/B cell-associated cytokines soluble CD40 ligand (CD40L), IL-4 and IL-5, indicating a Th1-dominated phenotype and infection restricted to the lungs. A similar pattern was seen in C/BCG+ controls, and CF/MAC patients, pointing to cross-reactivity. MABSC-IgG levels were higher in CF/MABSC patients than in both control groups, but not CF/NTM- patients, most of whom also had CD3+ and/or CD19+ lymphoblast formation upon PBMC stimulation, indicating previous exposure, subclinical or latent infection with MABSC or other NTM.

Conclusion: The anti-MABSC immune response is Th1-skewed and underlines the cross-reactivity in the anti-mycobacterial immune response. The results, together with published clinical observations, indicate that BCG vaccination may cross-react against NTM in CF patients, and this should be investigated. Due to cross-reactivity, it would also be interesting to investigate whether a combination of MABSC-induced cytokine production by blood cells and anti-MABSC IgG measurement can be useful for identifying latent or subclinical infection both with MABSC and other NTM in CF patients.

Keywords: Mycobacterium abscessus Complex; Nontuberculous Mycobacteria; cellular immunology; cystic fibrosis; cytokines; flow cytometry.


Conflict of interest statement

The authors declare that the research was conducted in the absence of any commercial or financial relationships that could be construed as a potential conflict of interest.

Figures

Figure 1
Figure 1
Graphs showing (A) the rate of CD3+ and CD19+ cells within the lymphoblasts formed upon PBMC stimulation with MABSC in CF patients with history of MABSC infection (CF/MABSC), CF patients without history of NTM infection (CF/NTM-), CF patients with history of MAC infection (CF/MAC), and non-CF controls vaccinated with BCG (C/BCG+). Non-vaccinated controls (C/BCG-) were not included in the cell subtype analyses due to the low number of individuals who had lymphoblast formation upon PBMC stimulation with MABSC; (B) Selection of CD3+ and CD19+ cells and (C) lymphoblast formation rate within CD3+ (to the left) and CD19+ cells (to the right) in the CF/MABSC, CF/MAC, CF/NTM-, C/BCG+ and C/BCG- groups. The results are shown as the square roots of the rates of lymphoblasts within the total cells (resting lymphocytes plus lymphoblasts, excluding background lymphoblast formation from non-stimulated cells). The bold middle lines in the plots indicate the medians and the lower and upper lines indicate the 25th and 75th percentiles, respectively. The extremities of the lines above the plots indicate differences between two groups with **p ≤ 0.01; (D) Rate of CD4+ and CD8+ cells within the CD3+ lymphoblasts formed upon PBMC stimulation with MABSC; (E) Rate of CD45RO+ cells within the CD4+ and CD8+ lymphoblasts; (F) Rate of CD27+ cells within CD19+ lymphoblasts formed upon PBMC stimulation with MABSC. In (D–F), the extremities of the bars indicate the medians and the lower and upper lines in the bars indicate the 25th and 75th percentiles, respectively, while the extremities of the longer lines above the bars indicate differences between two related samples with the extremities of the shorter lines above the bars indicate difference between groups with **p ≤ 0.01.
Figure 2
Figure 2
Heatmaps showing the activity of IFN-γ, TNF-α, IL-2, IL-17, soluble CD40L, IL-4 and IL-5 upon overnight whole blood stimulation with MABSC in the CF/MABSC, CF/MAC, CF/NTM-, C/BCG+ and C/BCG- groups. The results are expressed as the square roots of the concentrations of each cytokine. The braces below each cytokine set indicate the combined concentration values of each cytokine, forming different cytokine patterns – T helper (Th)1 (IFN-γ + TNF-α + IL-2), Th2 (IL-4 + IL-5 + CD40L) and Th17 (IL-17) cytokine levels. *p ≤ 0.05; **p ≤ 0.01.
Figure 3
Figure 3
(A) Bar graphs showing the rate of patients in the CF/MABSC, CF/NTM-, CF/MAC, C/BCG+ and C/BCG- groups with anti-MABSC IgG levels associated with low (<125 U/mL), moderate (125-400 U/mL) and high risk (>400 U/mL) of MABSC infection, as previously reported (Qvist et al., 2015b). (B) Dot plots showing the plasma levels of anti-MABSC IgG, as indicated by optical density (OD) values, in the same groups. The bold middle lines in the plots indicate the medians and the lower and upper lines indicate the 25th and 75th percentiles, respectively. The extremities of the lines above the plots indicate differences between two groups with **p ≤ 0.01.

Similar articles

Cited by

References

    1. Abate G., Hamzabegovic F., Eickhoff C. S., Hoft D. F. (2019). BCG Vaccination Induces M. Avium and M. Abscessus Cross-Protective Immunity. Front. Immunol. 10. doi: 10.3389/fimmu.2019.00234 - DOI - PMC - PubMed
    1. Aiello T. B., Levy C. E., Zaccariotto T. R., Paschoal I. A., Pereira M. C., da Silva M. T. N., et al. . (2018). Prevalence and Clinical Outcomes of Nontuberculous Mycobacteria in a Brazilian Cystic Fibrosis Reference Center. Pathog. Dis. 76, fty051. doi: 10.1093/femspd/fty051 - DOI - PubMed
    1. Bieri R., Bolz M., Ruf M.-T., Pluschke G. (2016). Interferon-γ Is a Crucial Activator of Early Host Immune Defense Against Mycobacterium Ulcerans Infection in Mice. PloS Negl. Trop. Dis. 10, e0004450. doi: 10.1371/journal.pntd.0004450 - DOI - PMC - PubMed
    1. Bjarnsholt T., Jensen PØ, Fiandaca M. J., Pedersen J., Hansen C. R., Andersen C. B., et al. . (2009). Pseudomonas Aeruginosa Biofilms in the Respiratory Tract of Cystic Fibrosis Patients. Pediatr. Pulmonol. 44, 547–558. doi: 10.1002/ppul.21011 - DOI - PubMed
    1. Bouso J. M., Burns J. J., Amin R., Livingston F. R., Elidemir O. (2017). Household Proximity to Water and Nontuberculous Mycobacteria in Children With Cystic Fibrosis. Pediatr. Pulmonol. 52, 324–330. doi: 10.1002/ppul.23646 - DOI - PubMed

Publication types