. 2022 Apr 25:4:881347.
doi: 10.3389/ftox.2022.881347. eCollection 2022.

A High-Throughput Toxicity Screen of 42 Per- and Polyfluoroalkyl Substances (PFAS) and Functional Assessment of Migration and Gene Expression in Human Placental Trophoblast Cells

Affiliations

A High-Throughput Toxicity Screen of 42 Per- and Polyfluoroalkyl Substances (PFAS) and Functional Assessment of Migration and Gene Expression in Human Placental Trophoblast Cells

Bevin E Blake et al. Front Toxicol. .

Abstract

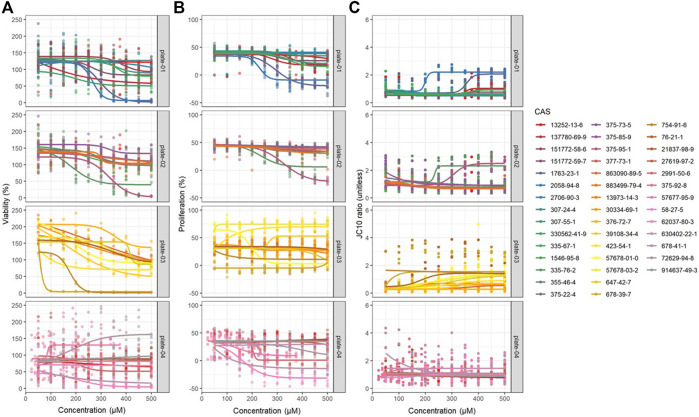
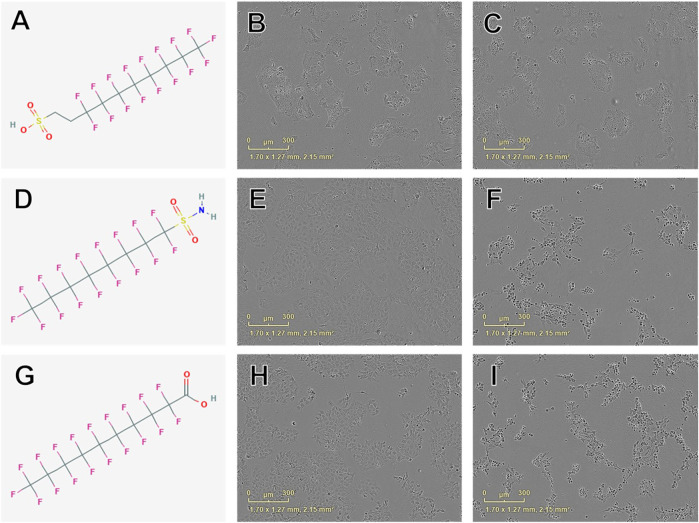
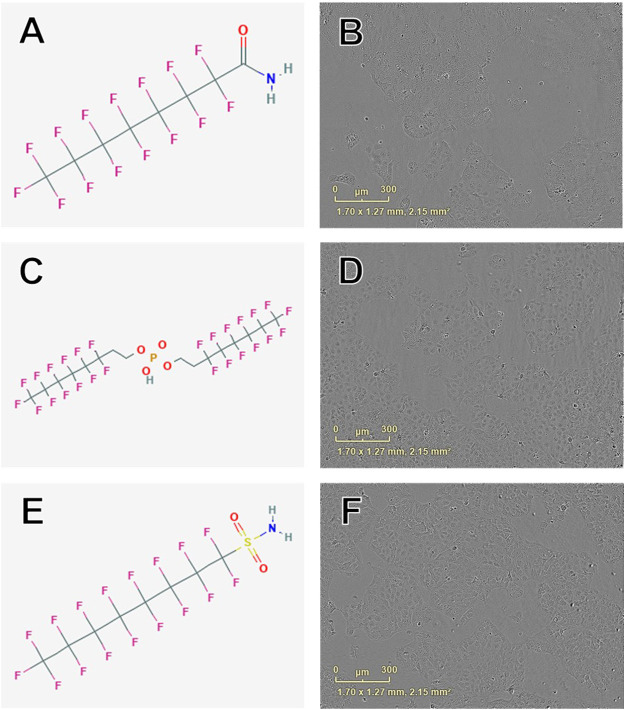
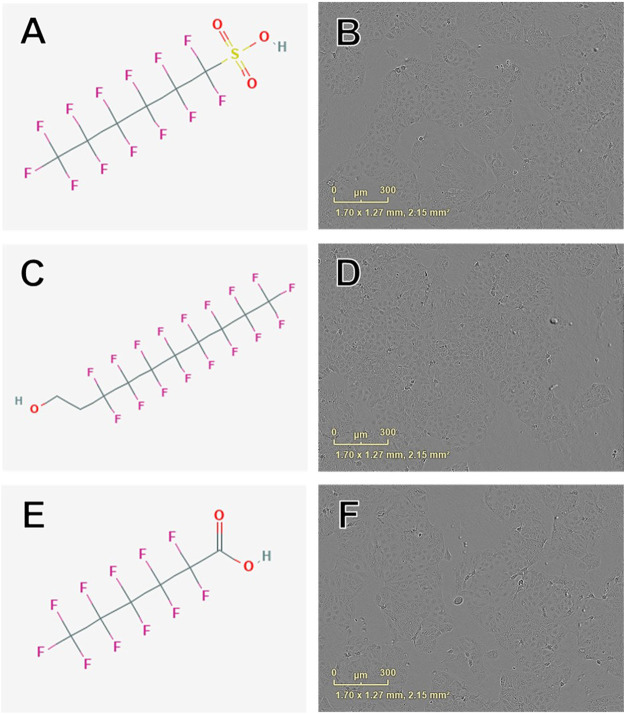
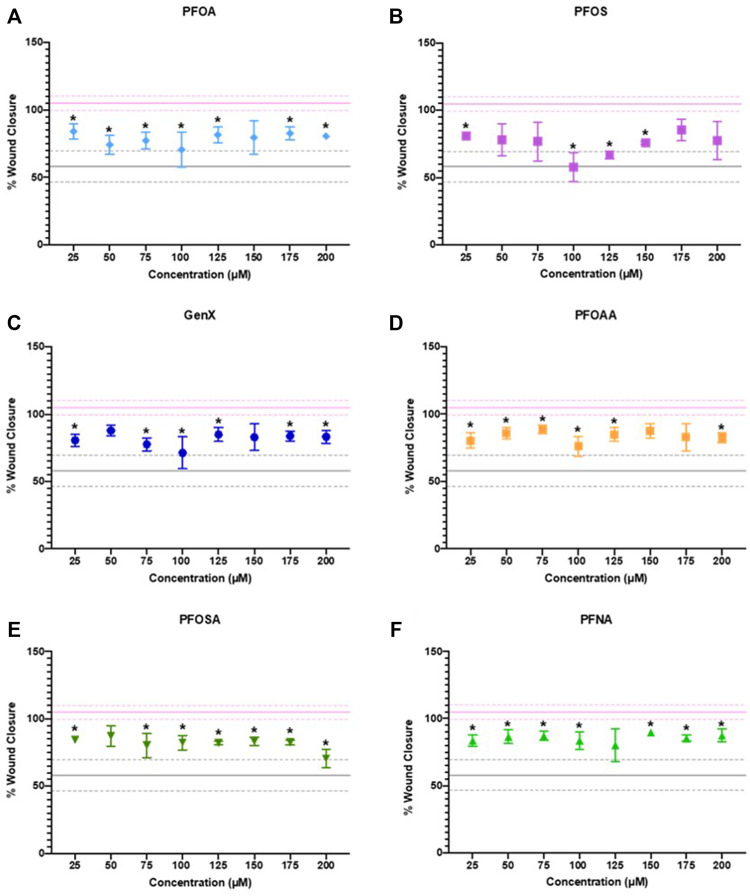
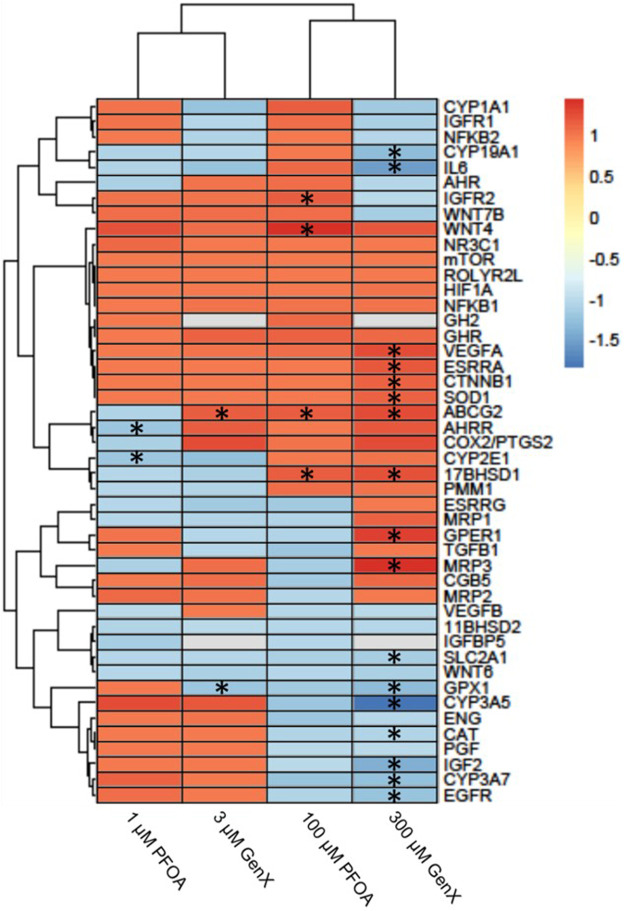
Per- and polyfluoroalkyl substances (PFAS) have become ubiquitous environmental contaminants that have been associated with adverse pregnancy outcomes in women and experimental research models. Adverse developmental and reproductive outcomes have been investigated for relatively few PFAS, and such studies are not scalable to address the thousands of unique chemical structures. As the placenta has been reported as a PFAS target tissue, the human placental trophoblast JEG-3 cell line was employed in a high-throughput toxicity screen (HTTS) to evaluate the effects of 42 unique PFAS on viability, proliferation, and mitochondrial membrane potential (MMP). HTTS concentration-response curve fitting determined EC50 values for 79% of tested compounds for at least one of the three endpoints. Trophoblast migratory potential was evaluated for a subset of six prioritized PFAS using a scratch wound assay. Migration, measured as the percent of wound closure after 72 h, was most severely inhibited by exposure to 100 µM perfluorooctanoic acid (PFOA; 72% closure), perfluorooctanesulfonic acid (PFOS; 57% closure), or ammonium perfluoro-2-methyl-3-oxahexanoate (GenX; 79% closure). PFOA and GenX were subsequently evaluated for disrupted expression of 46 genes reported to be vital to trophoblast health. Disrupted regulation of oxidative stress was suggested by altered expression of GPEX1 (300 µM GenX and 3 µM GenX), GPER1 (300 µM GenX), and SOD1 and altered cellular response to xenobiotic stress was indicated by upregulation of the placental efflux transporter, ABCG2 (300 µM GenX, 3 µM GenX, and 100 µM PFOA). These findings suggest the placenta is potentially a direct target of PFAS exposure and indicate that trophoblast cell gene expression and function are disrupted at PFAS levels well below the calculated cytotoxicity threshold (EC50). Future work is needed to determine the mechanism(s) of action of PFAS towards placental trophoblasts.

Keywords: In Vitro toxicity; PFAS; alternative methods; high-throughput (HT) testing; trophoblasts.


Conflict of interest statement

The authors declare that the research was conducted in the absence of any commercial or financial relationships that could be construed as a potential conflict of interest.

Figures

FIGURE 1
FIGURE 1
Dose-response modeling results obtained from JEG-3 cells exposed to 42 different PFAS congeners for 24 h corresponding to (A) viability, (B) proliferation, and (C) mitochondrial membrane potential (MMP). Data were fit to a four-parameter dose-response model with no constraints and EC50 estimates were extracted. N = 3 biological replicates.
FIGURE 2
FIGURE 2
Examples of chemical structures and corresponding phase contrast live cell images obtained from JEG-3 cells after 24 h exposure to PFAS with most pronounced effects on cellular viability. (A) Structure of 8:2 fluorotelomer sulfonic acid (39108-34-4; viability EC50 ± SE: 160 ± 46 µM); (B) Image of cells exposed to 300 µM 39108-34-4; (C) Image of cells exposed to 500 µM 39108-34-4; (D) Structure of perfluorooctanesulfonamide (754-91-6; EC50 ± SE: 176 ± 5 µM); (E) Image of cells exposed to 150 µM 754-91-6; (F) Image of cells exposed to 300 µM 754-91-6; (G) Structure of perfluorodecanoic acid (335-76-2; EC50 ± SE: 181 ± 26 µM); (H) Image of cells exposed to 250 µM 335-76-2; (I) Image of cells exposed to 350 µM 335-76-2. Mild to moderate cell stress is apparent in (B), (E), and (H) marked by darkened, condensed nuclei and increased fibroblastic projections. Moderate to severe cell stress and death is apparent in (C), (F), and (I).
FIGURE 3
FIGURE 3
Examples of chemical structures and corresponding phase contrast live cell images obtained from JEG-3 cells after 24 h exposure to PFAS with most pronounced effects on cellular proliferation. (A) Structure of perfluorooctanamide (423-54-1; EC50 ± SE: 114.0 ± 35.6 µM); (B) Live cell image of cells exposed to 150 µM 423-54-1; (C) Structure of 6:2 fluorotelomer phosphate diester (57677-95-9; EC50 ± SE: 141.6 ± 39.4 µM); (D) Image of cells exposed to 150 µM 57677-95-9; (E) Structure of perfluorooctane sulfonamide (754-91-6; EC50 ± SE: 159.8 ± 90.0 µM); (F) Image of cells exposed to 150 µM 754-91-6. No overt cell death is apparent in (B), (D), or (F).
FIGURE 4
FIGURE 4
Examples of chemical structures and corresponding phase contrast live cell images obtained from JEG-3 cells after 24 h exposure to PFAS with most pronounced effects on mitochondrial membrane potential. (A) Structure of perfluorohexanesulfonic acid (355-46-4; EC50 ± SE: 86.2 ± 72.3 µM); (B) Live cell image of cells exposed to 150 µM 355-46-4; (C) Structure of 6:2 fluorotelomer alcohol (678-39-7 EC50 ± SE: 95.4 ± 17.1 µM); (D) Image of cells exposed to 50 µM 678-39-7; (E) Structure of perfluorohexanoic acid (307-24-4; EC50 ± SE: 140.9 ± 11.10 µM); (F) Image of cells exposed to 150 µM 307-24-4. No overt cell death is apparent in (B), (D), or (F).
FIGURE 5
FIGURE 5
JEG‐3 cell migration after 24 h of exposure to (A) PFOA, (B) PFOS, (C) GenX, (D) PFOAA, (E) PFOSA, and (F) PFNA, assessed using a scratch wound assay. For each chemical, migration is expressed as % wound closure, which measures the extent to which JEG‐3 cells migrated across the scratch wound between the initial scratch was made and 24 h post-scratch (mean ± SD). The upper pink solid line flanked by dotted lines represents the mean ± SD for vehicle control (2% methanol). The lower gray solid line flanked by dotted lines represents the mean ± SD values for the positive control (25 µM cadmium chloride). N = 2−4 biological replicates per chemical and dose. Significance was determined using multiple unpaired t‐tests comparing experimental conditions to the vehicle control followed by post hoc correction using the Bonferroni-Dunn method, *p < 0.05. Representative images are shown in Supplementary Figure S7.
FIGURE 6
FIGURE 6
Heatmap illustrating gene expression changes in a set of 46 genes evaluated in JEG‐3 cells after exposure to PFOA or GenX for 24 h. Fold‐change is indicated by the scale bar and colors on the heatmap, with grey indicating genes with mRNA counts below the detection threshold due to suboptimal probe hybridization (GH2 and IGFBP5). Experimental group fold‐change values were compared to corresponding vehicle control group fold‐change values by ANOVA. Asterisks indicate significant shifts in gene expression at a false discovery rate of *p < 0.05 (N = 3 biological replicates).

Similar articles

Cited by

References

    1. Adebambo O. A., Shea D., Fry R. C. (2018). Cadmium Disrupts Signaling of the Hypoxia-Inducible (HIF) and Transforming Growth Factor (TGF-β) Pathways in Placental JEG-3 Trophoblast Cells via Reactive Oxygen Species. Toxicol. Appl. Pharmacol. 342, 108–115. 10.1016/j.taap.2018.01.010 - DOI - PubMed
    1. Allaire A. D., Ballenger K. A., Wells S. R., McMahon M. J., Lessey B. A. (2000). Placental Apoptosis in Preeclampsia. Obstet. Gynecol. 96 (2), 271–276. 10.1097/00006250-200008000-00022 - DOI - PubMed
    1. Ashley-Martin J., Dodds L., Arbuckle T., Morisset A.-S., Fisher M., Bouchard M., et al. (2016). Maternal and Neonatal Levels of Perfluoroalkyl Substances in Relation to Gestational Weight Gain. Ijerph 13 (1), 146. 10.3390/ijerph13010146 - DOI - PMC - PubMed
    1. Bangma J., Eaves L. A., Oldenburg K., Reiner J. L., Manuck T., Fry R. C. (2020a). Identifying Risk Factors for Levels of Per- and Polyfluoroalkyl Substances (PFAS) in the Placenta in a High-Risk Pregnancy Cohort in North Carolina. Environ. Sci. Technol. 54 (13), 8158–8166. 10.1021/acs.est.9b07102 - DOI - PMC - PubMed
    1. Bangma J., Szilagyi J., Blake B. E., Plazas C., Kepper S., Fenton S. E., et al. (2020b). An Assessment of Serum‐dependent Impacts on Intracellular Accumulation and Genomic Response of Per‐ and Polyfluoroalkyl Substances in a Placental Trophoblast Model. Environ. Toxicol. 35 (12), 1395–1405. 10.1002/tox.23004 - DOI - PMC - PubMed