

New 3D graphical representation for RNA structure analysis and its application in the pre-miRNA identification of plants
- PMID: 35548744
- PMCID: PMC9085476
- DOI: 10.1039/c8ra04138e
New 3D graphical representation for RNA structure analysis and its application in the pre-miRNA identification of plants
Abstract
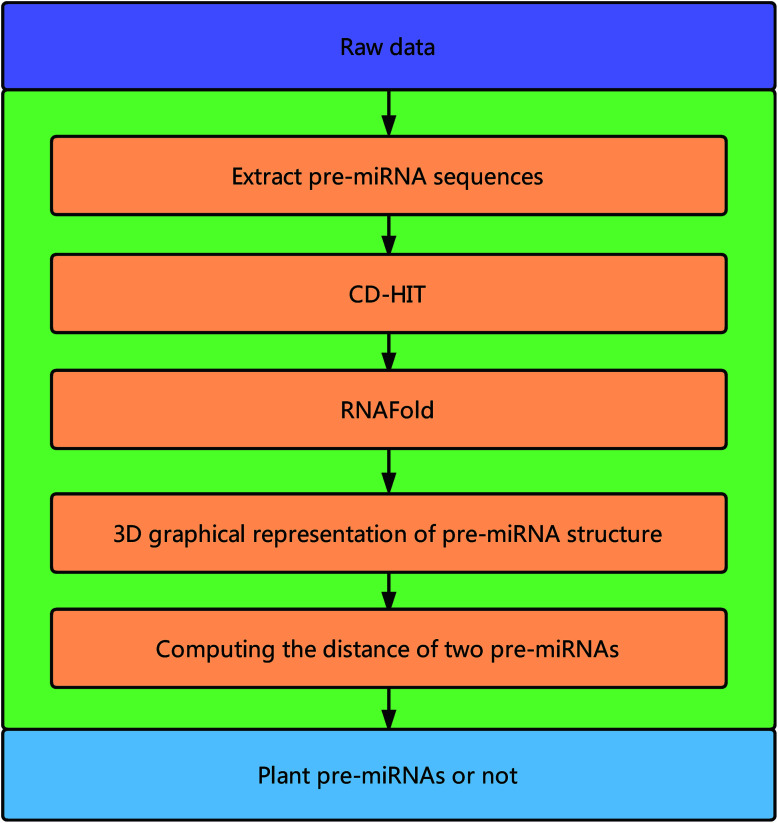
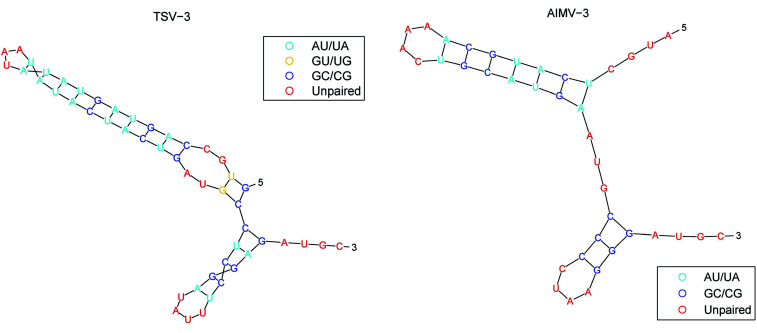
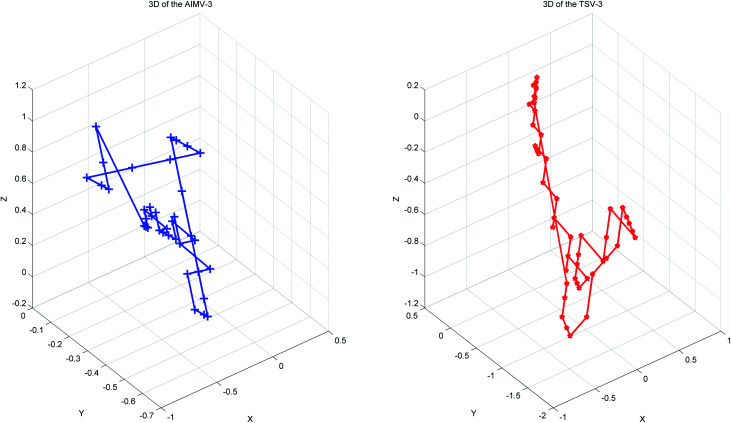
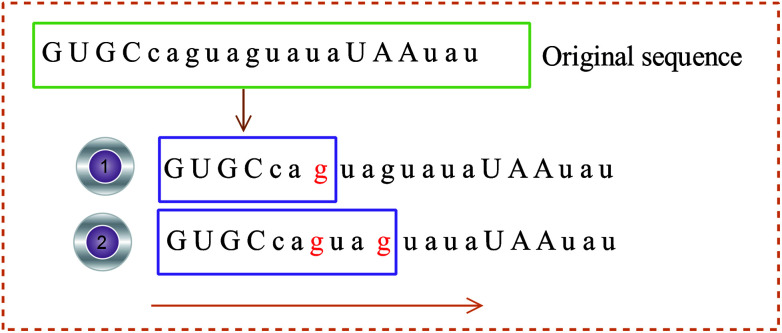
MicroRNAs (miRNAs) are a family of short non-coding RNAs that play significant roles as post-transcriptional regulators. Consequently, various methods have been proposed to identify precursor miRNAs (pre-miRNAs), among which the comparative studies of miRNA structures are the most important. To measure and classify the structural similarity of miRNAs, we propose a new three-dimensional (3D) graphical representation of the secondary structure of miRNAs, in which an miRNA secondary structure is initially transformed into a characteristic sequence based on physicochemical properties and frequency of base. A numerical characterization of the 3D graph is used to represent the miRNA secondary structure. We then utilize a novel Euclidean distance method based on this expression to compute the distance of different miRNA sequences for the sequence similarity analysis. Finally, we use this sequence similarity analysis method to identify plant pre-miRNAs among three commonly used datasets. Results show that the method is reasonable and effective.
This journal is © The Royal Society of Chemistry.
Conflict of interest statement
There are no conflicts to declare.
Figures
References
LinkOut - more resources
Full Text Sources