

Differences in All-Cause Mortality Among Transgender and Non-Transgender People Enrolled in Private Insurance
- PMID: 35548863
- PMCID: PMC9195044
- DOI: 10.1215/00703370-9942002
Differences in All-Cause Mortality Among Transgender and Non-Transgender People Enrolled in Private Insurance
Abstract
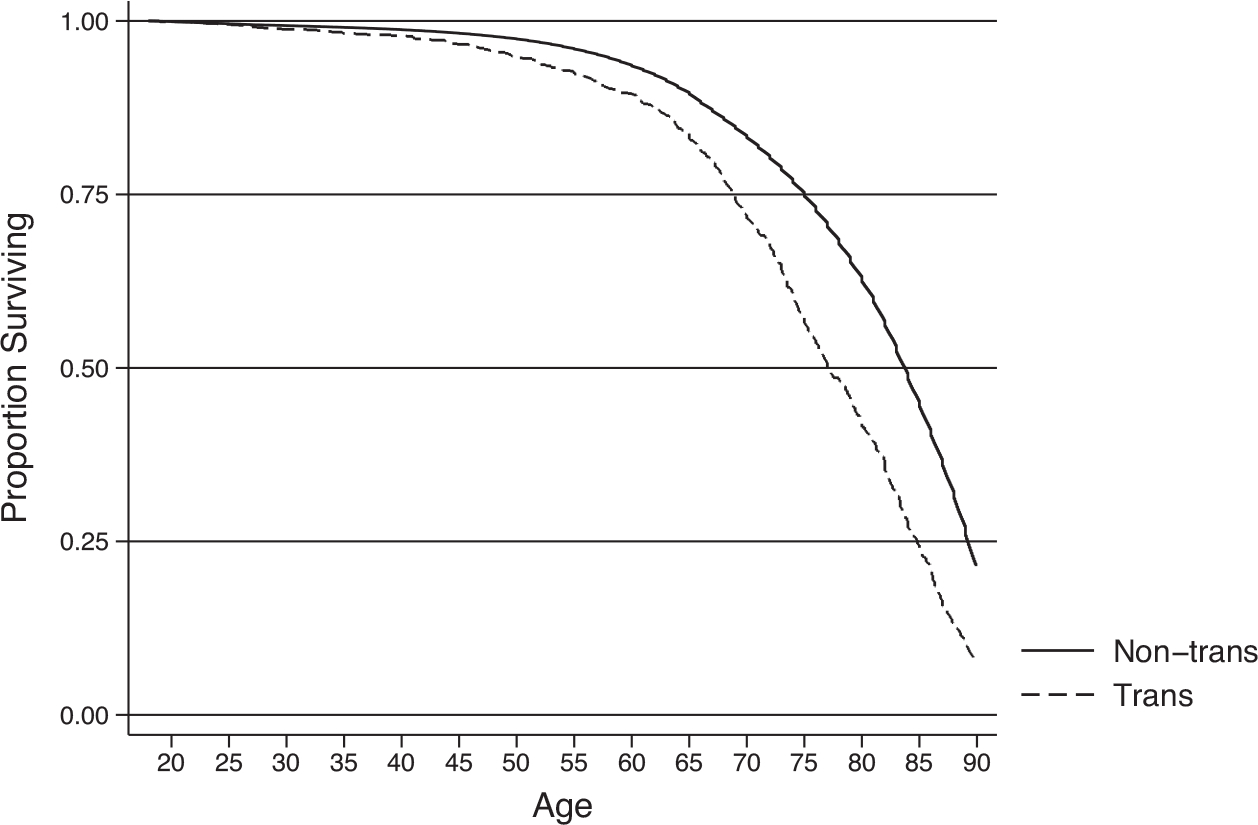
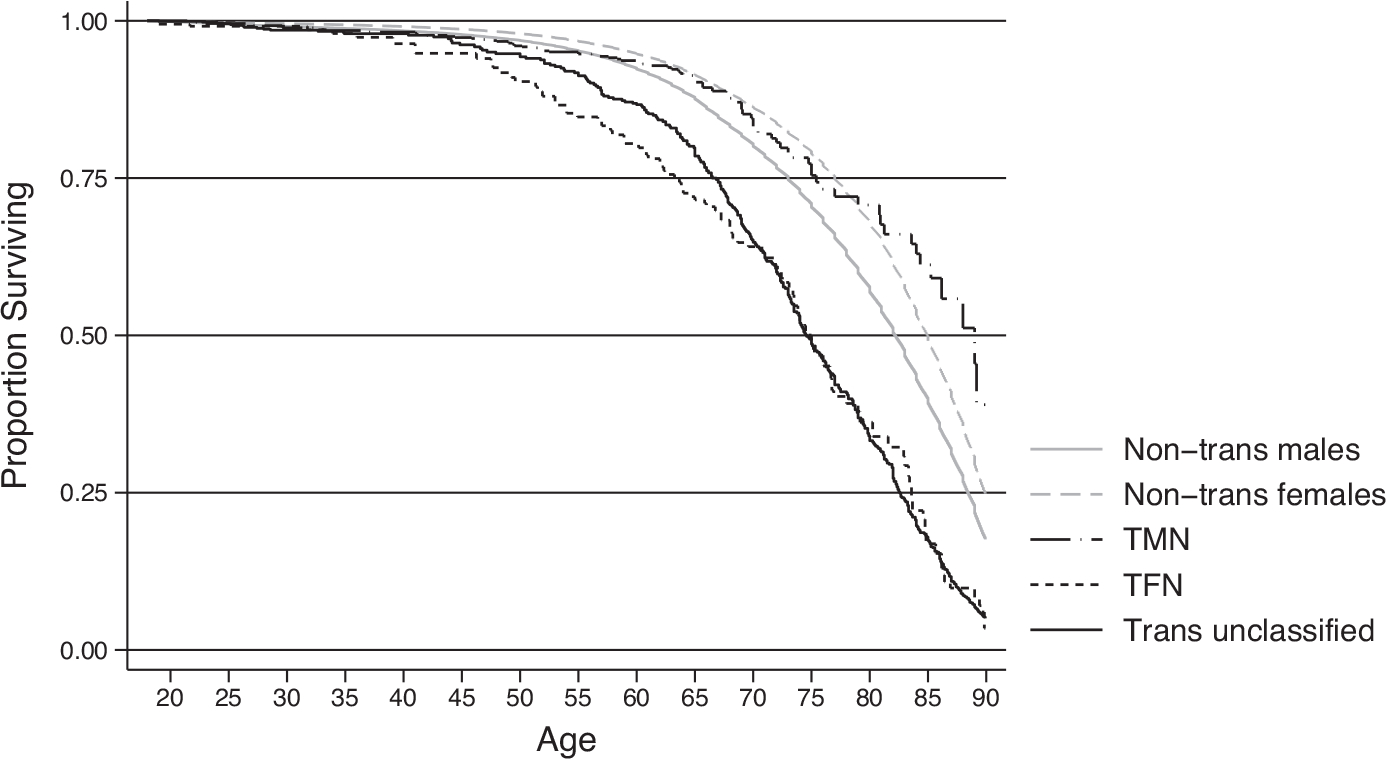
Few studies have analyzed mortality rates among transgender (trans) populations in the United States and compared them to the rates of non-trans populations. Using private insurance data from 2011 to 2019, we estimated age-specific all-cause mortality rates among a subset of trans people enrolled in private insurance and compared them to a 10% randomly selected non-trans cohort. Overall, we found that trans people were nearly twice as likely to die over the period as their non-trans counterparts. When stratifying by gender, we found key disparities within trans populations, with people on the trans feminine to nonbinary spectrum being at the greatest risk of mortality compared to non-trans males and females. While we found that people on the trans masculine to nonbinary spectrum were at a similar risk of overall mortality compared to non-trans females, their overall mortality rate was statistically smaller than that of non-trans males. These findings provide evidence that some trans and non-trans populations experience substantially different mortality conditions across the life course and necessitate further study.
Keywords: Disparity; Gender; Life expectancy; Mortality; Transgender.
Copyright © 2022 The Authors.
Figures
References
-
- Ashley F (forthcoming). ‘Trans’ is my gender modality: A modest terminological proposal. In Laura Erickson-Schroth (Ed.), Trans bodies, trans selves (2nd ed.). New York, NY: Oxford University Press. https://www.florenceashley.com/uploads/1/2/4/4/124439164/florence_ashley...
-
- Asscheman H, Giltay EJ, Megens JAJ, de Ronde W, van Trotsenburg MAA, & Gooren LJG (2011). A long-term follow-up study of mortality in transsexuals receiving treatment with cross-sex hormones. European Journal of Endocrinology, 164, 635–642. - PubMed
-
- Balzer C (2020). Trans murder monitoring (2008–Sept 2020): Trans respect vs transphobia worldwide (Figure). Retrieved from https://transrespect.org/en/map/trans-murder-monitoring/
-
- Becasen JS, Denard CL, Mullins MM, Higa DH, & Sipe TA (2019). Estimating the prevalence of HIV and sexual behaviors among the U.S. transgender population: A systematic review and meta-analysis, 2006–2017. American Journal of Public Health, 109(1), e1–e8. 10.2105/AJPH.2018.304727 - DOI - PMC - PubMed
-
- Bennett GG, Merritt MM, Sollers JJ III, Edwards CL, Whitfield KE, Brandon DT, & Tucker RD (2004). Stress, coping, and health outcomes among African-Americans: A review of the John Henryism hypothesis. Psychology & Health, 19, 369–383.
Publication types
MeSH terms
Grants and funding
LinkOut - more resources
Full Text Sources