. 2022 May 15;33(6):tp1.
doi: 10.1091/mbc.E21-10-0506.

Combining multiple fluorescence imaging techniques in biology: when one microscope is not enough

Affiliations

Combining multiple fluorescence imaging techniques in biology: when one microscope is not enough

Chad M Hobson et al. Mol Biol Cell. .

Abstract

While fluorescence microscopy has proven to be an exceedingly useful tool in bioscience, it is difficult to offer simultaneous high resolution, fast speed, large volume, and good biocompatibility in a single imaging technique. Thus, when determining the image data required to quantitatively test a complex biological hypothesis, it often becomes evident that multiple imaging techniques are necessary. Recent years have seen an explosion in development of novel fluorescence microscopy techniques, each of which features a unique suite of capabilities. In this Technical Perspective, we highlight recent studies to illustrate the benefits, and often the necessity, of combining multiple fluorescence microscopy modalities. We provide guidance in choosing optimal technique combinations to effectively address a biological question. Ultimately, we aim to promote a more well-rounded approach in designing fluorescence microscopy experiments, leading to more robust quantitative insight.


Figures

FIGURE 1:
FIGURE 1:
Three classes of multitechnique microscopy experiments. (Left) Scenario 1: multi-instrument experiments image related, but not the same, biological specimens using multiple instruments, after which the results are combined. (Middle) Scenario 2: correlative light microscopy uses two or more techniques to image the same FOV in a specimen; the images from each instrument are subsequently registered, forming a correlated data set. (Right) Scenario 3: dynamic, multitechnique acquisition rapidly switches between microscopy methods on a single system, enabling correlated time-series imaging.
FIGURE 2:
FIGURE 2:
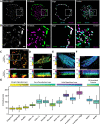
Multi-instrument microscopy experiments examine FA dynamics and architecture in hPSCs. (A) Representative SD confocal image depicting paxillin-positive FAs located at the cell edge (green) and cell interior (magenta). Selected time points of 0 min (green), 50 min (cyan), and 100 min (magenta) are shown for both edge and center FAs. White regions indicate highly stable FAs. (B) Corresponding images of the inset square region shown in A. (C–F). Lateral (top) and axial (bottom) projections of iPALM images of (C) Eos-tagged integrin β5, (D) paxillin, (E) Eos-tagged actin, and (F) Eos-tagged α-actinin. Color scale in each bottom panel represents axial position as noted. Scale bar = 1 µm. (G) Average (and standard deviation) axial positions of hPSC cornerstone FA components as determined from iPALM images. Images are reproduced with permission from Stubb, Guzmán, et al. (2019).
FIGURE 3:
FIGURE 3:
Multi-instrument microscopy experiments inform complement receptor–mediated phagocytosis. (A) SD confocal microscopy images of a RAW 264.7 macrophage expressing F-tractin-eGFP (green) engulfing an iC3b-opsonized polystyrene bead (red). (B) Fluorescence speckle microscopy of RAW macrophages expressing actin-mEos3.2 during phagocytosis of opsonized target beads. Red circles and triangles depict detected speckles, and red lines show tracks of speckles through time. (C) Immunofluorescence TIRF-SIM images of a RAW macrophage engaging with an anti-αMβ2–coated coverslip. Images of actin labeled with fluorescent phalloidin (green) and immunostained for phosphorylated paxillin (red) were collected. Right images depict the square inset region shown in the left image. Images are reproduced with permission from Jaumouillé et al. (2019).
FIGURE 4:
FIGURE 4:
Correlative fluorescence microscopy allows detailed measurements of lysosome mobility along microtubules. First, a WF time-lapse movie of lysosomes was captured and used for tracking. The sample was then fixed in situ and imaged via dSTORM to delineate the microtubule network at the nanoscale. Lysosome tracks were then overlaid with the SR microtubule image. Images are reproduced with permission from Bálint et al. (2013).
FIGURE 5:
FIGURE 5:
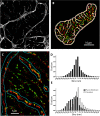
Correlative confocal microscopy and dSTORM provides spatial context for macromolecular complexes. (A) Confocal microscopy image of a cardiac myocyte labeled with wheat germ agglutinin (WGA). (B) Segmented cell surface and t-tubules (gray) overlaid with confocal microscopy image of JPH (red) and RyR (green). (C) dSTORM image of JPH (red) and RyR (green) overlaid with the cell membrane (cyan) as segmented from the confocal microscopy data. (D) Colocalization analysis of the image shown in C indicating the distance between RyR and the nearest region of JPH. (E) Colocalization analysis shown in D, separated into plasma membrane- (black) and cytoplasm-associated (white) regions. Analysis shows that RyR and JPH have a stronger colocalization within the plasma membrane than the cytoplasm. Images are reproduced with permission from Crossman et al. (2015).
FIGURE 6:
FIGURE 6:
Dynamic, multitechnique approach for studying cell adhesions during activation of Rac1. Images of a mouse embryonic fibroblast (MEF) transiently transfected with mCherry-Paxillin (black) were collected with variable angle (va)TIRF microscopy. This cell line also stably expressed mVenus–photoactivatable Rac1. Dynamic switching to a laser point-scanning mode enabled localized photoactivation of Rac1 within the dashed circle (blue-filled circles represent images collected during localized photoactivation). Subsequent switching to TIRF mode showed that activation at the cell edge was immediately followed by a protrusion and the formation of adhesions, after which the cell retracted and the adhesions dissipated. Images were reproduced with permission from Liu, Hobson, et al. (2019).
FIGURE 7:
FIGURE 7:
Dynamic TIRF and confocal microscopy facilitates studying vesicle and basal cell membrane interactions. Z-stacks of HEK293 cells were collected first via SD confocal microscopy, after which a single TIRF microscopy image was collected. A β1AR vesicle (red) was tracked in 3D (arrowhead and insert) and observed to interact with a Snx27 vesicle (blue) at the basal cell membrane. Scale bar = 5 µm. Images are reproduced with permission from Zobiak and Failla (2018).
FIGURE 8:
FIGURE 8:
Dynamic, correlative SR microscopy of synaptic proteins within neurons. (A) Correlative STED, PALM, and uPAINT (trajectories) of a dendritic segment of a hippocampal neuron. Scale bar = 2 µm. (B) Time-lapse correlative STED and sptPALM microscopy of PSD95-mEos3.2 trajectories within the dendrite. Scale bar = 1 µm. Images are reproduced with permission from Inavalli et al. (2019).

Similar articles

Cited by

References

    1. Alvelid J, Damenti M, Testa I (2021). Event-triggered STED imaging. BioRxiv, 2021.10.26.465907. - PMC - PubMed
    1. Amos B (2000). Lessons from the history of light microscopy. Nat Cell Biol 2, E151–E152. - PubMed
    1. Arganda-Carreras I, Kaynig V, Rueden C, Eliceiri KW, Schindelin J, Cardona A, Sebastian Seung H (2017). Trainable Weka Segmentation: a machine learning tool for microscopy pixel classification. Bioinformatics 33, 2424–2426. - PubMed
    1. Baddeley D, Bewersdorf J (2018). Biological insight from super-resolution microscopy: What we can learn from localization-based images. Annu Rev Biochem 87, 965–989. - PubMed
    1. Bálint Š, Vilanova IV, Álvarez ÁS, Lakadamyali M (2013). Correlative live-cell and superresolution microscopy reveals cargo transport dynamics at microtubule intersections. Proc Natl Acad Sci USA 110, 3375–3380. - PMC - PubMed

Publication types

LinkOut - more resources