. 2023 Jul;130(4):1125-1136.
doi: 10.1037/rev0000363. Epub 2022 May 12.

Shape, perspective, and what is and is not perceived: Comment on Morales, Bax, and Firestone (2020)

Affiliations

Shape, perspective, and what is and is not perceived: Comment on Morales, Bax, and Firestone (2020)

Johannes Burge et al. Psychol Rev. 2023 Jul.

Abstract

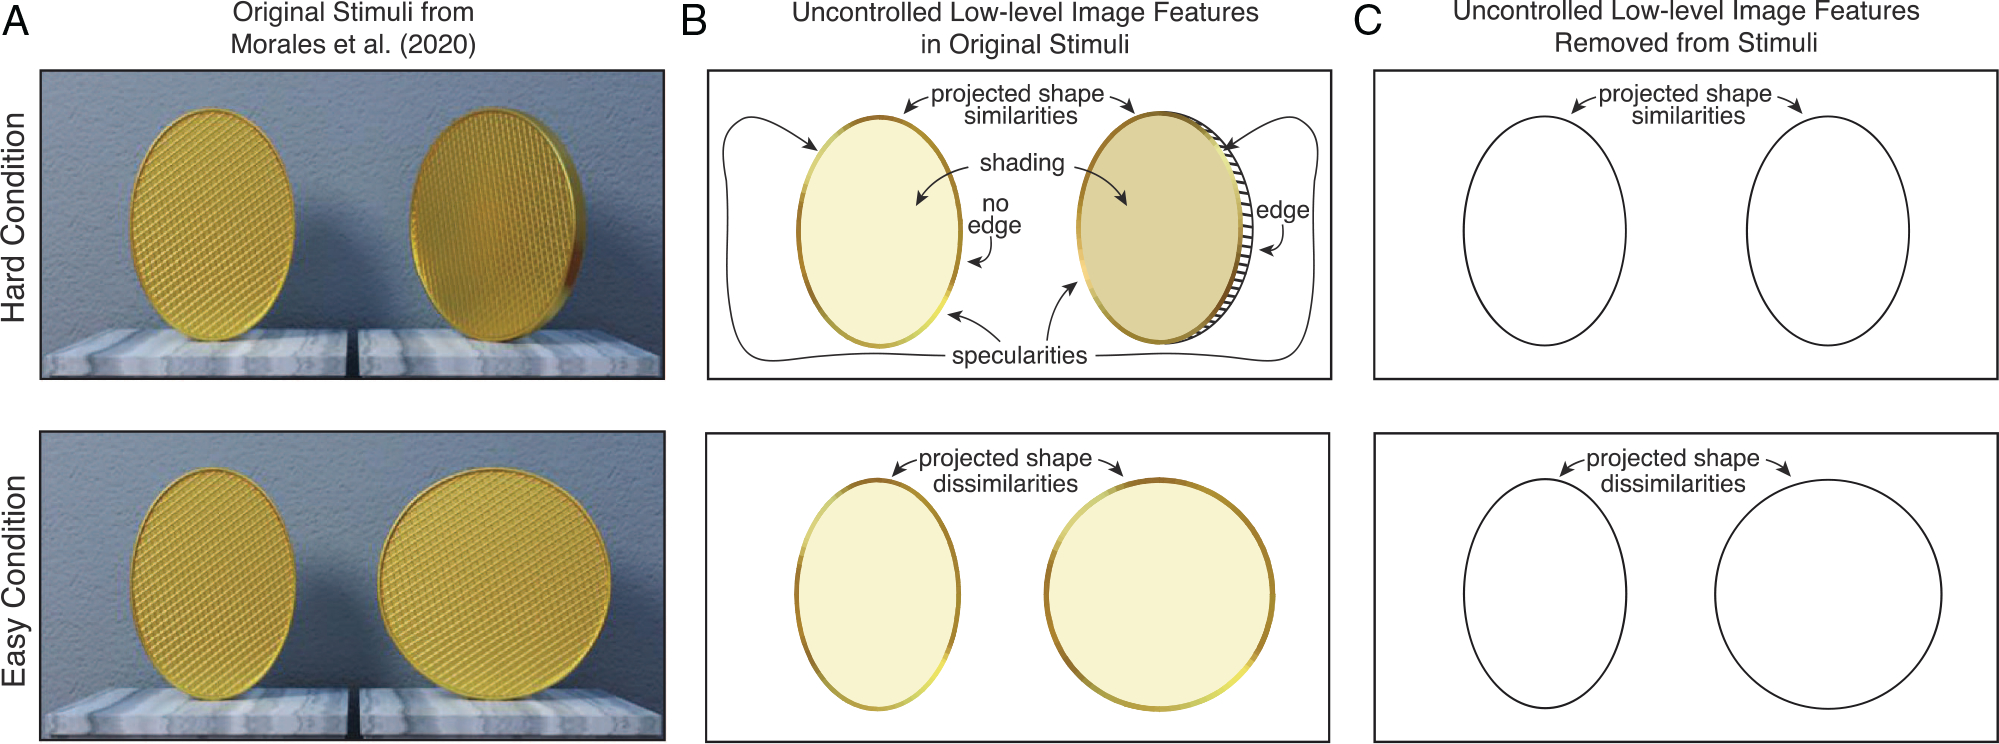
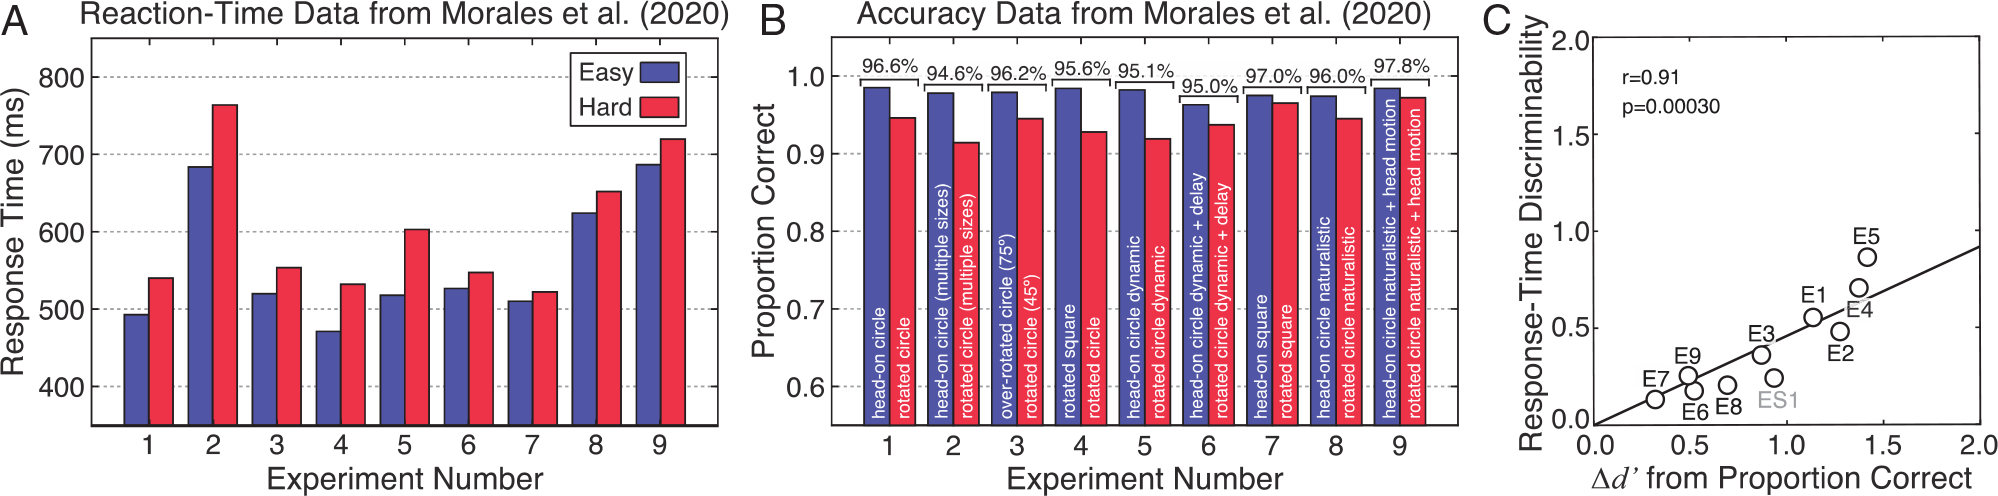
Psychology and philosophy have long reflected on the role of perspective in vision. Since the dawn of modern vision science-roughly, since Helmholtz in the late 1800s-scientific explanations in vision have focused on understanding the computations that transform the sensed retinal image into percepts of the three-dimensional environment. The standard view in the science is that distal properties-viewpoint-independent properties of the environment (object shape) and viewpoint-dependent relational properties (3D orientation relative to the viewer)-are perceptually represented and that properties of the proximal stimulus (in vision, the retinal image) are not. This view is woven into the nature of scientific explanation in perceptual psychology, and has guided impressive advances over the past 150 years. A recently published article suggests that in shape perception, the standard view must be revised. It argues, on the basis of new empirical data, that a new entity-perspectival shape-should be introduced into scientific explanations of shape perception. Specifically, the article's centrally advertised claim is that, in addition to distal shape, perspectival shape is perceived. We argue that this claim rests on a series of mistakes. Problems in experimental design entail that the article provides no empirical support for any claims regarding either perspective or the perception of shape. There are further problems in scientific reasoning and conceptual development. Detailing these criticisms and explaining how science treats these issues are meant to clarify method and theory, and to improve exchanges between the science and philosophy of perception. (PsycInfo Database Record (c) 2023 APA, all rights reserved).


Figures

Figure 1
Figure 1. Experimental Stimuli From Morales et al. (2020) and Problems With Experimental Design
Note. (A) Original stimuli. In the hard condition (top), subjects were tasked with discriminating a distal head-on ellipse (left) from a distal rotated circle (right) that gave rise to images with identical aspect ratios. In the easy condition (bottom), subjects were tasked with discriminating a head-on distal ellipse (left) from a head-on distal circle (right). Distal shape discrimination and identification performance were good in both conditions. But subjects were slower, and less accurate, in the hard than in the easy condition. The authors assert that ‘similarity ... in perspectival shape per se (rather than some other factor)’ is the cause of response slowdowns in their task. (B) Uncontrolled low-level image features in the original stimuli. In the easy condition, subjects could discriminate distal shape on the basis of the projected shape in the retinal image (elliptical vs. circular). In the hard condition, because projected shapes were matched, subjects had to discriminate distal shapes based on differences in shading, specularities, and edge visibility, among other cues: Weaker cues to distal-shape differences in this context. The fact that these and other cues (see main text) differ between the hard and easy conditions entails that response slowdowns and accuracy decreases in the hard condition cannot be justifiably attributed to projected shape similarities. Projected shape similarities may be involved, but the experiments do not show that they are. (C) Controlling all low-level image features renders discrimination of distal shape impossible in the hard condition. Experiments isolating projected shape similarities and dissimilarities as the only cues differentiating the easy and hard conditions could not have yielded above-chance distal-shape discrimination in the hard condition. (Images in A adapted from Morales et al., 2020).
Figure 2
Figure 2. Reaction-Time and Accuracy Data From Morales et al. (2020)
Note. The original article reported filtered reaction-time data separately for the easy and hard conditions, and accuracy data averaged across—but not separately for—the easy and hard conditions in nine experiments. (A) Reaction-time data were reported in the original article. In each experiment, subjects were slower to identify the head-on ellipse when paired with a rotated (red) versusa head-on (blue) circle (see Figure 1A, top vs. bottom). Despite numerous uncontrolled image cues (see Figure 1AB) the authors conclude: ‘Across these many studies [Experiments 1–7], only the representational similarity [explicitly taken to be perspectival shape similarity] between the [head-on elliptical] target and the rotated [circular] distractor explained the observed RT slowdown’. (B) Accuracy data in the easy and hard conditions. Subjects were always less accurate in the hard (red) than in the easy (blue) condition. Morales et al. (2020) reported average accuracy (brackets above bars), but did not report accuracy separately for the easy and hard conditions. It is not the case, as the authors write, that because ‘accuracy [averaged across easy and hard conditions] ... was near ceiling ... that subjects were not confused at all about the true shapes of the stimuli’. (C) A strong relationship exists between reaction-time data and accuracy data across the experiments. There is a significant correlation (r = 0.91; p = 3.0 × 10⁻⁴) between the discriminability of response-time data in the easy and hard conditions, on one hand, and differences in sensitivity (d-prime) calculated from the accuracy data in the two conditions, on the other (see Methods). The 95% bootstrapped confidence interval ranges from 0.81 to 0.98. The labels (E1, E2, etc.,) indicate the experiment corresponding to each data point. The gray data point (ES1) is from a supplemental experiment (Morales et al., 2021), performed in response to another published criticism (Linton, 2021).

Similar articles

Cited by

  • New Approaches to 3D Vision.
    Linton P, Morgan MJ, Read JCA, Vishwanath D, Creem-Regehr SH, Domini F. Linton P, et al. Philos Trans R Soc Lond B Biol Sci. 2023 Jan 30;378(1869):20210443. doi: 10.1098/rstb.2021.0443. Epub 2022 Dec 13. Philos Trans R Soc Lond B Biol Sci. 2023. PMID: 36511413 Free PMC article.

References

    1. Adams WJ, Elder JH, Graf EW, Leyland J, Lugtigheid AJ, & Muryy A (2016). The Southampton-York Natural Scenes (SYNS) dataset: Statistics of surface attitude. Scientific Reports, 6, 1–17. 10.1038/srep35805 - DOI - PMC - PubMed
    1. Alais D, Cass J, O’Shea RP, & Blake R (2010). Visual sensitivity underlying changes in visual consciousness. Current Biology, 20(15), 1362–1367. 10.1016/j.cub.2010.06.015 - DOI - PMC - PubMed
    1. Alberti LB (1435/1991). On painting. Penguin Books.
    1. Albright TD, & Desimone R (1987). Local precision of visuotopic organization in the middle temporal area (MT) of the macaque. Experimental Brain Research, 65(3), 582–592. 10.1007/BF00235981 - DOI - PubMed
    1. Arcaro MJ, McMains SA, Singer BD, & Kastner S (2009). Retinotopic organization of human ventral visual cortex. The Journal of Neuroscience, 29(34), 10638–10652. 10.1523/JNEUROSCI.2807-09.2009 - DOI - PMC - PubMed

Publication types

Substances