. 2022 May 13;376(6594):eabl5197.
doi: 10.1126/science.abl5197. Epub 2022 May 13.

Cross-tissue immune cell analysis reveals tissue-specific features in humans

Affiliations

Cross-tissue immune cell analysis reveals tissue-specific features in humans

C Domínguez Conde et al. Science. .

Abstract

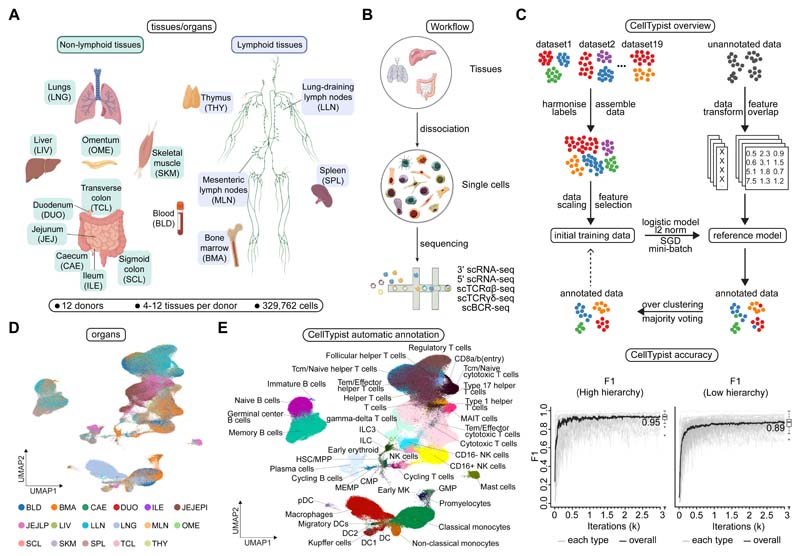
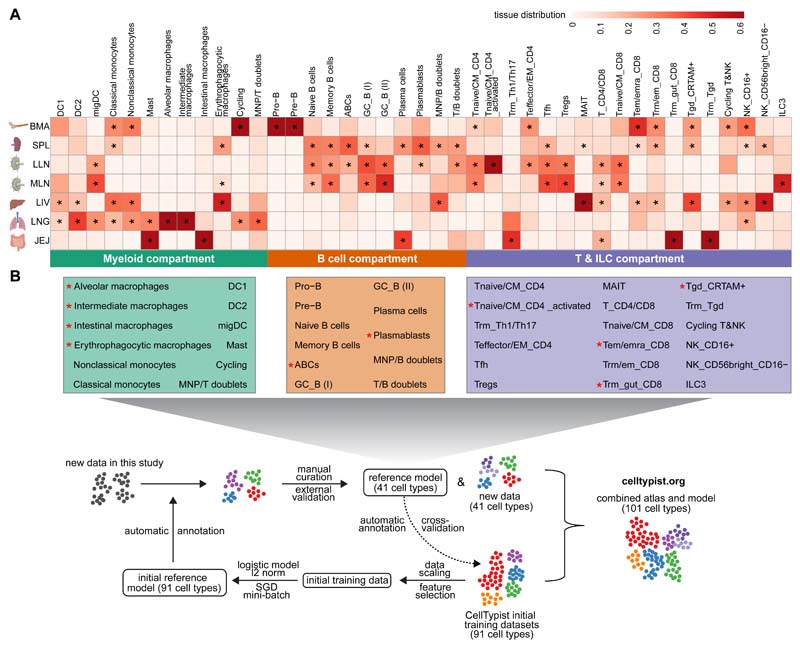
Despite their crucial role in health and disease, our knowledge of immune cells within human tissues remains limited. We surveyed the immune compartment of 16 tissues from 12 adult donors by single-cell RNA sequencing and VDJ sequencing generating a dataset of ~360,000 cells. To systematically resolve immune cell heterogeneity across tissues, we developed CellTypist, a machine learning tool for rapid and precise cell type annotation. Using this approach, combined with detailed curation, we determined the tissue distribution of finely phenotyped immune cell types, revealing hitherto unappreciated tissue-specific features and clonal architecture of T and B cells. Our multitissue approach lays the foundation for identifying highly resolved immune cell types by leveraging a common reference dataset, tissue-integrated expression analysis, and antigen receptor sequencing.


Conflict of interest statement

Competing interests: In the past three years, S.A.T has worked as a consultant for Genentech, Roche and Transition Bio, and is a remunerated member of the Scientific Advisory Boards of Qiagen, GlaxoSmithKline and Foresite Labs and an equity holder of Transition Bio. J.L.J reports receiving consultancy fees and grant support from Sanofi Genzyme. C.D.C., C.X., J.L.B., R.D.B., W.S.B., G.T., S.K.H., S.O., P.K., K.H.W., M.L., H.N., S.P.A., R.L., B.L., F.E.S., M.K.T., P.M., T.L., R.N., T.Z.K., C.L., M.H.S., N.E.J., P.S., L.T., E.R., P.J., R.E., C.D., M.D.K., B.O.A., J.L.K., M.K.B., Y.N., C.M.R., S.P.A., F.D.L., S.P.K., J.L.J. have no competing interests.

Figures

Fig. 1
Fig. 1. Automated annotation of immune cells across human tissues using CellTypist.
(A) Schematic showing sample collections of human lymphoid and non-lymphoid tissues and their assigned tissue name acronyms. (B) Schematic of single-cell transcriptome profiling and paired sequencing of αβ TCR, γδ TCR and BCR variable regions. (C) Workflow of CellTypist including data collection, processing, model training and cell type prediction (upper panel). Performance curves showing the F1 score at each iteration of training with mini-batch stochastic gradient descent for high- and low-hierarchy CellTypist models, respectively (lower panel). The black curve represents the median F1 score averaged across the individual F1 scores of all predicted cell types. (D) UMAP visualization of the immune cell compartment colored by tissues. Note jejunum samples in (A) were further split into epithelial (JEJEPI) and lamina propria fractions (JEJLP). (E) As in (D), but colored by predicted cell types using CellTypist.
Fig. 2
Fig. 2. Myeloid compartment across tissues.
(A) UMAP visualization of the cell populations in the myeloid compartment. (B) Dot plot for expression of marker genes of the identified myeloid populations. Color represents maximum-normalized mean expression of cells expressing marker genes, and size represents the percentage of cells expressing these genes. (C) UMAP visualization of the tissue distribution in the myeloid compartment. (D) Heatmap showing the distribution of each myeloid cell population across different tissues. Cell numbers are normalized within each tissue and later calculated as proportions across tissues. Only tissues containing more than 50 myeloid cells in at least two donors were included. Asterisks mark significant enrichment in a given tissue relative to the remaining tissues (poisson regression stratified by donors, p < 0.05 after Benjamini-Hochberg (BH) correction). (E) Violin plot for genes differentially expressed in migratory dendritic cells across tissues. Color represents maximum-normalized mean expression of cells expressing marker genes. (F) smFISH visualisation of ITGAX, CCR7 and AIRE transcripts, validating the AIRE+ migratory dendritic cells in lung-draining lymph nodes.
Fig. 3
Fig. 3. B cell compartment across tissues.
(A) UMAP visualization of the cell populations in the B cell compartment. (B) Dot plot for expression of marker genes of the identified B cell populations. Color represents maximum-normalized mean expression of cells expressing marker genes, and size represents the percentage of cells expressing these genes. (C) UMAP visualization of the tissue distribution in the B cell compartment. (D) Heatmap showing the distribution of each B cell population across different tissues. Cell numbers are normalised within each tissue and later calculated as proportions across tissues. Only tissues containing more than 50 B cells in at least two donors were included. Asterisks mark significant enrichment in a given tissue relative to the remaining tissues (poisson regression stratified by donors, p < 0.05 after Benjamini-Hochberg (BH) correction). (E) Stacked bar plots showing the isotype distribution per tissue within memory B cells and the plasma cells. (F) Violin plot of the hypermutation frequency on the IgH chain across isotypes. Significant difference among IgG4, IgG2 and IgG1, as well as between IgA2 and IgA1 is marked by asterisks (wilcoxon rank sum test, p < 0.05). (G) Scatterpie plot showing the tissue distribution and B cell subsets of expanded clonotypes (>10 cells). Each vertical line represents one clonotype.
Fig. 4
Fig. 4. Tissue compartmentalization and site-specific adaptations of T cells and innate lymphoid cells (ILCs).
(A) UMAP visualization of T cells and ILCs across human tissues colored by cell types. (B) Dot plot for expression of marker genes of the identified immune populations. Color represents maximum-normalized mean expression of cells expressing marker genes, and size represents the percentage of cells expressing these genes. (C) UMAP visualization of T cells and ILCs colored by tissues. (D) Heatmap showing the distribution of each T cell or ILC population across different tissues. Cell numbers are normalized within each tissue and later calculated as proportions across tissues. Only tissues containing more than 50 ILC/T cells in at least two donors were included. Asterisks mark significant enrichment in a given tissue relative to the remaining tissues (Poisson regression stratified by donors, p < 0.05 after Benjamini-Hochberg (BH) correction). (E and F) smFISH visualisation of CD3D, CD8A and CRTAM transcripts, validating the tissue-resident memory CD8+ T cell population in the liver and lung-draining lymph nodes. (G) TCR repertoire analysis of T cells across tissues. Stacked bar plot shows the fraction of cells in a given cluster binned by clonotype size. (H) Heatmap showing the repertoire overlap between expanded clones (>1 cell) across tissues and donors as determined by jaccard distance.
Fig. 5
Fig. 5. A cross-tissue updatable reference of immune cell types and cell states.
(A) Heatmap showing the distribution of manually curated cell types across selected tissues. Cell numbers are normalized within each tissue and later calculated as proportions across tissues. Asterisks mark significant enrichment in a given tissue relative to the remaining tissues (Poisson regression stratified by donors, p < 0.05 after Benjamini-Hochberg (BH) correction). (B) Workflow for the iterative update of CellTypist through the periodic incorporation of curated cell type labels.

Comment in

References

    1. Popescu D-M, Botting RA, Stephenson E, Green K, Webb S, Jardine L, Calderbank EF, Polanski K, Goh I, Efremova M, Acres M, et al. Decoding human fetal liver haematopoiesis. Nature. 2019;574:365–371. - PMC - PubMed
    1. Davies LC, Jenkins SJ, Allen JE, Taylor PR. Tissue-resident macrophages. Nat Immunol. 2013;14:986–995. - PMC - PubMed
    1. Gomez Perdiguero E, Klapproth K, Schulz C, Busch K, Azzoni E, Crozet L, Garner H, Trouillet C, de Bruijn MF, Geissmann F, Rodewald H-R. Tissue-resident macrophages originate from yolk-sac-derived erythro-myeloid progenitors. Nature. 2015;518:547–551. - PMC - PubMed
    1. Fan X, Rudensky AY. Hallmarks of Tissue-Resident Lymphocytes. Cell. 2016;164:1198–1211. - PMC - PubMed
    1. Topham DJ, Reilly EC. Tissue-Resident Memory CD8+ T Cells: From Phenotype to Function. Front Immunol. 2018;9:515. - PMC - PubMed