. 2022 May 13;376(6594):eabm6038.
doi: 10.1126/science.abm6038. Epub 2022 May 13.

Noninvasive assessment of gut function using transcriptional recording sentinel cells

Affiliations

Noninvasive assessment of gut function using transcriptional recording sentinel cells

Florian Schmidt et al. Science. .

Abstract

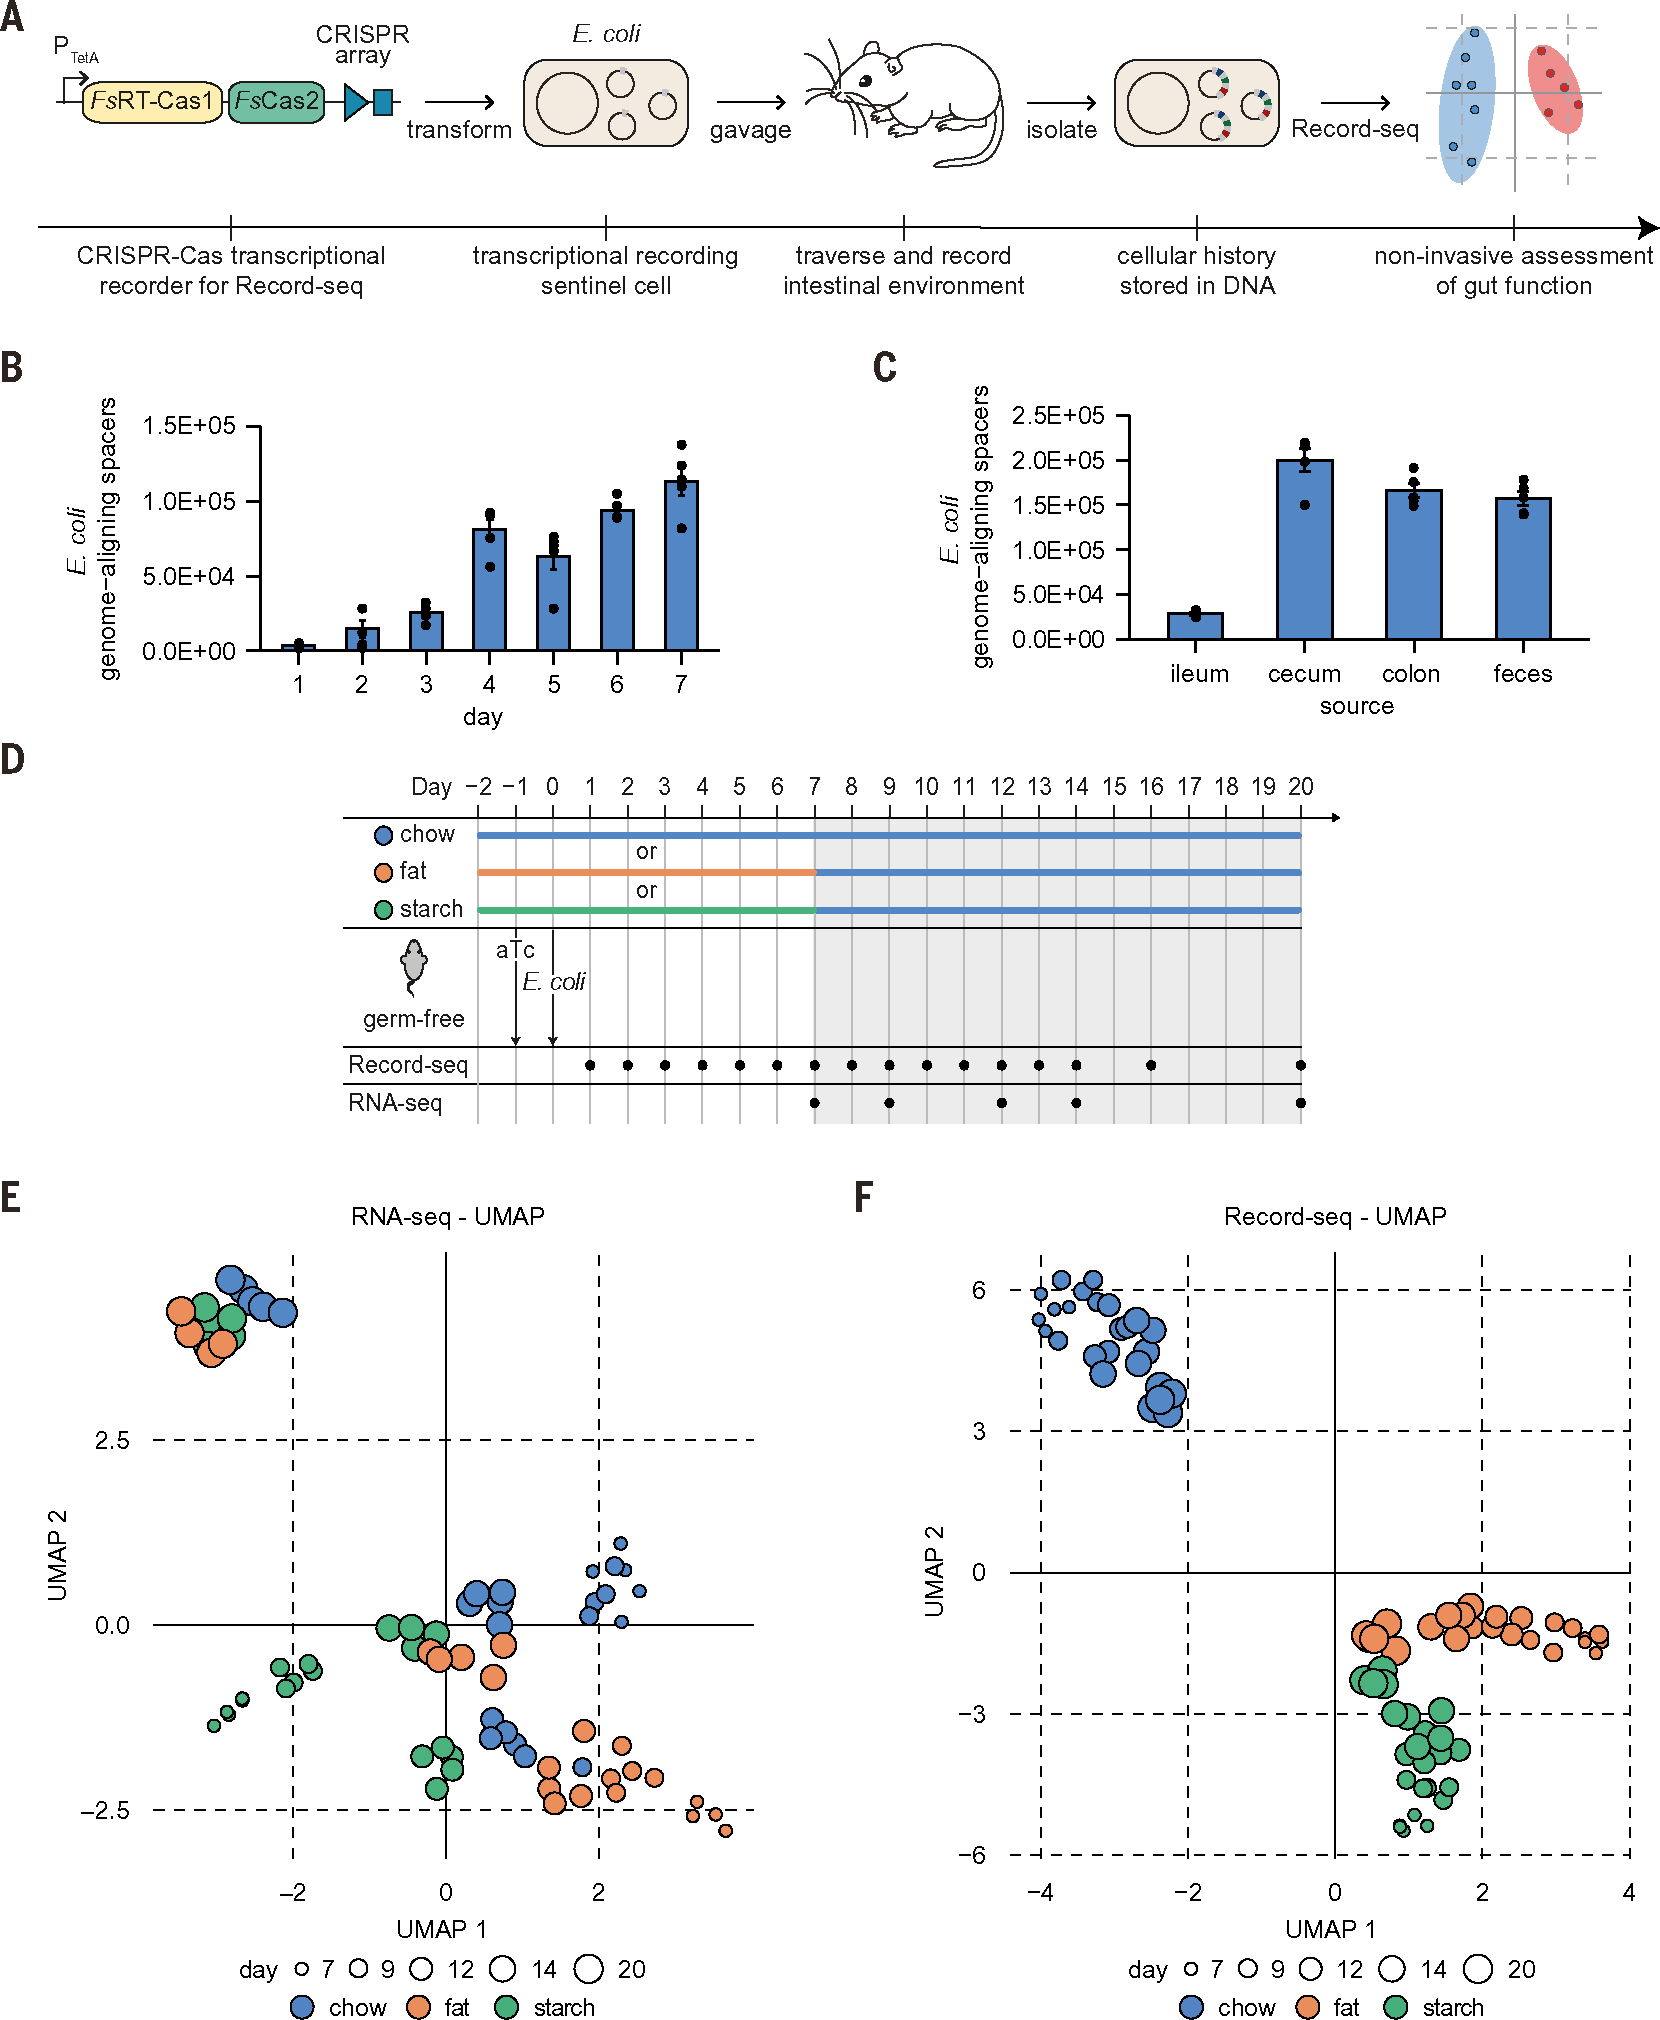
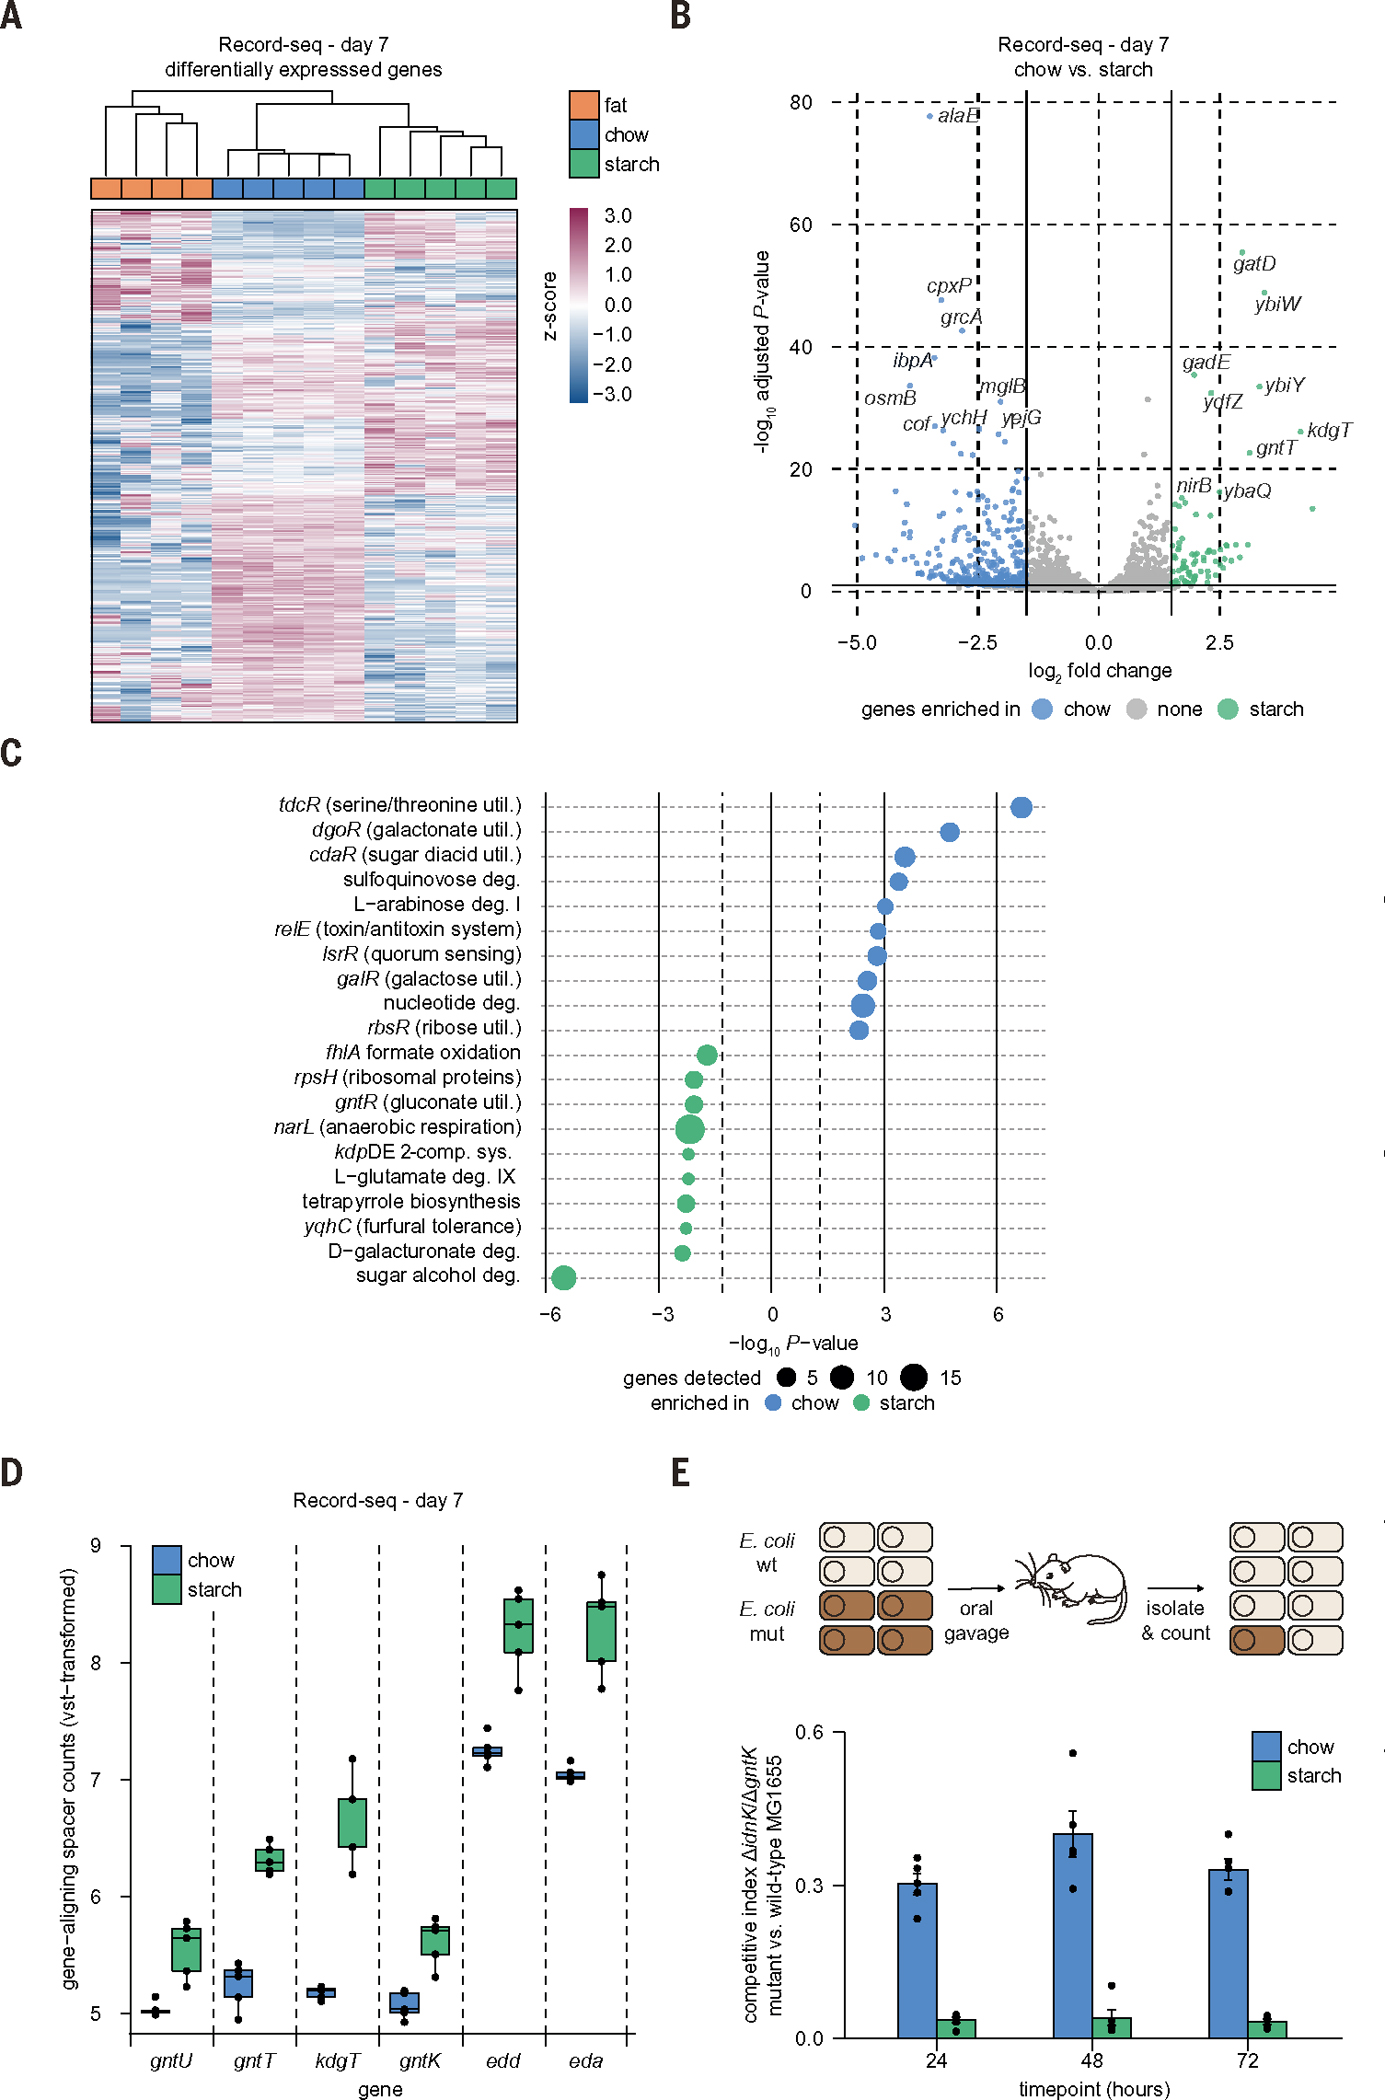
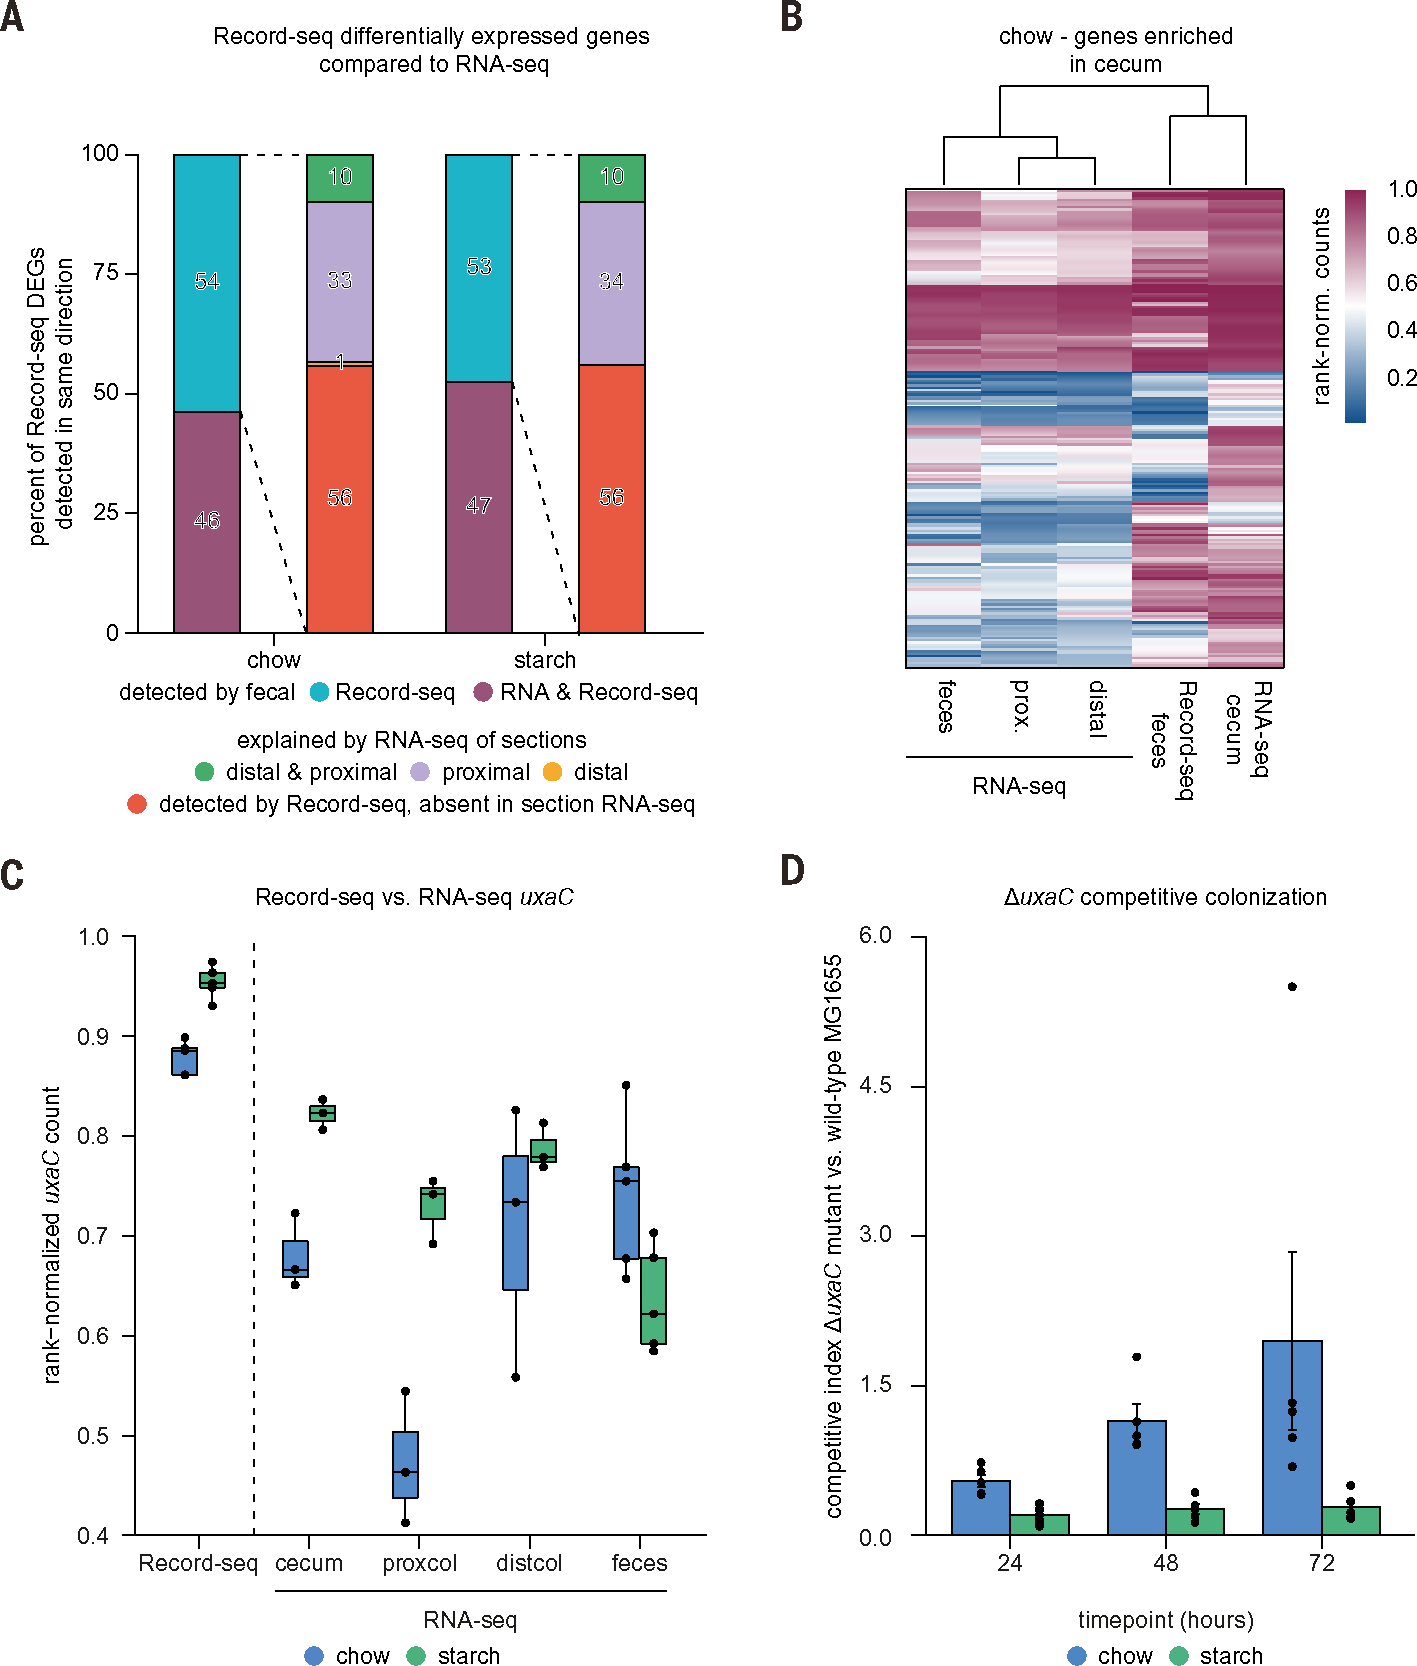
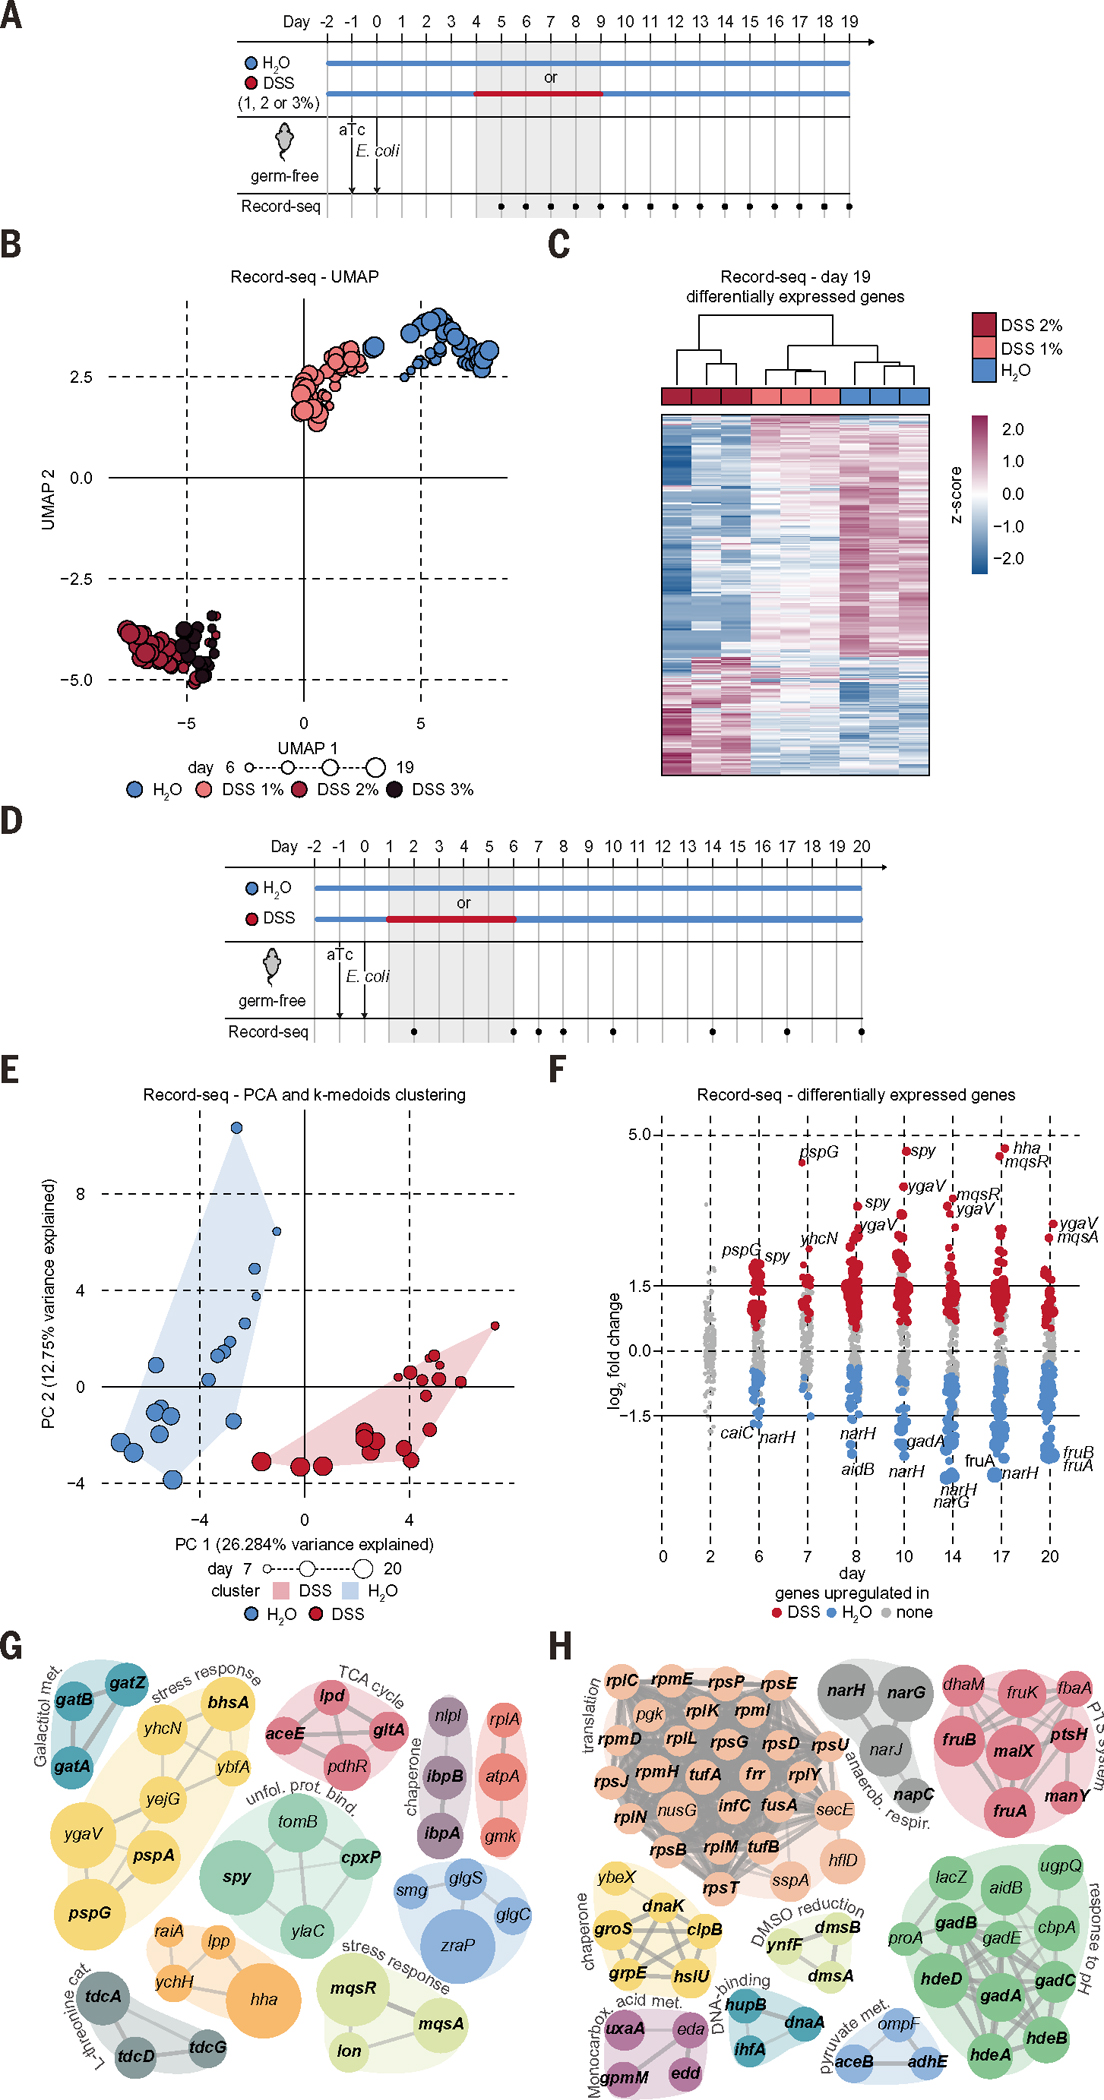
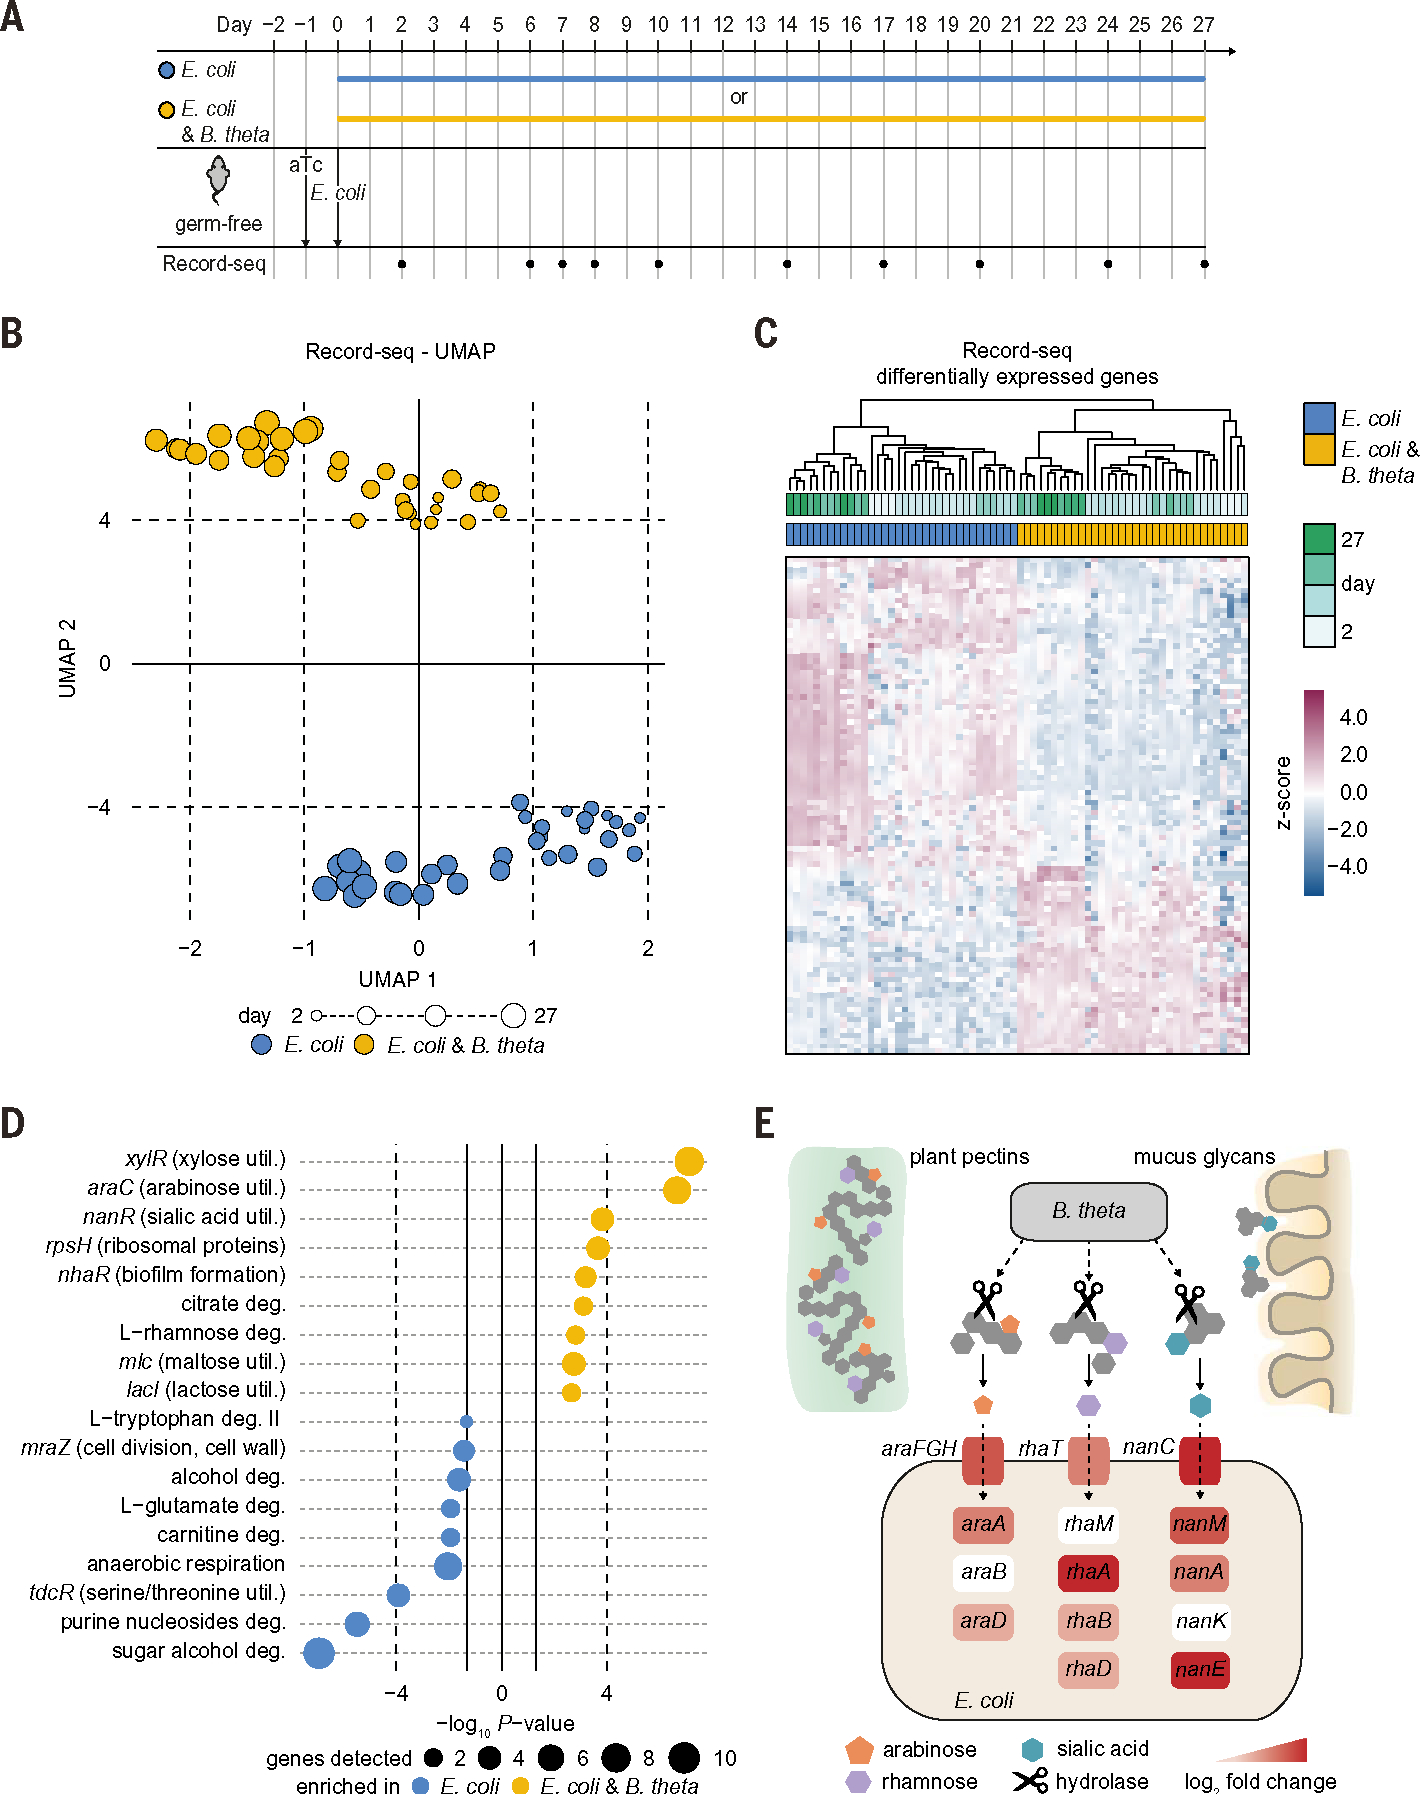
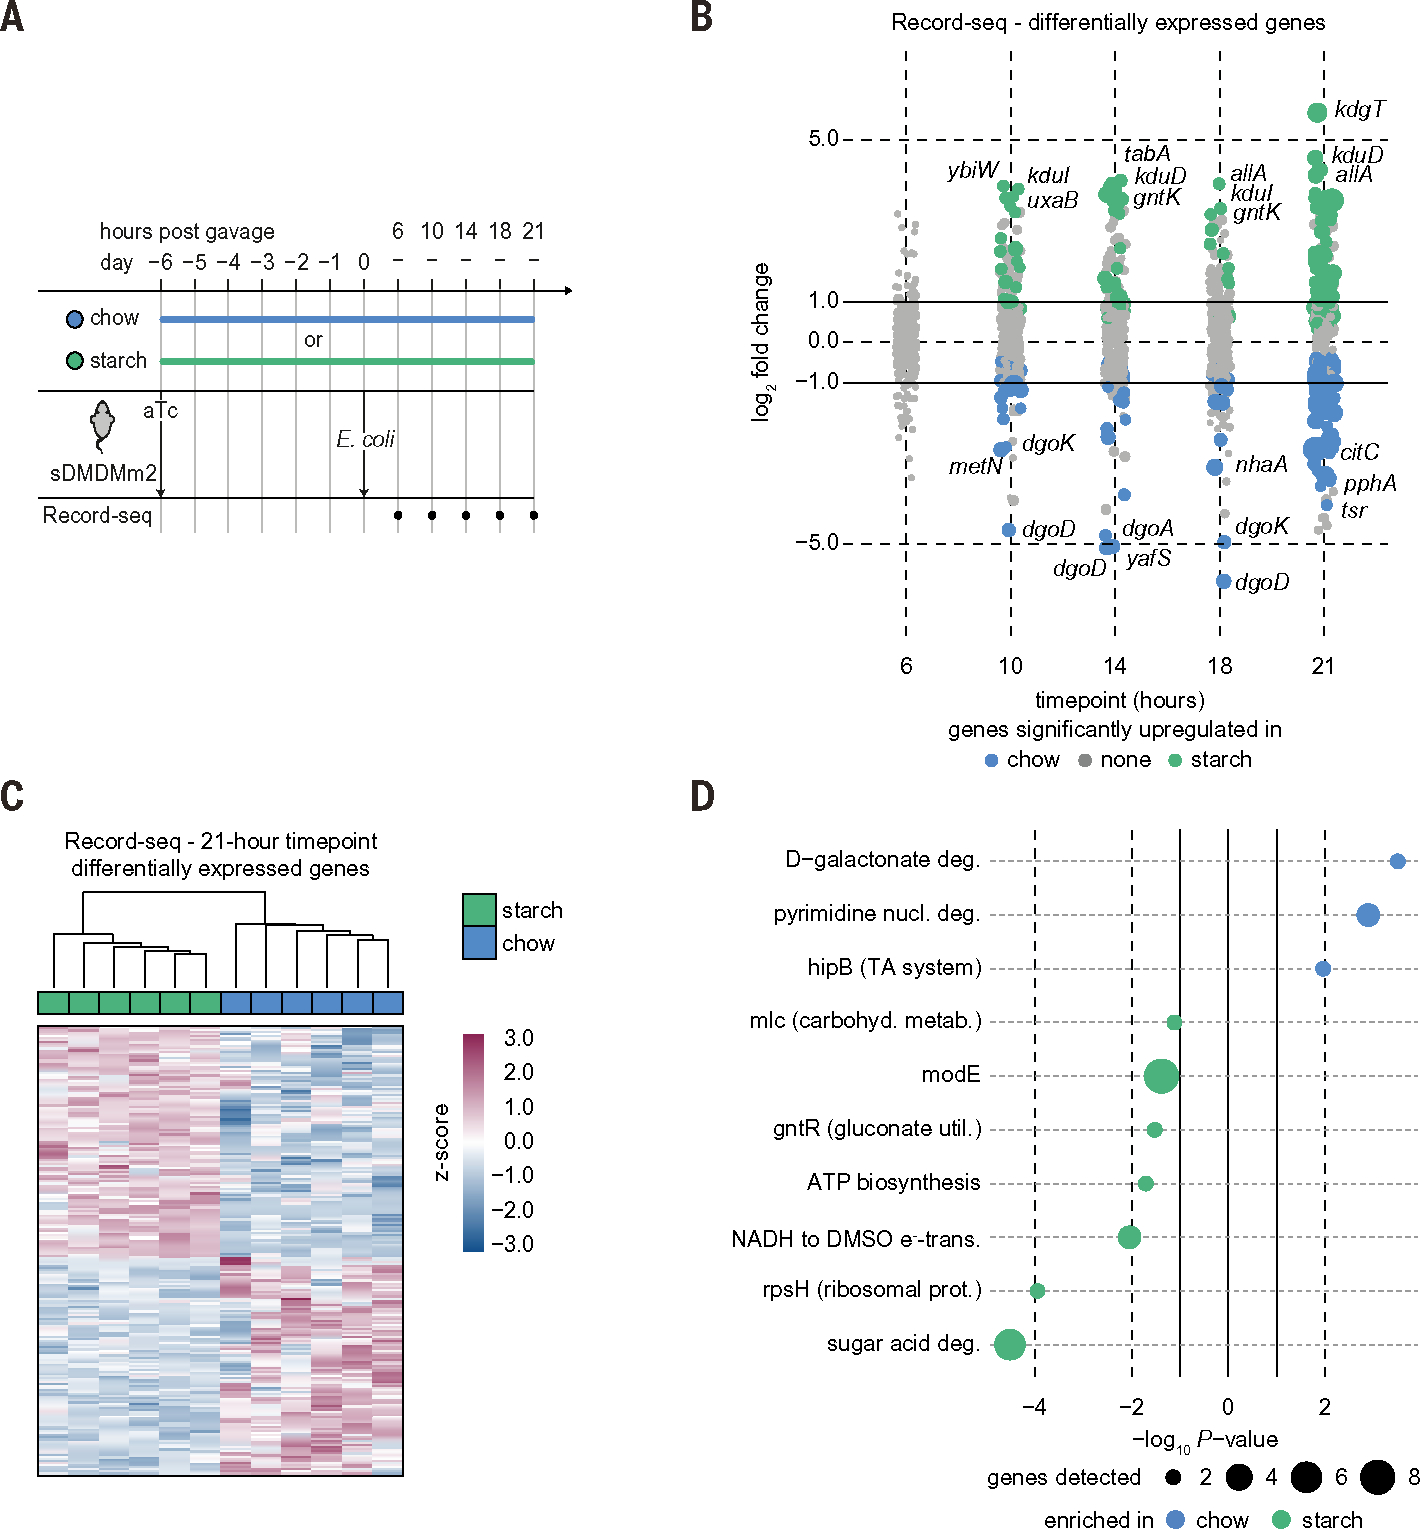
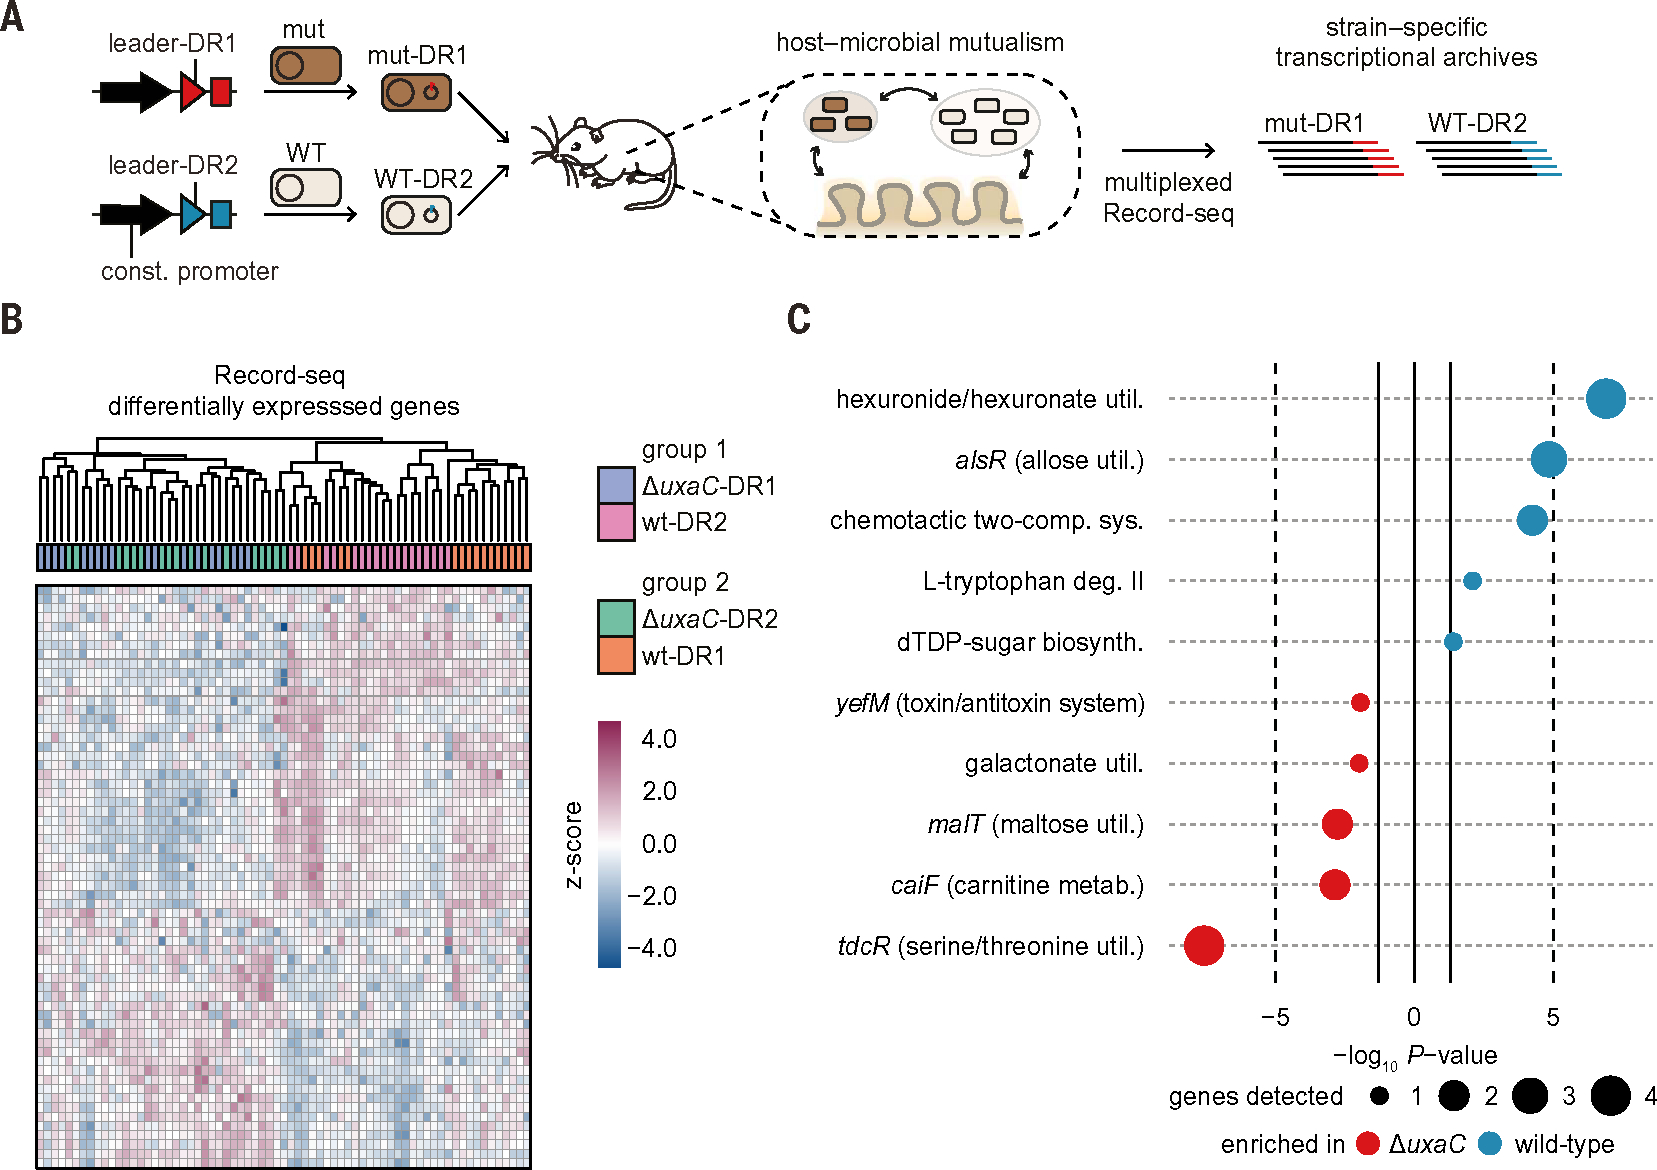
Transcriptional recording by CRISPR spacer acquisition from RNA endows engineered Escherichia coli with synthetic memory, which through Record-seq reveals transcriptome-scale records. Microbial sentinels that traverse the gastrointestinal tract capture a wide range of genes and pathways that describe interactions with the host, including quantitative shifts in the molecular environment that result from alterations in the host diet, induced inflammation, and microbiome complexity. We demonstrate multiplexed recording using barcoded CRISPR arrays, enabling the reconstruction of transcriptional histories of isogenic bacterial strains in vivo. Record-seq therefore provides a scalable, noninvasive platform for interrogating intestinal and microbial physiology throughout the length of the intestine without manipulations to host physiology and can determine how single microbial genetic differences alter the way in which the microbe adapts to the host intestinal environment.


Conflict of interest statement

Competing interests: F.S., J.Z., T.T., A.J.M., and R.J.P. are co-inventors on patent applications filed by ETH Zurich related to this work. All other authors have no competing interests.

Figures

Fig. 1.
Fig. 1.. Transcriptional recording sentinel cells acquire transcriptional records within the mouse gut and preserve this information throughout time.
(A) Schematic of experimental workflow for in vivo experiments with transcriptional recording sentinel cells. E. coli with recording plasmid encoding aTc-inducible FsRT-Cas1–Cas2 and a CRISPR array were orally gavaged into mice. Record-seq was performed on feces or intestinal contents. (B and C) Numbers of E. coli genome-aligning spacers (B) obtained from feces on the indicated days and (C) from the indicated intestinal sections on day 20 after gavage. (B) and (C) show mean ± SEM of n = 5 independent biological replicates. (D) Timeline of longitudinal in vivo recording experiment assessing the impact of diet on the intestinal E. coli transcriptome. Germ-free mice were supplied with aTc in the drinking water and gavaged with E. coli MG1655 transformed with the recording plasmid. Mice were fed a chow, fat, or starch diet starting 2 days before gavage until day 7. After day 7, all groups received the chow diet. Fecal RNA/Record-seq sampling is indicated, with day 7 samples being collected before changing the diets. Data for days 1 to 6, 8, 10, 11, 13, and 16 are shown in (B) and figs. S1A and S2C. (E and F) UMAP embedding of (E) RNA-seq or (F) Record-seq data from E. coli under chow (blue), fat (orange), or starch (green) diet on indicated days corresponding to (D). Dot sizes indicate successive time points; n = 5 independent biological replicates. Count thresholds were 104 (Record-seq) and 105 (RNA-seq). Outliers were excluded on the basis of modified z-score and relative deviation from the mean.
Fig. 2.
Fig. 2.. Record-seq reveals transcriptional changes describing the adaptation of E. coli to diet-dependent intraluminal environments.
(A to C) Record-seq data from day 7 feces of mice fed a chow (blue), fat (orange), or starch (green) diet. (A) Heatmap showing hierarchical clustering by using 1183 differentially expressed genes (DEGs). z-score standardized gene-aligning spacer counts are shown. (B) Volcano plot with DEGs (Padj < 0.1, log2FC > 1.5) indicated. (C) Pathways and transcriptional and translational regulators enriched per diet group by use of EcoCyc. Dot sizes indicate gene numbers detected as significantly up-regulated for the respective pathway. (D) Box plot showing vst-transformed E. coli genome-aligning spacer counts for selected genes involved in gluconate metabolism corresponding to the indicated diets. (E) Competitive colonization experiment. Germ-free mice fed either a chow or starch diet were orally gavaged with a 1:1 mixture of WT E. coli MG1655 and E. coli MG1655 ΔidnKgntK (mut). Competitive indices were calculated from fecal recoveries as the ratio of mutant to WT CFU (mean ± SEM, n = 5 independent biological replicates, P = 3.93 × 10⁻¹⁷ likelihood ratio test representative result of two independent experiments). (A) to (D) correspond to Fig. 1D; n = 5 independent biological replicates. Count thresholds were 104 (Record-seq) and 105 (RNA-seq). Outliers were excluded on the basis of modified z-score and relative deviation from the mean.
Fig. 3.
Fig. 3.. Record-seq sentinel cells capture the milieu along the length of the intestine and preserve transient features of proximal large intestinal segments.
Mice colonized with Record-seq sentinel cells were fed a chow or starch diet for 7 days. (A) Stacked bar plots showing fractions of Record-seq DEGs that were also detected with RNA-seq from feces or intestinal segments as up-regulated under a chow (430 genes) or starch diet (278 genes). Record-seq DEGs not identified with fecal RNA-seq (left bar) are categorized according to differential RNA expression in isolated gut sections (right bar): cecum or proximal colon (“proximal”), distal colon (“distal”), or both proximal and distal sections (“distal and proximal”). (B) Heatmap of cecum signature genes (213 genes overexpressed in the cecum) showing hierarchical clustering of rank-normalized RNA-seq and Record-seq data from the indicated intestinal sections from mice fed a chow diet. (C) Box plot showing E. coli rank-normalized counts of uxaC as determined with Record-seq or RNA-seq from feces, cecum, proximal colon, and distal colon corresponding to the indicated diets on day 7. Data in (A) to (C) are a combined analysis of n = 3 biological replicates per group, each pooled from n = 3 individual mice for gut sections RNA-seq, and n = 5 biological replicates per group for fecal RNA-seq and Record-seq. Count thresholds were 104 (Record-seq) and 105 (RNA-seq). Outliers were excluded on the basis of modified z-score and relative deviation from the mean. (D) Competitive colonization experiment. Germ-free mice fed either a chow or starch diet were orally gavaged with a 1:1 mixture of WT E. coli MG1655 and E. coli MG1655 ΔuxaC. Competitive indices were calculated from fecal ratios of mutant to WT CFU [mean ± SEM, n = 5 independent biological replicates, P = 0.0022 likelihood ratio test (representative result of two independent experiments)].
Fig. 4.
Fig. 4.. Record-seq provides a noninvasive assessment of DSS-induced intestinal inflammation.
(A) Timeline of DSS colitis recording experiment. Germ-free mice were supplied with aTc in the drinking water; gavaged with E. coli BL21(DE3) sentinel cells; and received 1, 2, or 3% DSS or water as indicated. Fecal Record-seq sampling is indicated. (B) UMAP embedding of Record-seq data for control mice (blue) or mice treated with 1% (salmon), 2% (red), or 3% (black) DSS. Dot sizes indicate successive time points. Mice receiving 3% DSS had to be euthanized on day 13. (C) Heatmap showing hierarchical clustering of Record-seq DEGs from control mice (blue) or mice treated with 1% (salmon) or 2% (red) DSS, day 19. z-score standardized gene-aligning spacer counts are shown. (D) Timeline of DSS colitis recording experiment. Germ-free mice were supplied with aTc in the drinking water, gavaged with E. coli MG1655 sentinel cells, and given 2% DSS or water as indicated. Fecal Record-seq sampling is indicated. (E) PCA-projected Record-seq data on days 7, 8, 10, 14, 17, and 20 for control mice (blue) or mice treated with 2% DSS (red). K-medoids clusters are indicated with convex hulls. Dot sizes indicate successive time points. (F) Dot plot showing log2FC for Record-seq DEGs identified for control mice (blue) or mice treated with 2% DSS (red). Dot sizes increase with significance (Padj range, 9.8 × 10⁻¹⁹ to 1.0). (G and H) STRING analysis of DEGs significantly (G) up-regulated or (H) down-regulated under DSS treatment compared with that of control. Node size increases with log2FC [(G) 0.5 to 4.7; (H) 0.5 to 2.9]. (B) and (C) correspond to the experiment in (A), with n = 3 independent biological replicates. (E) to (H) correspond to the experiment in (D), with n = 3 to 4 independent biological replicates of each condition. Count thresholds were 5× 10³ in (B) and (C) and 104 in (E) to (H). Outliers were excluded on the basis of modified z-score and relative deviation from the mean.
Fig. 5.
Fig. 5.. Record-seq illuminates both host-microbe and microbe-microbe interactions.
(A) Timeline of longitudinal in vivo recording experiment on interaction of E. coli with B. theta in the gut. Germ-free mice were supplied with aTc in the drinking water and gavaged with E. coli MG1655 sentinel cells alone or together with B. theta. Fecal Record-seq sampling is indicated. (B) UMAP embedding of Record-seq data from E. coli in the presence (yellow) or absence (blue) of B. theta on the indicated days. Dot sizes indicate successive time points. (C) Heatmap showing hierarchical clustering of Record-seq data from E. coli in the presence (yellow) or absence (blue) of B. theta on the indicated days by using identified DEGs. z-score standardized gene-aligning spacer counts are shown. (D) Pathways and transcriptional and translational regulators identified as enriched (P < 0.05) by use of EcoCyc in E. coli in the presence (yellow) or absence (blue) of B. theta on days 2 to 27. Dot sizes indicate gene numbers significantly up-regulated for the respective pathway. (E) Schematic depicting nutrient cross-feeding relationship between E. coli and B. theta inferred by Record-seq. E. coli genes encoding transporters and enzymes are depicted with color codes reflecting their Record-seq–based log2FC of up-regulation in the presence versus absence of B. theta (0 to 5.0). (B) to (E) correspond to (A), with n = 4 independent biological replicates of each condition. Count threshold was 5 × 10³. Outliers were excluded on the basis of modified z-score and relative deviation from the mean.
Fig. 6.
Fig. 6.. Sentinel cells are deployable within a complex microbiota.
(A) Timeline of complex microbiota recording experiment. Mice harboring a representative 12-member intestinal microbiota (sDMDMm2) were placed on either a chow or starch diet, supplied with aTc in the drinking water, and gavaged with a dose of 7 × 10¹⁰ CFU aTc-pretreated E. coli MG1655 as indicated. Fecal Record-seq sampling is indicated. (B) Dot plot showing the log2FC for Record-seq DEGs corresponding to the indicated diet and time. Dot sizes increase with significance (Padj range, 1.9 × 10⁻¹⁷ to 1.0). Colored dots indicate a Padj < 0.1, and gray dots indicate nonsignificant differences. (C) Heatmap showing hierarchical clustering of Record-seq data at 21 hours from mice fed a chow (blue) or starch (green) diet based on identified DEGs. z-score standardized gene-aligning spacer counts are shown. (D) Pathways and transcriptional and translational regulators identified as enriched (P < 0.05) in mice fed chow (blue) or starch (green) by use of EcoCyc. Dot sizes increase with number of genes detected as significantly up-regulated for the respective pathway. (B) to (D) correspond to (A), with n = 6 independent biological replicates for each diet. Count threshold was 5 × 10³. Outliers were excluded on the basis of modified z-score and relative deviation from the mean.
Fig. 7.
Fig. 7.. Sentinel cells enable multiplexed transcriptional profiling of isogenic bacterial strains coinhabiting the mouse intestine.
(A) Schematic for multiplexed in vivo recording with sentinel cells barcoded by their CRISPR array. Recording plasmids with either a leader-DR1 or leader-DR2 CRISPR array were transformed into WT or mutant E. coli cells and orally gavaged into mice at a 1:1 ratio. Spacers were assigned to the appropriate strain by using the leader-DR barcode. (B) Germ-free mice on a starch diet were orally gavaged with a 1:1 mixture of WT and uxaC-deficient barcoded E. coli sentinel cells. Two different pairings between genotype (WT or ΔuxaC) and CRISPR array (DR1 or DR2) were used. Group 1 was given ΔuxaC-DR1 (blue) and WT-DR2 (pink). Group 2 was given ΔuxaC-DR2 (green) and WT-DR1 (orange). Fecal Record-seq samples were collected daily from day 7 to day 10, and a combined heatmap is shown. Hierarchical clustering was performed by using the top 50 DEGs detected in both comparisons. z-score standardized gene-aligning spacer counts are shown. (C) Pathways and transcriptional and translational regulators identified as enriched (P < 0.05) by use of EcoCyc on the basis of high-confidence DEGs between ΔuxaC (red) and WT (blue) E. coli. Dot sizes indicate gene number significantly up-regulated for the respective pathway. (B) and (C) correspond to fig. S11A, with n = 5 independent biological replicates of each condition and days 7 to 10. Count threshold was 104. Outliers were excluded on the basis of modified z-score and relative deviation from the mean.

Comment in

Similar articles

Cited by

References

    1. Sheth RU, Wang HH, DNA-based memory devices for recording cellular events. Nat. Rev. Genet. 19, 718–732 (2018). doi: 10.1038/s41576-018-0052-8; - DOI - PMC - PubMed
    1. Farzadfard F, Lu TK, Emerging applications for DNA writers and molecular recorders. Science 361, 870–875 (2018). doi: 10.1126/science.aat9249 - DOI - PMC - PubMed
    1. Schmidt F, Platt RJ, Applications of CRISPR-Cas for synthetic biology and genetic recording. Curr. Opin. Syst. Biol. 5, 9–15 (2017). doi: 10.1016/j.coisb.2017.05.008 - DOI
    1. Shipman SL, Nivala J, Macklis JD, Church GM, Molecular recordings by directed CRISPR spacer acquisition. Science 353, aaf1175 (2016). doi: 10.1126/science.aaf1175 - DOI - PMC - PubMed
    1. Ishiguro S, Mori H, Yachie N, DNA event recorders send past information of cells to the time of observation. Curr. Opin. Chem. Biol. 52, 54–62 (2019). doi: 10.1016/j.cbpa.2019.05.009 - DOI - PubMed

MeSH terms