. 2022 May 13;376(6594):eabl4290.
doi: 10.1126/science.abl4290. Epub 2022 May 13.

Single-nucleus cross-tissue molecular reference maps toward understanding disease gene function

Affiliations

Single-nucleus cross-tissue molecular reference maps toward understanding disease gene function

Gökcen Eraslan et al. Science. .

Abstract

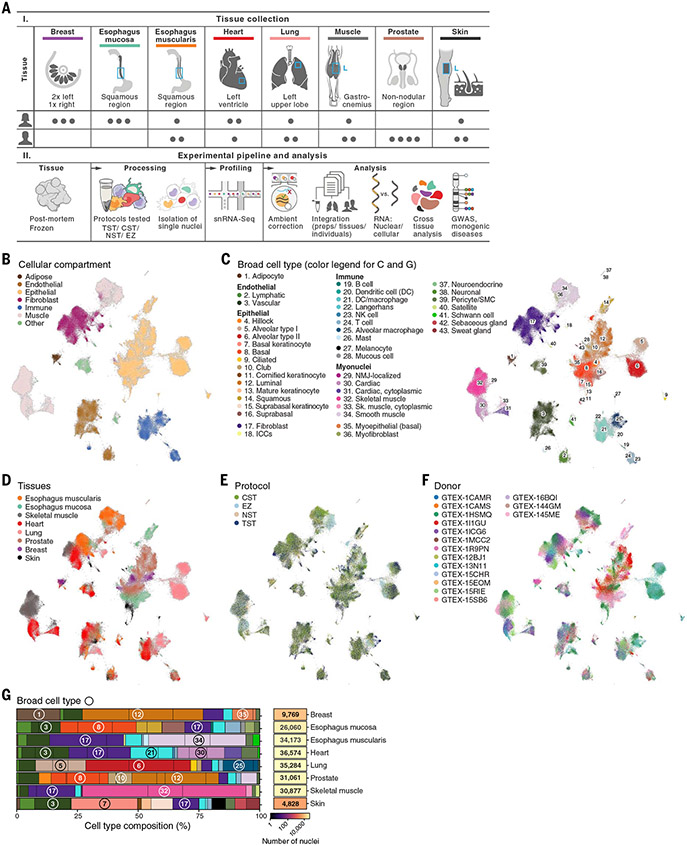
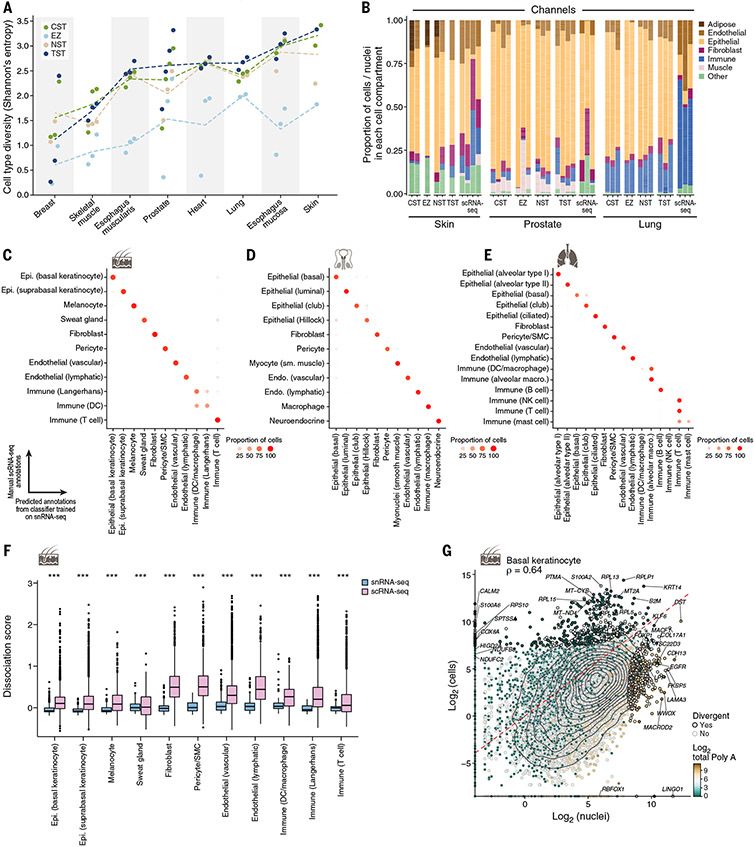
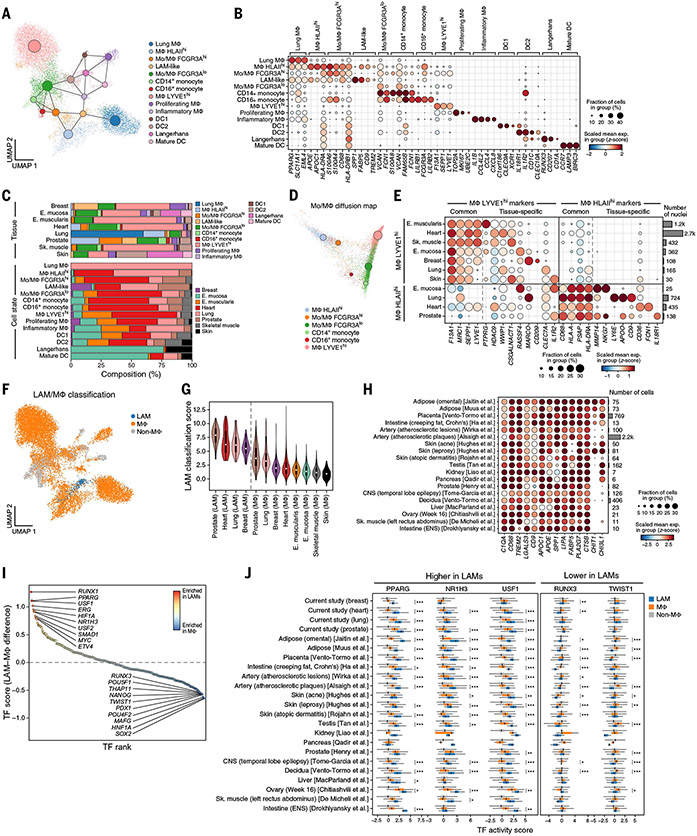
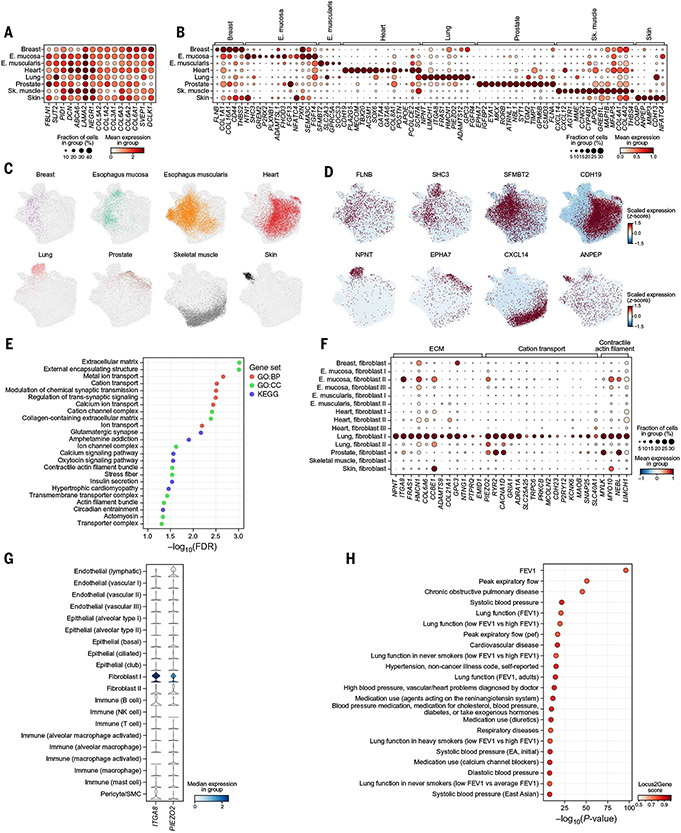
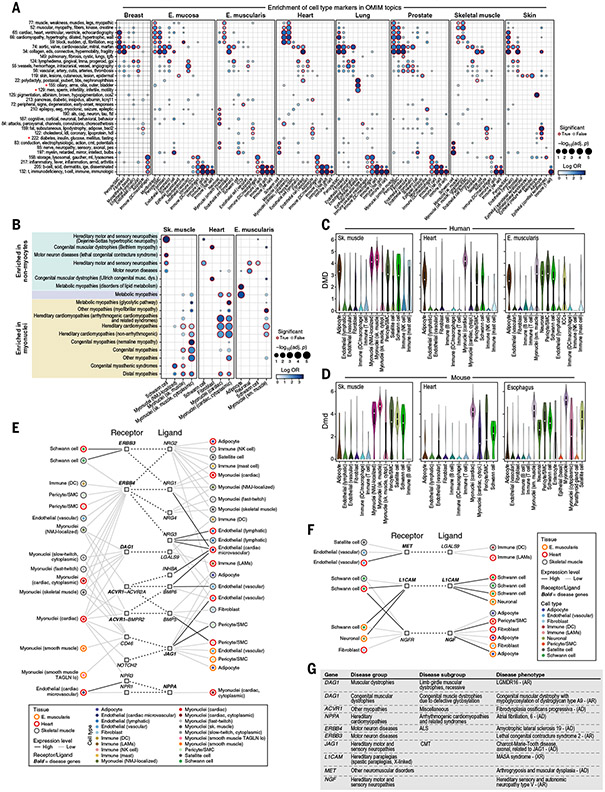
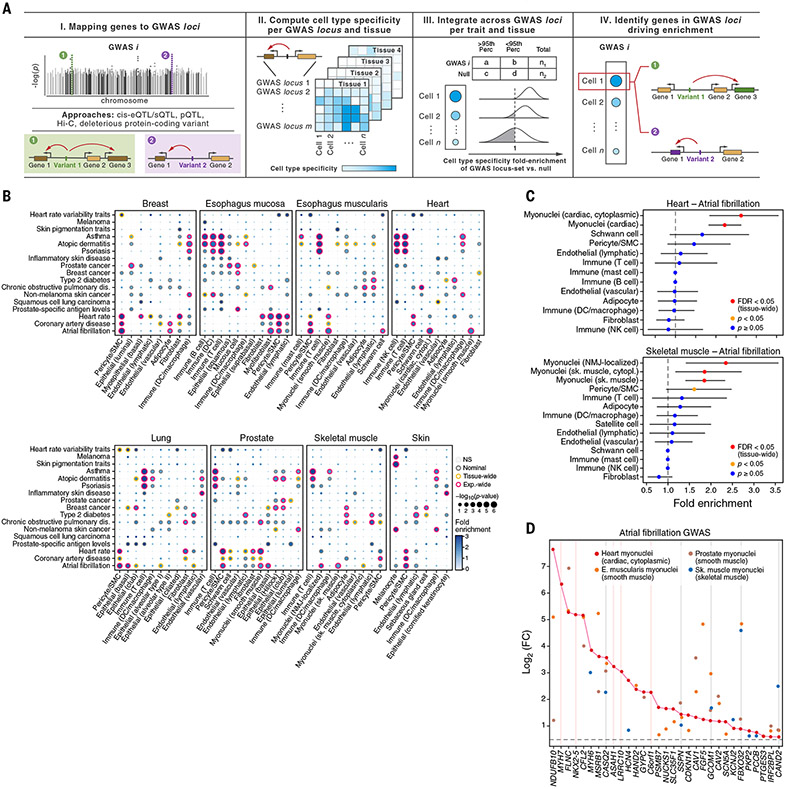
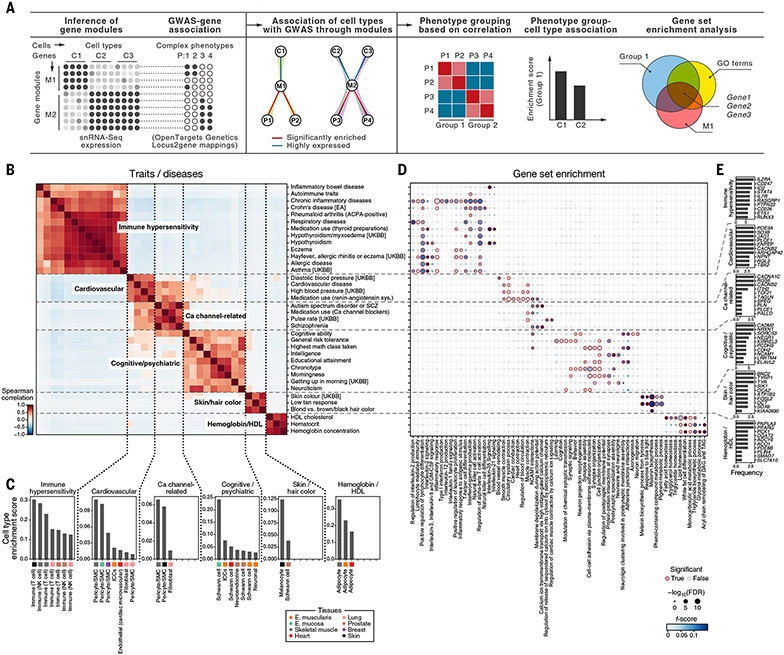
Understanding gene function and regulation in homeostasis and disease requires knowledge of the cellular and tissue contexts in which genes are expressed. Here, we applied four single-nucleus RNA sequencing methods to eight diverse, archived, frozen tissue types from 16 donors and 25 samples, generating a cross-tissue atlas of 209,126 nuclei profiles, which we integrated across tissues, donors, and laboratory methods with a conditional variational autoencoder. Using the resulting cross-tissue atlas, we highlight shared and tissue-specific features of tissue-resident cell populations; identify cell types that might contribute to neuromuscular, metabolic, and immune components of monogenic diseases and the biological processes involved in their pathology; and determine cell types and gene modules that might underlie disease mechanisms for complex traits analyzed by genome-wide association studies.


Figures

Fig. 1.
Fig. 1.. Cross-tissue snRNA-seq atlas in eight archived, frozen adult human tissues.
(A) Study design. (B to F) Cross-tissue single-nucleus atlas. Uniform manifold approximation and projection (UMAP) representation of single-nucleus profiles (dots) colored by main compartments (B), broad cell types (C), tissues (D), isolation protocol (E), and individual donors (F). (G) Cell-type composition across tissues. The overall proportion of cells (%) of each type and number of nuclei profiled in each tissue (rows) are shown. Numbers in circles indicate the corresponding broad cell type. Black vertical lines indicate the relative proportion of nuclei from each individual.
Fig. 2.
Fig. 2.. Concordance of cell-type diversity and cell-intrinsic profiles between snRNA-seq and scRNA-seq.
(A) Cell-type diversity (Shannon entropy, y axis) of each protocol (color) in each sample (dot) and tissue (x axis). Dashed lines indicate the average across samples. (B) Differences in cell proportions. The proportions (y axis) of cells from major categories (color) in each individual by tissue and protocol (x axis) are shown. (C to E) Concordance of cell-intrinsic programs. Proportions of cells (dot color and size) of a manually annotated group (rows) predicted to belong to a given nucleus profile annotation label (columns) by a random forest classifier trained on nuclei and applied to cells of the same tissue for skin (C), lung (D) or prostate (E) are shown. (F) Tissue dissociation expression signatures in scRNA-seq. Scores [y axis, average background corrected log(TP10K+1)] of a dissociation-related stress signature (41) in scRNA-seq (pink) and snRNA-seq (blue) profiles in each major lung cell type (x axis) are shown (***Benjamini-Hochberg FDR < 10−16, Wilcoxon rank sum test). Box plots show median, quartiles, and whiskers at 1.5 times the interquartile range (IQR). (G) Divergent genes between cell and nucleus profiles. Averaged pseudobulk expression (28) of protein-coding genes (dots) in skin basal keratinocyte nuclei (x axis) and cells (y axis) is shown. Divergent genes are represented by a black dot outline. The color scale shows the total length of polyA stretches with at least 20 adenine bases in log2 scale. Epi., epithelial; sm., smooth; SMC, smooth muscle cell.
Fig. 3.
Fig. 3.. A dichotomy between LYVE1- and HLAII–expressing macrophages and LAM-like populations across tissues.
(A) Myeloid profiles (dots), colored by cell type and state and overlaid with a PAGA graph of myeloid states (large nodes). (B) Expression of marker genes (columns) associated with each subset (rows). (C) Myeloid cell distribution across tissues. The overall proportion of myeloid cell subsets (colors) in each tissue (bars) is shown at the top, and the overall proportion of cells from each tissue in each subset (bars) is shown at the bottom. (D) LYVE1high and HLAIIhigh macrophages are end points of two differentiation trajectories. A diffusion map of monocytes, macrophages, and transitional subsets (colors) is shown. Large circles represent centroids (sizes are proportional to population size). (E) Cross-tissue and tissue-specific markers. Expression of marker genes (columns) associated with two myeloid subsets (left) in each tissue (rows) is shown. The right bar plot shows the number of nuclei. (F to H) LAM-like cells across tissues. Myeloid cells (dots) colored by their classification [legend; (28)] are shown in (F). Classification scores (y axis) of LAM-like and other macrophages across tissues (x axis) are shown in (G). Expression of LAM marker genes (columns) in LAM-like profiles from other studies (rows) is shown in (H). (I and J) Inferred TFs regulating the LAM-like program. TF differential activity scores between LAMs and other macrophages (y axis) for each TF (dot) ranked by score (x axis) are shown in (I). TF differential activity scores (x axis) for three TFs with significantly high scores (two tailed t test; Benjamini-Hochberg *FDR < 0.05, **FDR < 0.01, and ***FDR < 0.001) in LAMs or other macrophages are shown in (J). Box plots show median, quartiles, and whiskers at 1.5 times the IQR. E., esophagus; ENS, enteric nervous system; Sk., skeletal.
Fig. 4.
Fig. 4.. Shared and tissue-specific fibroblast features.
(A and B) Expression in each tissue subset (rows) of marker genes (columns) distinguishing fibroblasts from nonfibroblasts across all tissues (A) or enriched in fibroblasts in one versus other tissues (B). (C and D) Fibroblast profiles (dots) colored by tissue (C) or expression of the most exclusive marker (D). (E) Significance [−log10(FDR), x axis] of gene sets (y axis) enriched (FDR < 5%) in genes covarying with the lung-specific fibroblast signature. (F) Expression of ECM and cation transport genes (columns) in the covarying gene module in each granular fibroblast subtype in each tissue (rows). (G) ITGA8 and PIEZO2 (columns) expression in granular cell types (rows) in lung. (H) Significance (x axis) and Open Targets Genetics locus-to-gene score (color) of the most significant variants mapped to NPNT with a high (>0.5) locus-to-gene score in GWASs (y axis). FEV, forced expiratory volume.
Fig. 5.
Fig. 5.. Monogenic muscle disease genes related to cell types and interactions across cardiac, skeletal, and smooth muscle tissues.
(A) Enrichment of monogenic disease groups to broad cell types. Effect size (log odds ratio, dot color) and significance [−log10(FDR), dot size] of enrichment of genes from disease topics [rows; (28)] in broad cell-type markers in each tissue (columns) are shown. A red outline indicates an FDR less than 0.1. Topic names consist of the topic identifier and five words with the highest loadings. Red stars indicate highlighted topics. (B) Relation of broad cell types to monogenic muscle disease groups. Effect size and significance of enrichment of genes from monogenic muscle disease groups (rows) for broad cell type markers in each tissue (columns) are shown. A red outline indicates an FDR less than 0.1. Color shading indicates disease groups associated with only nonmyocytes (green), only myonuclei (yellow), or both (light purple). (C and D) DMD expression in human (C) and mouse (D) muscle. Cell types (x axis) are ordered, left to right, such that the cell types that are shared between human and mouse within a tissue are presented first and species-specific cell types follow. (E and F) Putative cell-cell interactions in muscle implicating muscle disease genes. Shown are cell types (inner color) from muscle tissues (outer color) connected by putative interactions (dotted edges) between a receptor (left square) expressed in one cell type and a ligand (right square) expressed in the other in interactions involving myocytes (E) or only nonmyocytes (F). Black and gray connecting lines between cell types and genes indicate high and low expression, respectively. Bold formatting indicates a muscle disease gene. (G) Diseases highlighted in (E) and (F). ALS, amyotrophic lateral sclerosis; AD, autosomal dominant; AR, autosomal recessive; CMT, Charcot-Marie-Tooth disease; XR, X-linked recessive.
Fig. 6.
Fig. 6.. Cell type–specific enrichment of eQTL and sQTL target genes mapped to GWAS loci.
(A) Schematic of the method (ECLIPSER). (B) Cell-type enrichment of genes mapped to GWAS loci for 17 of the 21 complex traits tested with at least one tissue-wide significant result (FDR < 0.05, correcting for all cell types tested per tissue per trait) across eight GTEx tissues. Gray, orange, and red borders indicate nominal, tissue-wide, and experiment-wide significance (FDR < 0.05, correcting for all cell types tested across eight tissues and 21 traits), respectively. Only cell types with at least one tissue-wide enrichment are shown. (C and D) Myonuclei and pericyte genes enriched in atrial fibrillation GWAS loci (tissue-wide FDR < 0.05, Bayesian Fisher’s exact test). Fold-enrichment (x axis) of cell types (y axis) for atrial fibrillation GWAS in heart (top) and skeletal muscle (bottom) is shown in (C). Error bars represent 95% credible intervals. Red indicates tissue-wide significance, orange indicates nominal significance, and blue indicates nonsignificance (P ≥ 0.05, Bayesian Fisher’s exact test). Differential expression in myonuclei versus other cell types from heart (red), skeletal muscle (blue), esophagus muscularis (orange), and prostate (brown) of the genes (x axis) driving enrichment of atrial fibrillation GWAS loci in heart cardiac myonuclei is shown in (D). Gray and pink vertical lines indicate log2(fold change) > 0.5 and FDR < 0.1 in myonuclei in all four tissues or only in heart, respectively. FC, fold change.
Fig. 7
Fig. 7. Cell types and gene modules relevant for trait and disease groups by GWAS module enrichment.
(A) Schematic of the module-based enrichment method. Shaded edges indicate associations between cell types and phenotypes through modules (middle). (B to E) Trait and disease groups identified by GWAS-cell type relationships. Similarity (Spearman correlation coefficient) between GWAS traits and diseases (rows and columns) by enriched cell types is shown in (B). Dashed lines demarcate trait and disease groups. Shown in (C) is the cell-type enrichment for each of the GWAS-enriched modules. Significance [−log10(FDR), circle size] and F score (circle color) of enrichment of gene sets (columns) with the genes in the intersection of a gene module and GWAS genes for each trait or disease in (B) (rows) are shown in (D). A red outline indicates an FDR less than 0.1. Shown in (E) is the number of traits (x axis) in each module in (B) where a gene (y axis) is detected as the driver of the association in the intersection of the gene modules, a trait or disease enriched in the module, and a functional gene set for the top 10 most frequently identified genes in the enrichment analysis of each module. EA, East Asian; SCZ, Schizophrenia; UKBB, UK Biobank.

Comment in

References

    1. Tam V et al., Benefits and limitations of genome-wide association studies. Nat. Rev. Genet 20, 467–484 (2019). doi: 10.1038/s41576-019-0127-1 - DOI - PubMed
    1. Mills MC, Rahal C, A scientometric review of genome-wide association studies. Commun. Biol 2, 9 (2019). doi: 10.1038/s42003-018-0261-x - DOI - PMC - PubMed
    1. Cano-Gamez E, Trynka G, From GWAS to function: Using functional genomics to identify the mechanisms underlying complex diseases. Front. Genet 11, 424 (2020). doi: 10.3389/fgene.2020.00424 - DOI - PMC - PubMed
    1. Camp JG, Platt R, Treutlein B, Mapping human cell phenotypes to genotypes with single-cell genomics. Science 365, 1401–1405 (2019). doi: 10.1126/science.aax6648 - DOI - PubMed
    1. Sun G et al., Single-cell RNA sequencing in cancer: Applications, advances, and emerging challenges. Mol. Ther. Oncolytics 21, 183–206 (2021). doi: 10.1016/j.omto.2021.04.001 - DOI - PMC - PubMed